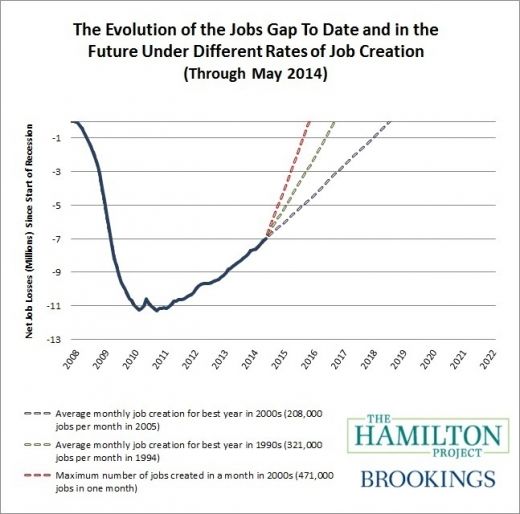
Each month, The Hamilton Project calculates America’s “jobs gap,” or the number of jobs that the U.S. economy needs to create in order to return to pre-recession employment levels while absorbing the 125,000 people who enter the labor force each month. As of the end of May 2014, our nation faces a jobs gap of 7.0 million jobs.
The chart below shows how the jobs gap has evolved since the start of the Great Recession in December 2007, and how long it will take to close under different assumptions for job growth. The solid line shows the net number of jobs lost since the Great Recession began. The broken lines track how long it will take to close the jobs gap under alternative assumptions about the rate of job creation going forward. If the economy adds about 208,000 jobs per month, which was the average monthly rate for the best year of job creation in the 2000s, then it will take until August 2018 to close the jobs gap. Given a more optimistic rate of 321,000 jobs per month, which was the average monthly rate of the best year of job creation in the 1990s, the economy will reach pre-recession employment levels by September 2016.
- See the updated interactive “jobs gap” calculator»
- See more of The Evolution of the “Job Gap” and Possible Scenarios for Growth»
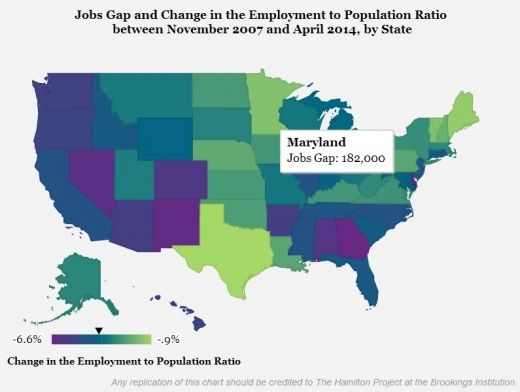
State-by-State “Jobs Gap” Numbers for April 2014
The job loss that has occurred since the onset of the Great Recession has not been evenly distributed across the country. The Hamilton Project’s state-by-state “jobs gap” chart shows the difference in the employment-to-population ratio (in percentage points) in every state between the start of the recession and today. By hovering over a state, you can also see the number of jobs each state would have to add in order to bring its employment-to-population ratio to its pre-recession level.