
A joint Hamilton Project-AEI report.
Introduction
The modern economy has never been more reliant on data. Businesses, governments, and families must navigate the complexities of a world made possible by new technologies and innovative business practices. Without reliable information about the economic and social environment, it is impossible in many instances to make sensible choices.
For example, when deciding where to locate distribution centers, stores, and warehouses, the American Community Survey’s (ACS’s) accurate local data have proven invaluable to retailers (Kleinhenz 2015). Researchers know significantly more about the impact of pro-work policy reforms in the 1990s due to data from the Bureau of Labor Statistics (BLS)—and are better prepared to advise policy makers on future reforms. Addressing fundamental questions important to families, the ACS aids prospective students in making better college and career choices.
Introduction continued
Our founding fathers recognized the value of data. James Madison observed that information on agricultural, commercial, and manufacturing interests would enable any legislature to represent the interests of its citizens more effectively. Madison pointed out that this kind of information had never been obtained in any country, and that it would enable the United States to grow (Hutchinson and Rachal 1963).
If gentlemen have any doubts with respect to [this information’s] utility, I cannot satisfy them in a better manner, than by referring them to the debates which took place upon the bills, intended, collaterally, to benefit the agricultural, commercial, and manufacturing parts of the community. Did they not wish then to know the relative proportion of each, and the exact number of every division, in order that they might rest their arguments on facts, instead of assertions and conjectures?
The federal government has therefore always played a vital role in developing the data that Americans rely on to make well-informed decisions. As mandated in the Constitution, the U.S. Census Bureau enumerates the U.S. population, periodically adjusting congressional and state legislative districts to reflect the changing population distribution. In this respect and in many others, data are often key to the functioning of our republic. Data are required for the proper exercise of citizenship and for holding public officials accountable. Without accurate information regarding the state of the economy and the effects of public policy, citizens would be unable to make fully informed choices about elected officials and to demand that the government reflects their priorities.
Today the decennial census is just one of the useful statistical products made freely available to the public. In areas ranging from the rural economy to energy markets to the labor market, among many others, federal statistical agencies make valuable contributions to the public good of increased knowledge and understanding. In fact, the Bureau of Labor Statistics alone received 36.8 million web page views monthly in 2013 (BLS 2013).
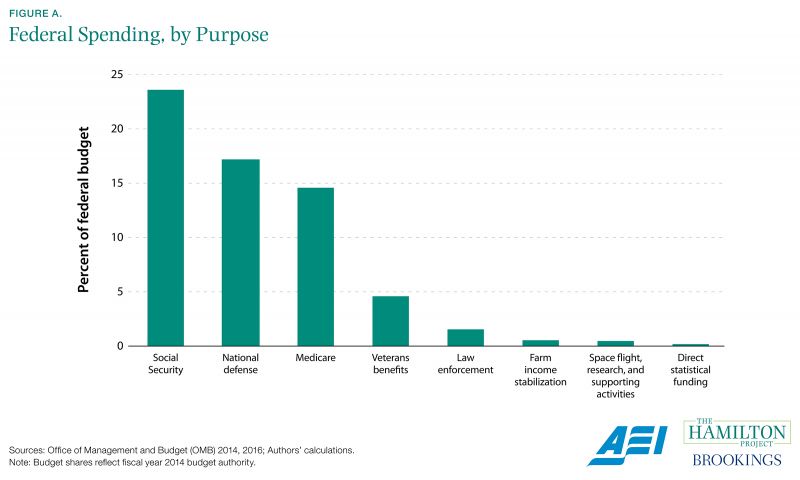
Importantly, the public benefits of statistical reporting come at a relatively small cost. The principal statistical agencies spend only about 0.18 percent of the federal budget (Figure A). This is slightly lower than its 2004 level (OMB 2004; 2016). Given the increasing importance of data to the modern economy, the additional opportunities to collect and analyze new information, and the need for informed policy making, it is striking that this aggregate cost has remained such a small share of the federal budget.
Over the years, the federal statistical agencies have refined a set of practices that ensure the quality and impartiality of its statistical reporting. Because the reports are of such value to the private sector and the public at large, financial markets carefully scrutinize them, reacting quickly to many of the releases. This makes it especially vital that the statistical reports are generated and published in an impartial fashion that puts every user of the data on an equal footing.
To this end, government data are closely scrutinized by nonpolitical, career employees on a “need-to-know” basis, with individual employees often focusing on an isolated part of the process and unaware of the overall statistical result (Malone 2016; OMB 2000, Circular No. A-130). Government agencies also provide source data for outside experts to review and comment on their methodology (Bureau of Economic Analysis [BEA] 2016a). In the case of the BEA, political appointees have very limited access to the data until after journalists receive them—one hour before the estimates are made public—further ensuring the impartiality of the process (BEA 2016b).
Objective, impartial data collection by federal statistical agencies is vital to informing decisions made by businesses, policy makers, and families. These measurements make it possible to have a productive discussion about the advantages and disadvantages of particular policies, and about the state of the economy. This document demonstrates a portion of the breadth and importance of government statistics to public policy and the economy.
Box 1. Where to Find Public Data
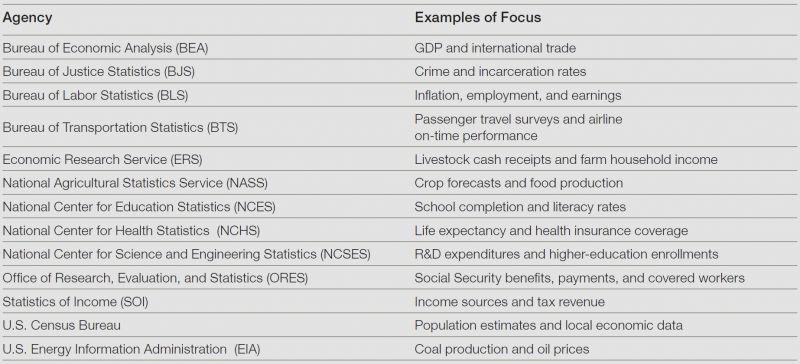
The federal government collects and publishes data through a number of statistical agencies. These agencies have separate missions that are generally organized around distinct subject areas. A partial list, including some of the most notable statistical agencies, is provided in the box table.
Chapter 1: Businesses
Technological advances have made it possible to generate and analyze vast quantities of data, and businesses have seized the opportunities these data present to forecast sales and staffing needs, among other uses. For some purposes, businesses collect their own data or make use of data collected by other firms. The growth of privately generated data is a very important development, both for the private sector and for society as a whole (Einav and Levin 2014). Private businesses have a wealth of information, some of which the government could not collect itself. However, such private data are generally complementary to the comprehensive range of public data offerings produced by the statistical agencies, as described in box 2.
While government-collected data are made available at no cost to users, they nonetheless provide high value to many businesses. For example, businesses monitor trends in GDP and related data very carefully, adjusting their plans to reflect the status of the national and state economies. Surprises in announced GDP growth have large, immediate impacts on bond yields and other prices, as do unexpected changes in national employment estimates (Bartolini, Goldberg, and Sacarny 2008).
A large part of the reason firms value data is that they must contend with uncertainty about future demand for their products. In some cases, this uncertainty is tied to volatility in the national economy: firms monitor GDP as part of their attempts to forecast consumer spending (National Retail Federation [NRF] 2016). In other cases, it is related to local trends. For example, retailers use federal data when deciding where to locate distribution centers, stores, and warehouses, and even how to target merchandise offerings (ESA 2015; Kleinhenz 2015). Combined with firms’ own data and applied to their unique problems, government-collected data make private business more competitive and efficient.
This chapter further highlights some ways that the private sector uses and benefits from government-collected data.
Box 2. Public and Private Data Are Complementary
Businesses and nonprofit organizations often collect valuable data, and sometimes even make this information publicly available. In many cases, private data are complementary with government-collected data. For example, the Billion Prices Project is an initiative to collect price data from online retailers around the world; it generates results that can be usefully compared with the CPI (Cavallo and Rigobon 2016). Government-collected data have unique virtues that help complement private data: comprehensiveness, consistency, and credibility (ESA 2014).
- Comprehensive: While federal statistical agencies aim to cover as much of the U.S. population as possible, individual organizations may have little incentive to cover populations outside of their market segments—particularly small or remote populations. Census Bureau surveys like the American Community Survey (ACS) have annually covered well over 90 percent of the U.S. population (Census Bureau 2015).
- Consistent: Government agencies have a long-term focus and provide consistent definitions of key measures over time, which is necessary to interpret the most recent estimates. By contrast, businesses sometimes tend to focus on short-term market needs and may not find it profitable to provide or retain data as demand fluctuates (ESA 2014). This is important because systematic data archives provide information that meets both current and unanticipated future demands.
- Credible: Government agencies must meet transparency requirements imposed by Congress and provide documentation that is scrutinized by researchers. In the rare instances when errors are discovered, the agencies must publish timely corrections.
Most business is local, and the American Community Survey provides extensive local data.
Many of our data sources are principally designed to yield national estimates of important variables: the unemployment rate, GDP, and so forth. These statistics are familiar, and their accuracy is vital. But much of what is valuable to private business is necessarily local. A business that produces a specific product requires a specific type of worker, and a retailer selling a product or service must understand and address a particular market.
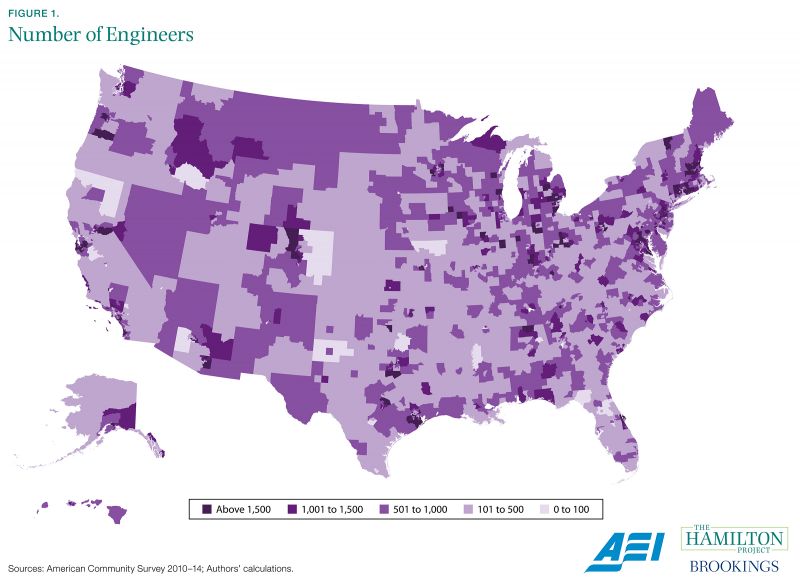
Figure 1 highlights the ability of the American Community Survey to yield local estimates of specific types of workers—in this case, engineers—that a business may want to hire. This estimate is potentially useful for firms deciding among different locations for new branches; a firm that locates in a region without the necessary worker skills is unlikely to prosper. The usefulness of this analysis is not limited to businesses seeking engineers; firms looking for other types of skilled or unskilled labor can make similar calculations using ACS data.
Engineers are plentiful in the northeast corridor from Washington, DC to Boston, as well as Denver and the California Bay Area, to take a few examples. The ACS sample size even allows for estimation of more-detailed subpopulations, like the number of graduates with chemical engineering majors. Businesses and workers can observe how much the typical worker is paid in a given location and occupation, further improving their analyses and informing their decisions.
Box 3. The Value of the American Community Survey
The ACS is a nationwide survey of demographic, social, economic, and housing data collected annually by the Census Bureau. It is indispensable for many purposes because it provides fine-grained local-level data with its annual sample of more than 2 million geographically dispersed housing units (Census Bureau n.d.a). The Census Bureau uses a cost-effective approach that nonetheless strives for maximum response rates, first mailing out a questionnaire, followed by a telephone call for households that do not complete the mailed survey, and finally a personal visit for those who remain unreachable by mail or phone.
The ACS is widely used by local governments. For example, the San Diego Association of Governments formulated its 2050 Regional Transportation Plan with data from the ACS, using information on population, housing, household structure, and school enrollment to forecast neighborhood populations and predict future travel patterns (National Research Council [NRC] 2013, 25). Another example is that of neighborhood economic development projects, which use ACS demographic data to highlight the economic advantages of their area, including the characteristics of local workers, thereby aiding in recruitment of prospective businesses (NRC 2013, 101).
Box 4. Statistical Tools: Census Business Builder
The statistical agencies continue to work to maximize the usefulness of their products to businesses. For example, the Census Bureau maintains an up-to-date tool, the Census Business Builder, which enables any prospective entrepreneur to enter the type of business she is interested in and the demographic groups that constitute her customer base. An interactive map shows details about any potential customer base, as well as basic statistics on potential competitors in the desired sector. Recognizing that this type of tool is particularly valuable for small business owners without substantial marketing and product research resources, the Census Business Builder provides a specifically targeted Small Business Edition that groups businesses into intuitive categories and guides an entrepreneur through relevant uses of the tool (Census Bureau n.d.b).
A would-be entrepreneur in, say, Denver, could utilize this tool to create a business plan for a new barbershop. First, the entrepreneur might explore the percentage of men in certain age ranges in different neighborhoods and then generate an automated report on a wide range of factors for these neighborhoods, including median household income, median rent, and average travel time to work. In fact, the potential barbershop owner could even discover that the average person in Denver spends $335 annually on personal care products and services, which is $23 more than in nearby Colorado Springs. This report would also show that there are currently seven Denver barbershops with an average of four employees each (Census Bureau n.d.b).
The American Community Survey allows retailers to address the specific needs of local markets.
Private businesses make extensive use of the American Community Survey in determining when and where to open or expand stores, distribution centers, and warehouses (Kleinhenz 2015). Target and Kroger, in particular, have reported that they use ACS data to tailor their product mixes and advertising appropriately across locations (ESA 2015). Other businesses analyze and interpret ACS data for analyses they sell to firms: Acxiom, an Arkansas-based marketing firm with more than $1 billion in revenue, creates market indices and other products that depend heavily on data from the ACS (NRC 2013, 110–111).
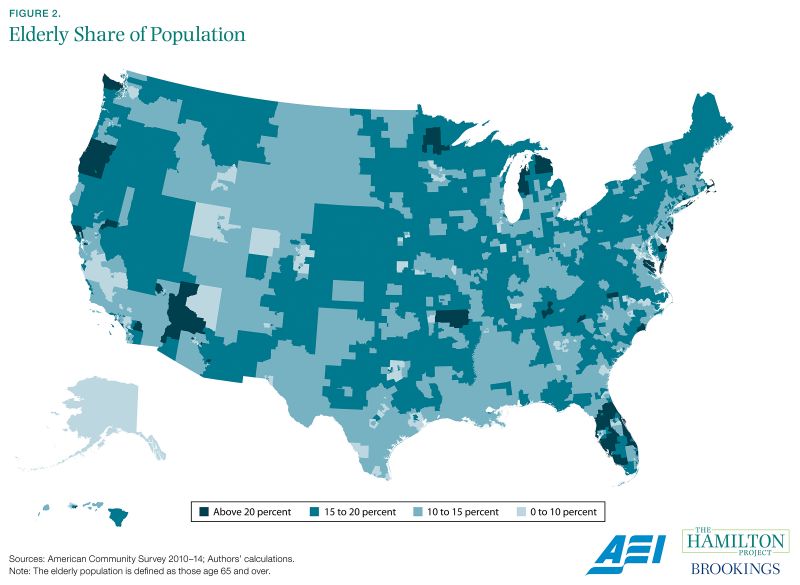
The ACS is useful for all these purposes because it provides detailed coverage of local areas. In figure 2 the capacity of the ACS to yield such information is demonstrated with a particular example: the share of the elderly in each local population. As with many other groups, the elderly are not evenly distributed across the United States, but cluster in certain areas. Florida, Arizona, and parts of the eastern seaboard all have relatively high elderly representation in their populations.
Beneficiaries of this information include firms that offer services to the elderly, as well as local and state policy makers who must respond to the age-related needs of their constituents. The ACS provides even more detailed information than shown here: a firm catering to Hispanic women aged 65 to 74, for example, could learn where its customers are located and adjust its approach accordingly.
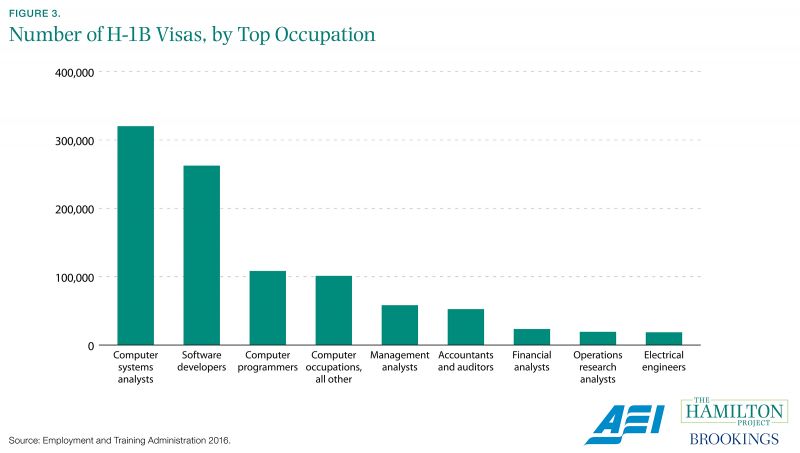
H-1B visas are disproportionately allocated to certain information technology fields.
The H-1B program allows employers to temporarily sponsor foreign workers in the United States on a nonimmigrant basis when those foreign workers have skills that are difficult or impossible to obtain in the domestic labor market. Current law limits the number of foreign workers who qualify, making the visas a scarce, valuable commodity.
Firms, researchers, and policy makers alike are interested in the jobs associated with H1-B visas. In order to inform discussions about the program, the Department of Labor’s Office of Foreign Labor Certification publishes calculations from its administrative data regarding visa recipients and the occupations in which they work. As figure 3 shows, H-1B visas are particularly common in the computer and information technology fields. Administrative data also show that in fiscal year 2016, California accounted for 19 percent of all H-1B visas and Deloitte Consulting was the top employer of H-1B workers, employing 10 percent of such workers (Employment and Training Administration 2016).
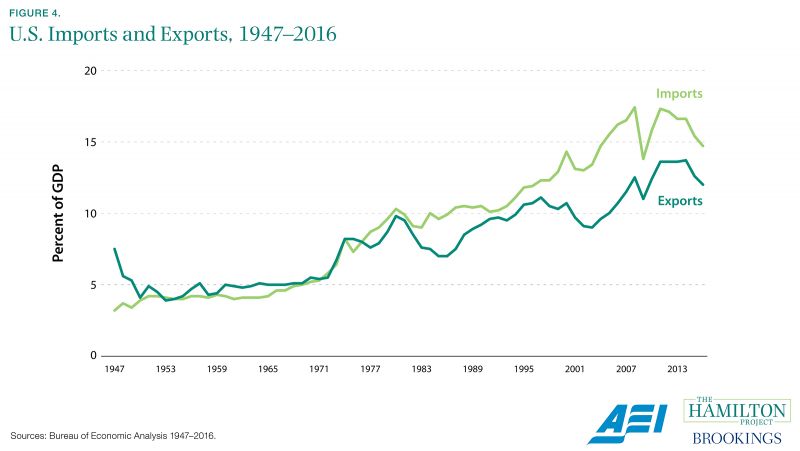
The widening of the U.S. trade deficit has been tracked by the Bureau of Economic Analysis.
Because of its large size and distance from other developed economies, the United States is a relatively closed economy, with international trade amounting to a fairly small portion of its economic output. However, the role of trade has increased over recent decades, with imports persistently exceeding exports. Figure 4 depicts these developments using data from the Bureau of Economic Analysis.
To assemble its trade data, the BEA draws on export and import data collected by the Census Bureau and U.S. Customs and Border Protection, respectively. BEA classifies and adjusts these data to align with the definitions used for calculation of GDP and other national measures (BEA 2014). Notably, GDP calculations likely understate output growth to the extent that they fail to capture all improvement in hard-to-measure information technology. This mismeasurement is the subject of ongoing research (Byrne, Fernald, and Reinsdorf 2016).
Information on international trade, and particularly changes in trade, is important to understanding the health of the U.S. economy and its likely future direction. In addition, detailed export and import data may be useful to firms that seek to understand the international business environment in specific sectors of the economy.
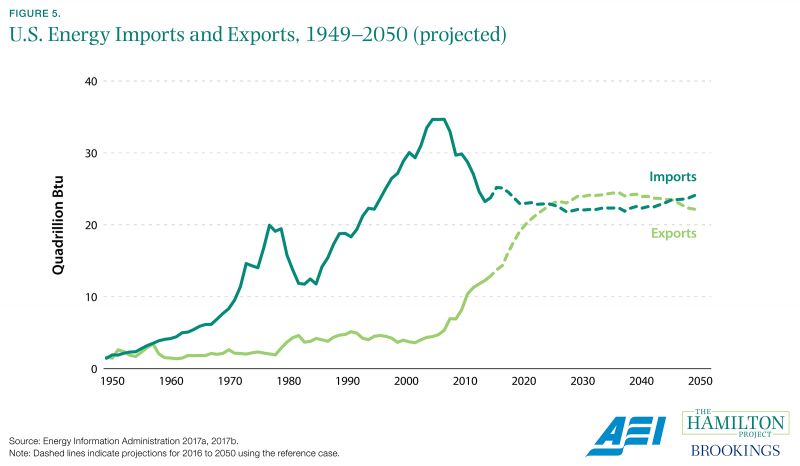
The U.S. Energy Information Administration has tracked the recent rise of U.S. energy production.
Energy economics took on special significance in the second half of the 20th century as energy demand rose dramatically, and as energy supply at times experienced significant volatility. Though U.S. energy exports once equaled imports, due to reliance on large domestic deposits of coal and oil, supply soon proved unable to keep up with rising demand. Since the 1960s, the U.S. economy has relied on large net imports of energy, and particularly imports of oil.
Over the past decade, domestic production of energy shot up as new technologies facilitated the extraction of previously unobtainable deposits. Estimates from the Energy Information Administration (EIA) provide crucial context for this development. Figure 5 shows exports rising sharply beginning in the 2000s, but still lagging energy imports. However, according to EIA projections based on these data, exports are forecast to exceed imports by 2026, marking a startling shift from the historical U.S. position as a large net importer of energy. Of course, projections are always subject to considerable uncertainty, and may miss the mark if unexpected economic or technological changes occur.
Businesses that participate in the energy market benefit from precise information about the scale and timing of market fluctuations. These firms are intensely interested in the likely path of U.S. production, which will have important effects on prices and availability of energy. For example, Charles Schwab cites EIA data on shale output to discuss the market outlook for energy investments (Sorensen 2017); EIA market forecasts also underpin discussions of future natural gas production and U.S. sales of combined cycle gas turbines for power plants (Ray 2015).
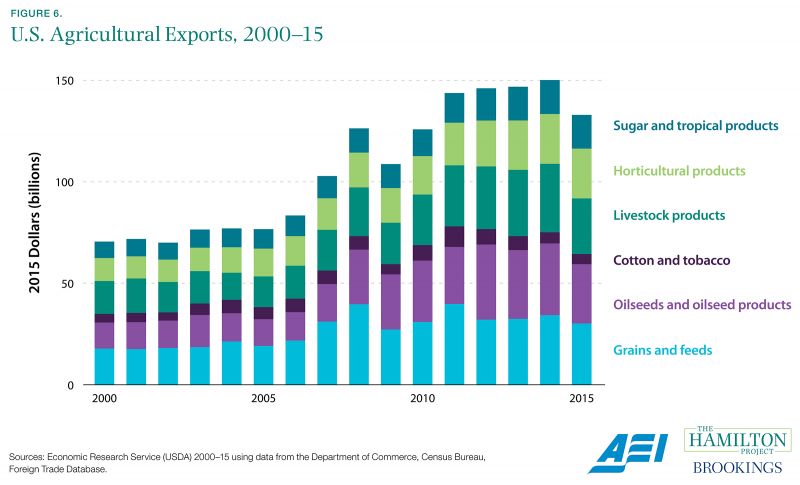
Agricultural exports have grown substantially, increasing the U.S. economic interest in access to foreign markets.
Though the agricultural sector now employs a small fraction of U.S. workers, agriculture is highly efficient and production continues to rise. Using data from the Census Bureau, the U.S. Department of Agriculture’s (USDA’s) Economic Research Service tracks the evolution of agricultural output over time by type of production. In recent decades the U.S. agricultural economy has diversified, with revenues from grain, oilseed, and livestock constituting roughly equivalent shares.
Figure 6 shows that agricultural exports ranging from grains to livestock have grown since 2000. This growth is fueled by steadily increasing demand in foreign economies (projected to exceed domestic growth in coming decades) as well as falling energy costs for agricultural producers in recent years (USDA 2016). USDA projects that growth in agricultural exports will continue, rising to $176 billion in 2025. Though accurate projections are hard to make even with great data, they are nearly impossible to make with poor or nonexistent data.
Understanding how the agricultural economy has evolved and will likely change in the future is important for many firms that either produce or rely on these products. Moreover, policy makers negotiating international trade agreements will benefit from a clear understanding of the economic impact of agricultural trade.
Chapter 2: Policy Makers
Private actors rely on accurate, comprehensive public data collection to make good decisions. Collectively, these well-informed decisions yield a stronger, more prosperous economy. Government data collection for crafting better public policy is also extremely important. Good data mean that policy makers will be much less likely to waste taxpayer funds, will be able to exploit productive opportunities, and will grow the economy.
Perhaps one of the most significant examples of how policy makers use data is provided by the Federal Reserve (Fed). Fed decisions on interest rates influence everything from businesses’ decisions on capital investment to consumers’ decisions on home and auto purchases. The Fed depends on official statistics to assess the health of the labor market and to understand how prices and other macroeconomic indicators are changing. Without timely and reliable data, the Fed would be driving blind, sometimes unnecessarily putting the brake on economic growth and sometimes stepping on the accelerator for too long, generating damaging price inflation.
Microeconomic policy needs good data just as much as the Fed does. Policy analysis has advanced considerably in the past several decades, often spurred by more and better data. And although much of the data are of very high quality, there are certainly some known problems: for example, respondents are more likely to report being unemployed immediately after entering the Current Population Survey (CPS) sample than they are at the end of their time in the sample (Krueger, Max, and Niu 2016). Efforts to address such problems are ongoing, and both the research and official statistics communities take them quite seriously.
Much of what we know about public policy rests on high-quality data. In a number of cases, relevant government-collected data have facilitated the evaluation and reassessment of important government policies that touch millions of lives and cost billions of dollars. For example, work by David Autor and Mark Duggan (2006) using data from the Social Security Office of the Actuary has informed a national discussion about rising disability insurance payments and various reform efforts that could save taxpayer funds and help the Social Security Disability Insurance (SSDI) program better serve the public. In another example, survey data from the BLS have made it possible to evaluate the impact of pro-work tax and transfer policy reforms (notably, expansion of the Earned Income Tax Credit, among other factors) in the 1990s, convincing many researchers and policy makers that such reforms had merit. The causes and consequences of a host of shifts in major social trends—such as the decline in marriage rates and increases in obesity and middle-age mortality rates—have also been studied.
Importantly, Congress must make decisions on a host of questions that can be answered with government-collected data. Through the Congressional Budget Office and Congressional Research Service, these data make large contributions to high-quality policy making.
To be sure, we need more and better data. We do not, for example, have systematic data on the experiences of Americans with criminal records. As a result, we do not even have an accurate count of Americans with records, let alone a clear understanding of the impact of prison time on future employment, wages, and life outcomes. Without such evidence, we cannot make wise decisions about criminal justice and sentencing.
This chapter highlights just a few of the ways that government-collected data have supported efforts to understand and improve the effects of public policy.
The Bureau of Labor Statistics provides multiple, complementary estimates of labor market health.
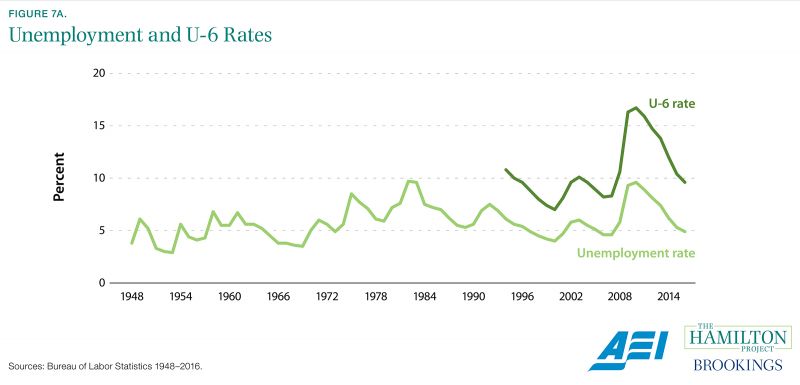
There are variety of measures of labor market health collected by the Bureau of Labor Statistics—including the payroll jobs count, the unemployment rate, the labor force participation rate, and more. The unemployment rate, defined as the number of people without jobs who are currently seeking work divided by the number of people in the labor force, is the labor force’s most cited summary statistic. The unemployment rate rises during recessions and falls during recoveries, is generally higher for disadvantaged groups, and tends to be lower in thriving local economies.
The BLS, in conjunction with the Census Bureau, has created a consistent measure of unemployment that dates to 1948. Today, this measure is generated by a monthly nationally representative survey of about 60,000 housing units called the Current Population Survey, and is published only weeks after data are measured (BLS 2014).
The human cost of unemployment, and especially long-term unemployment, means that changes in the unemployment rate are carefully watched by economists and policy makers. Unfortunately, the unemployment rate is frequently misunderstood, leading to confusion about what precisely it is and isn’t measuring. This statistic only includes those who are in the labor force, and therefore does not account for those who have become discouraged after a lengthy job search and stopped actively searching, for instance.
The BLS publishes a number of alternative measures that add information to provide a more comprehensive picture of the labor market (BLS 2017). One of these measures, called U-6, includes discouraged workers and others who are outside the labor force but want work, as well as those who have part-time work but would prefer full-time work. As shown in figure 7a, this measure is substantially higher than the traditional unemployment rate.
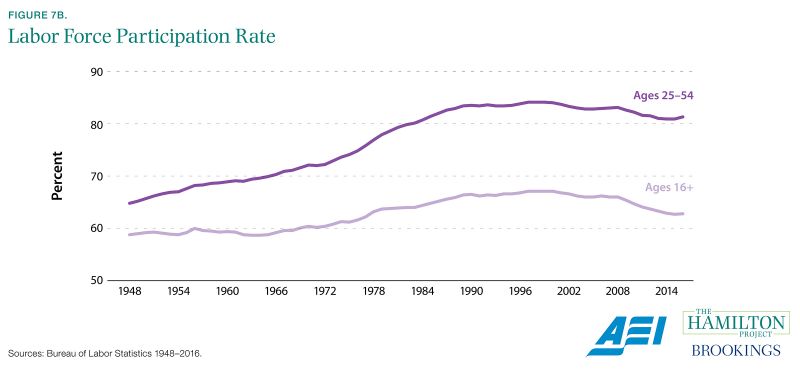
The CPS also generates the labor force participation rate, an estimate of the fraction of the adult population that is either working or seeking work. The decline in labor force participation, especially among prime-age men, is one of the most discussed problems in the labor market today. The share of men between the ages of 25 and 54 that did not participate in the labor force has increased from less than 9 percent in January 2007 to just over 11 percent in January 2017 (BLS 2017). This information draws attention to the importance of policies aimed at getting more of these men off the sidelines of the economy.
State governments, researchers, and businesses rely heavily on the CPS, which provides timely information about local labor markets in addition to the national unemployment rate.
For example, the stock market reacts to the monthly release of new employment figures on the first Friday of each month. The samples in other surveys, e.g., Gallup polls, are benchmarked to CPS data (ESA 2014). The CPS has been instrumental in documenting a number of trends, including the economic benefits of education (Council of Economic Advisers 2014), the well-being of military veterans (Olsen and O’Leary 2011), and the high rate of occupational licensure (BLS 2016a). The CPS also informs the BLS’s Occupational Outlook Handbook, which provides valuable career information for prospective college students and others in the workforce (ESA 2014).
Box 5. Bureau of Labor Statistics Survey Procedures
The Bureau of Labor Statistics (BLS) administers the two most prominent employment surveys in the United States, the Current Population Survey (which yields the unemployment rate) and the Current Employment Statistics (which yields the headline monthly employment change). Both are conducted according to rigorous, carefully crafted procedures that conform with modern statistical methods. Together, these two independently conducted surveys provide a nuanced, comprehensive picture of the labor market. Perhaps most importantly, this snapshot is obtained almost in real time, which is key to its usefulness to policy makers and the public.
The Current Population Survey (CPS) is implemented by the U.S. Census Bureau and follows a rotating monthly group of 60,000 housing units, amounting roughly to 110,000 individuals (BLS 2016b). Carefully trained Census Bureau employees interview survey respondents over the phone or in person, following a universal script that eliminates imprecision associated with different interviewer styles and minimizes the room for confusion among respondents about what they are being asked. For example, interviewers do not ask whether a respondent is “unemployed,” but instead ask concrete questions about current employment, availability for work, and the status of the respondent’s job search.
The Current Employment Statistics (CES) produces an estimate that is often called payroll employment, derived from a survey of work establishments and consequently measuring the number of workers on the payroll (BLS 2016c). This is a much larger survey, covering more than 600,000 establishments, but with more-limited range than the CPS: the payroll survey focuses on employment, hours, and earnings, and cannot distinguish individual workers (e.g., a worker with two jobs is counted twice). Through its Regional Data Collection Centers, the BLS enrolls new establishments and collects their responses using a variety of methods that include telephone, fax, and Internet (BLS 2016d).
For both surveys, and for federally collected data more generally, data confidentiality and objective, non-political analysis are highly valued. Harsh penalties are assessed for any misuse of the information, with violations of confidentiality punished by large fines and multiyear prison terms. Confidentially also entails that the federal government may not use any of the statistical data it collects to help bring criminal charges against a respondent (BLS 2016e). In the case of the BLS, all but one employee—the commissioner—are nonpolitical civil servants, helping to protect the BLS reputation for objective, accurate analysis.
Bureau of Labor Statistics data allowed for the evaluation of 1990s pro-work policy reforms.
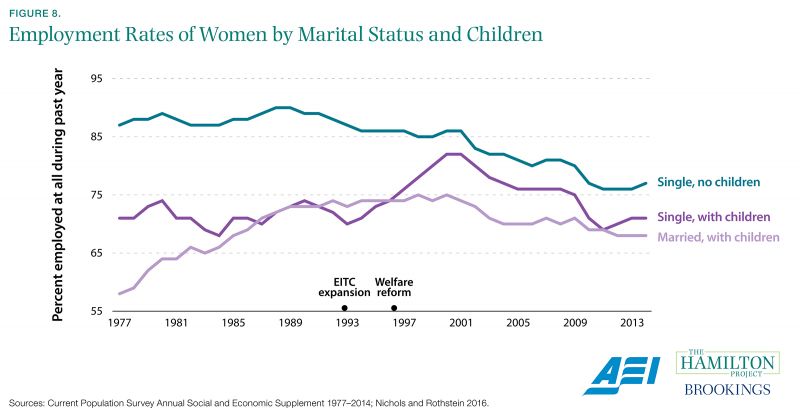
One of the most important policy changes over the past quarter century was the shift to a work-based social safety net. These reforms particularly affected unmarried, low-skilled women with children who were both pushed into the labor market through the time limitations put on cash welfare benefits and pulled into it through the expansion of the Earned Income Tax Credit, which supplemented labor market earnings. To estimate the impact of these policy changes, analysts have examined employment trends among women aged 19 to 44, comparing unmarried mothers to single childless women and married mothers. As shown in figure 8, in the time period immediately following the pro-work policy reforms, unmarried mothers’ employment rates climbed by approximately 10 percentage points, while employment rates of the comparison groups were stagnant or falling. Since the early 2000s employment rates have been falling among all groups—a trend that analysts are still trying to understand.
The data for figure 8 come from the Current Population Survey, which helps answer a variety of important questions. Some of these questions are addressed in annual supplements, like the “Current Population Survey Annual Social and Economic Supplement,” conducted every March. The “March Supplement” contains information concerning family characteristics, health insurance coverage, income, work experience, receipt of government benefits, geographic mobility, and poverty.
This is particularly important to the study of the impacts of government programs that aim to address poverty. This survey has important limitations: research suggests that the “March Supplement” significantly understates the receipt of government transfers from programs like the Supplemental Nutrition Assistance Program (SNAP, or food stamps) and cash welfare, and therefore understates the benefits of these programs (Meyer, Wok, and Sullivan 2009). Administrative data, obtained directly from agencies that oversee the transfers, can help correct survey estimates. However, it would be a mistake to rely exclusively on administrative data: because of the breadth of the survey, the CPS affords insights that cannot be gleaned from administrative data alone. Using survey and administrative data in conjunction often yields better results than using either type of data alone.
Fewer children are growing up in two-parent families.
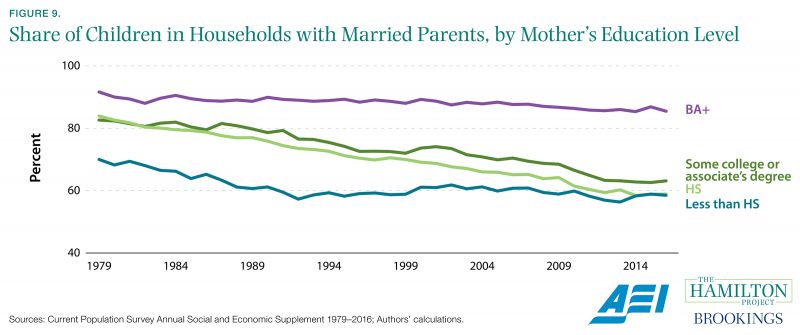
Family structure shapes children’s outcomes. Children who grow up in a family with married parents do better on a variety of dimensions, from education and behavior during childhood to employment outcomes (American Enterprise Institute/Brookings 2015). Statistically, growing up with a single parent is associated with higher rates of poverty during childhood and lower rates of upward mobility when children reach adulthood. High marriage rates appear to have positive spillovers, as well. A recent study by Raj Chetty and Nathaniel Hendren found that the share of adults who are married in a geographic area positively predicts upward economic mobility of children who live in the area—regardless of the child’s own family status (Chetty and Hendren 2016).
The share of children living in married families has declined steadily over the past half century, with around 65 percent of children overall now living with married parents. However, the fraction of children living in married families—and the rate of decline in marriage—varies dramatically across socioeconomic status. Drawing on data from the Current Population Survey, figure 9 shows that children whose mothers hold four-year degrees are nearly as likely to live with married parents today as they were in 1979. Strikingly, their counterparts with mothers who have only a high school diploma or some college have seen the share of children living with married parents decline sharply over the past 40 years.
Box 6. Data Privacy and Confidentiality
The culture of the statistical agencies is organized around protecting the privacy and security of government data, mindful that the work they do can only continue with the trust of the public. The first and foremost priority is the protection of the identities of those who provide the agencies with information, whether through survey or otherwise. Federal law prescribes strict criminal penalties, including incarceration, for any violations of confidentiality (Economics and Statistics Administration 2014). Moreover, data provided to the statistical agencies cannot be used for any enforcement purpose (Economics and Statistics Administration 2014).
The statistical agencies’ reputation for professionalism and care in handling data provides survey respondents—individuals, families, and businesses—with the confidence that the confidentiality of their data will be respected and their information used for the public benefit. Survey respondents would understandably have reservations about divulging data without assurances that it will be carefully protected.
New collection of data on occupational licensing lays the groundwork for reform.
That the statistical agencies have been in place for decades, collecting much of the same information over that span of time, is a great advantage. Users of the data can confidently make historical comparisons and, just as importantly, can rely on the expectation that necessary data will continue to be collected and generated.
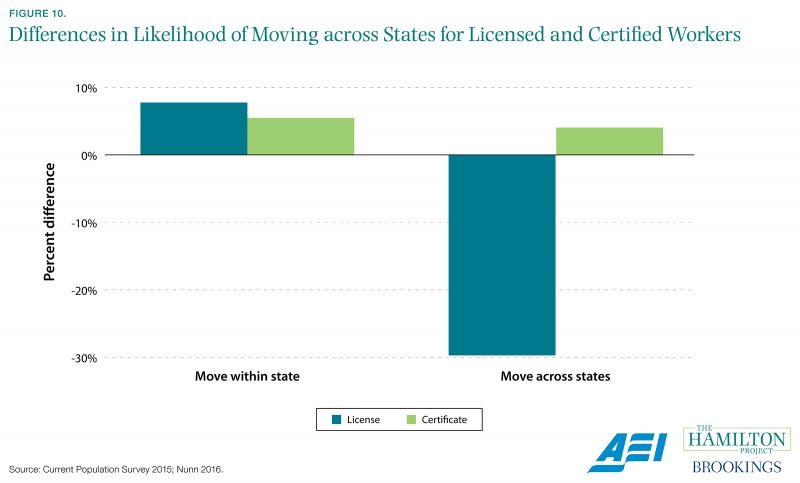
However, it is also important for data to adapt to the changing circumstances of an evolving economy, which sometimes presents new opportunities. In 2015 the Bureau of Labor Statistics introduced three new questions regarding an institution that had gradually become much more relevant to the labor market: occupational licensing. The new data revealed that roughly one quarter of employed workers currently hold a license issued by a local, state, or federal government. Typically issued at the state level, licenses are legally required in order to practice in a given profession.
Figure 10 shows that workers who are licensed are different from otherwise comparable certified workers—i.e., workers with a job credential that is not legally required to practice—in their propensity to move. Though licensed workers move within state at about the same rate as comparable certified workers, licensed workers are much less likely to move across states than are certified workers. This is what one would expect in a state-based system with very limited licensure reciprocity: once a worker has obtained a license, the cost of re-licensure in a new state is often prohibitive.
The BLS data will permit new research that helps state and federal policy makers rationalize their excessively burdensome occupational licensing regulations. Without information about how many are licensed, what occupations they work in, and how often they move, among other questions, it would be more difficult to subject this labor market institution to careful economic scrutiny.
In most places, the manufacturing labor market has not fully recovered from the Great Recession.
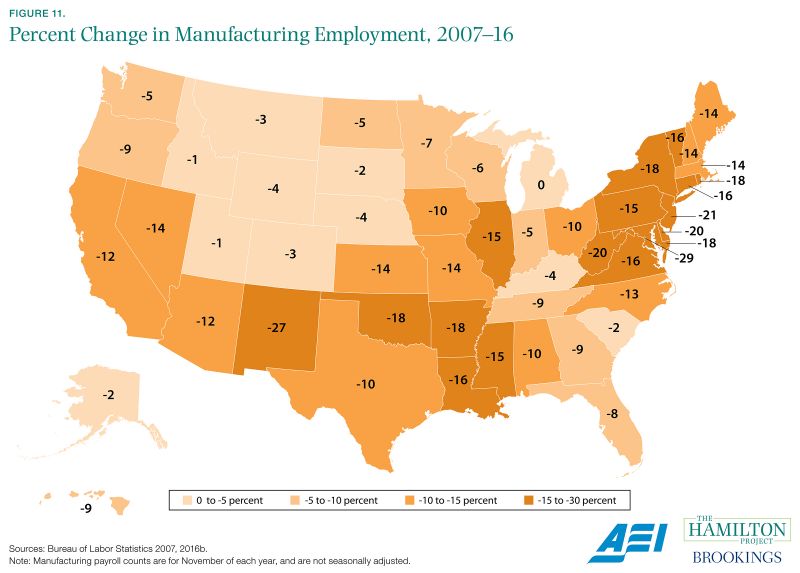
While manufacturing employment has fallen steadily over time as a share of employment—from 28 percent of nonfarm workers in 1960 to 8 percent today—it nonetheless is an important gauge of local labor market health and the subject of policy interest (BLS 2016b). Manufacturing tends to be a cyclical industry that prospers during strong economic times and languishes in bad, and the Great Recession that started in 2007 was especially destructive to the sector. However, even with the prolonged economic recovery of the 2010s, manufacturing employment levels continue to fall short of their prerecession levels.
Using a large survey of business establishments conducted by the Bureau of Labor Statistics, businesses and researchers can track these trends. Every state in the United States experienced a drop in manufacturing employment during the Great Recession, and only Michigan has regained its November 2007 manufacturing employment level. In other states, declines are often as large as 10 to 15 percent. However, these declines occurred while real manufacturing output increased slightly over the same time period (BLS 2007–2016). As technological progress renders individual manufacturing workers more productive, manufacturing output can increase even while employment declines.
The BLS survey that produces these data—the Current Employment Statistics—uses a very large sample, benchmarked annually with even more comprehensive unemployment insurance records (BLS 2016b). Consequently, it is more carefully monitored on a month-to-month basis than are alternative measures. Financial markets in particular respond immediately and sharply to unexpected changes in payroll employment, because these provide valuable information about the current health of the economy and the future course of Fed policy (Huang 2015).
Most rural areas are losing population.
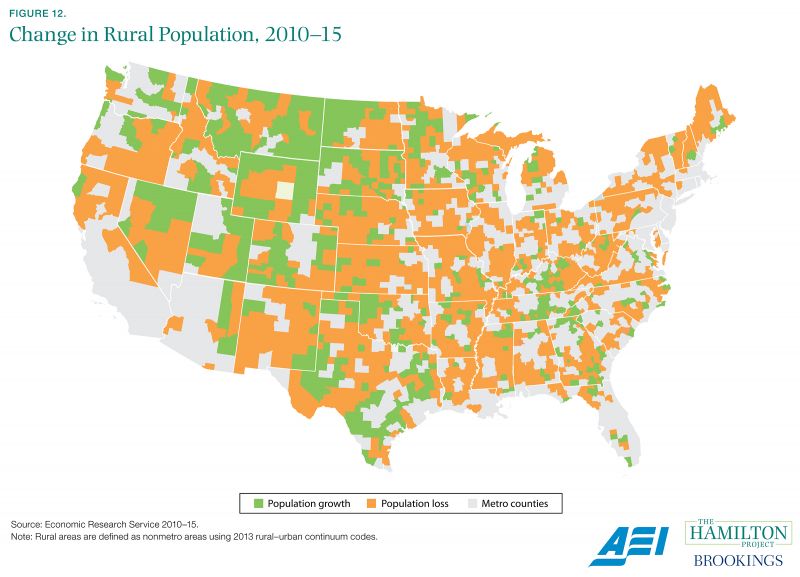
A long-run story of America, and of industrial civilization, is one of continuous migration away from the agricultural economy and into the manufacturing and service sectors. As agricultural technology improved, fewer workers were needed to produce the same amount of output. These workers flooded into cities and suburbs that were better integrated into the emerging manufacturing and service sectors.
In recent years, this migration pattern has largely persisted, with rural populations continuing to decline in most of the country. The trend is particularly pronounced in the eastern half of the United States, as shown by calculations from the USDA’s Economic Research Service.
Government-collected data show migration trends that inform state and local policy.
Data on Social Security Disability Insurance have sparked a conversation about reform.
The federal government’s social insurance programs have changed considerably over time. Accurate information about their coverage and performance is essential to having a productive discussion about the possibilities for reform.
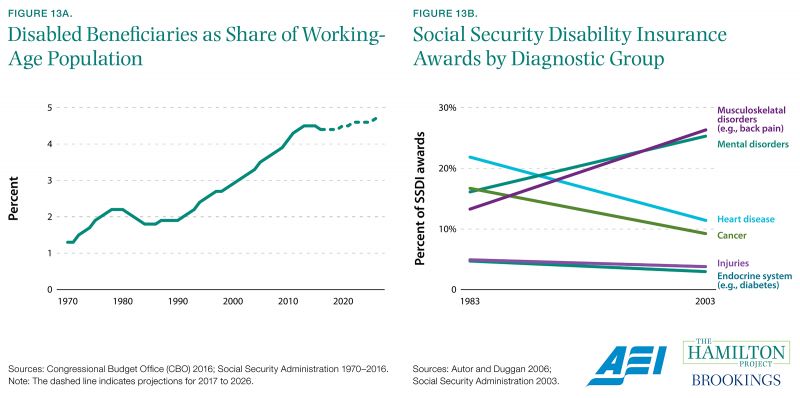
Social Security Disability Insurance is a good example. Benefits provided by this program are intended to help eligible former workers who have become disabled, and are unable to work, due to a medical condition lasting at least one year. Though SSDI recipients are not the only disabled individuals receiving government assistance—such benefits are also provided through veterans’ disability compensation and Supplemental Security Income, for example—about two thirds of those who are disabled and receive benefits are on SSDI, and it has received the most research and policy attention.
There have been large increases in the number of beneficiaries relative to the number of workers over the past 40 years. In 1970, for every 100 people in the working-age population, 1.3 received SSDI benefits. By 2015 that number had increased to 4.5. While some of the increase is an artifact of the aging of the baby boom generation, another portion has been driven by screening rules that have been loosened over time.
The medical conditions that lead to SSDI receipt changed markedly during the large increase in disability rolls starting in the mid-1980s, as shown in figure 13a. Data from the Social Security Office of the Actuary allowed Autor and Duggan (2006) to explore the role of loosened screening rules for certain disabilities, namely mental and musculoskeletal disorders, in determining the number of SSDI recipients and total cost of the program. The authors find that liberalized screening rules have contributed to increasing use of the program.
Data from the Census Bureau permit study of the labor market impacts of the energy boom.
The U.S. economy is extremely large and diversified across many different types of activities. In recent years the role of the United States as an energy producer has increased in striking fashion. The advent of cost-effective hydraulic fracturing, among other technologies, has generated booms in places like North Dakota that have recoverable oil and natural gas.
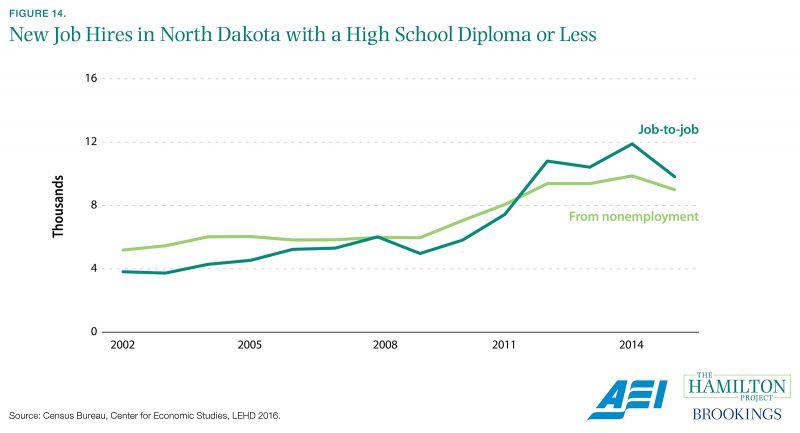
These booms have altered local labor markets in important ways. Government data like the Longitudinal Employer–Household Dynamics shed light on trends in employment, hiring, job creation and loss, and earnings. Through this Census Bureau program, those interested in local economies can see these trends with unprecedented detail going back several decades (Census Bureau 2017). In addition, the Census Bureau provides these data through free online tools that create detailed maps and figures, showing details such as commuting flow and the impact of disaster events like tropical storms on local economies (Census Bureau 2017).
Restricting focus to workers with a high school diploma or less, much of the uptick in hiring during the energy boom has come in the form of workers who were already employed, rather than those who were persistently nonemployed prior to hiring. This type of detail is useful for understanding the labor market impacts of technological shocks.
Chapter 3: Families
merican families directly benefit from a range of government-collected data that are useful when weighing decisions big and small. For example, when faced with the decision of which nursing home to choose for an elderly parent, the Nursing Home Compare tool at Medicare.gov provides a searchable database with ratings on quality, staffing, and other metrics. Many expectant parents study baby name data released by the Social Security Administration. Even the weather forecasts that help families plan their weekend outings are based on government-collected data.
The comprehensiveness of these data is evident when one considers the decisions made by prospective college students. College-age students and their parents facing consequential life choices about where to attend college and what to study are in need of objective data related to a number of those choices. The Department of Education’s College Navigator is a database—searchable by location and program type—that provides comprehensive, comparable data across schools. Students may also consult with data that can help them decide what skills to develop with an eye toward their likely future earnings in the labor market.
One important government data tool for this is the BLS Employment Projections, which forecasts what jobs are likely to grow or shrink over the coming decade. Another is analysis of how lifetime earnings vary across levels of education and major field, drawn from the Census Bureau’s ACS. Of course, individual families would probably not be inclined to download the survey data and formulate their own estimates, but other organizations have conducted these analyses and have packaged the information in ways that are accessible and convenient. As a result, families may not even realize that the underlying data come from the government.
In this chapter, we highlight examples of government-collected data that are directly relevant to families.
Box 7. Data as a Public Good
Free, publicly available data of the kind described in this paper are a textbook example of a public good. First, potential users often cannot be excluded from the benefits of data. Indeed, attempts to restrict data availability to paying users would compromise the quality of the information, making it harder to find errors and ensure data integrity. The open source nature of much government-collected data, with its continuous review by outside experts and users alike, is an important contributor to its quality (BEA 2016; BLS 2017b).
Attempts to restrict its availability would also weaken the impact of good data. In many instances, use of the data yields spillover benefits for large groups of non-users. This is most evident when it comes to program evaluation: analysis of the causal impact of programs and policies. When careful program evaluation eliminates ineffective programs and improves effective ones, it confers benefits on all those who are potentially affected by a policy, including taxpayers. For example, the National Job Training Partnership Act (JTPA) study from the early 1990s found weak results for youth served by the JTPA (Bloom et al. 1993), leading to a sharp reduction in outlays on the youth component of the program (Barnow and Smith 2015).
Choice of college major plays an important role in determining salary.
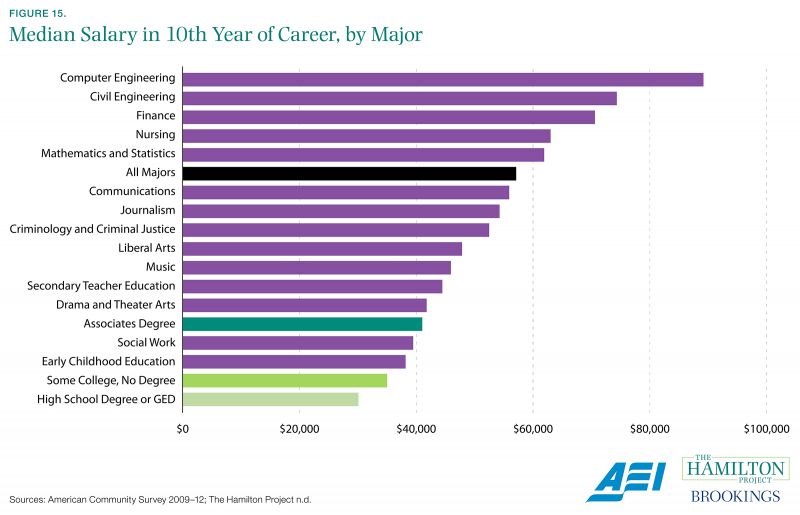
It is well known that attainment of a four-year college degree confers sizable earnings benefits for the average worker. After 10 years in the labor market, the typical four-year college graduate can expect to earn $27,000 more per year than the typical high school graduate. Given the high and increasing expense of a college education, this is no small part of the motivation for most students’ enrollment.
What is less well-understood is the variation in earnings that can be expected across different groups of graduates, for example across different college majors. As shown in figure 15, those with a degree in computer engineering earn a median salary of $89,200 at 10 years after graduation; those with a degree in drama and theater arts earn less than half this amount with a median salary of $41,800. To be sure, majors may also differ in terms of the nonpecuniary benefits they confer and in the types of students who enter them. Nonetheless, clear information about likely earnings trajectories is highly useful to students—and their parents—as they make large investments in their skills.
The Census Bureau’s American Community Survey makes analysis like this possible, because it is large and covers a range of economic and demographic topics. A large sample size means that there are enough individuals to draw statistically valid conclusions not only about the most popular majors, but also about smaller ones. Furthermore, having college major and earnings in the same dataset as geographic location and demographic characteristics allows users to analyze differences across important dimensions.
Earnings differ considerably within college major and by gender.
In an economy that is continuously remade by technological progress, workers are increasingly forced to adapt to changes in the demand for skills and occupations. As businesses shift their needs toward some occupations and away from others, it is important that individual workers—young and old alike—have the benefit of good information about the earnings trajectories associated with different careers.
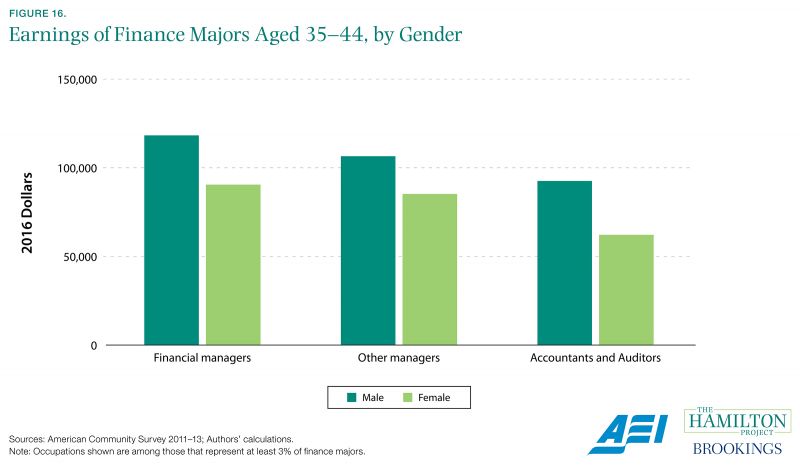
Within a major field of study, graduates go on to pursue a range of occupations that vary widely in terms of annual earnings. For example, among 35- to 44-year-old college graduates who majored in finance, about 25 percent are employed in the top three occupations: 10 percent are accountants and auditors, 9 percent are financial managers, and 6 percent are other managers. Average earnings vary widely across these occupations, with financial managers outearning accountants and auditors by 28 percent for males and 46 percent for females.
Data on earnings by major field and occupation are useful factors for students to consider when making consequential decisions about their educational investment and career aspirations. Policy groups like The Hamilton Project and others take the raw data collected by the Census Bureau to produce user-friendly data tools that help provide this needed information.
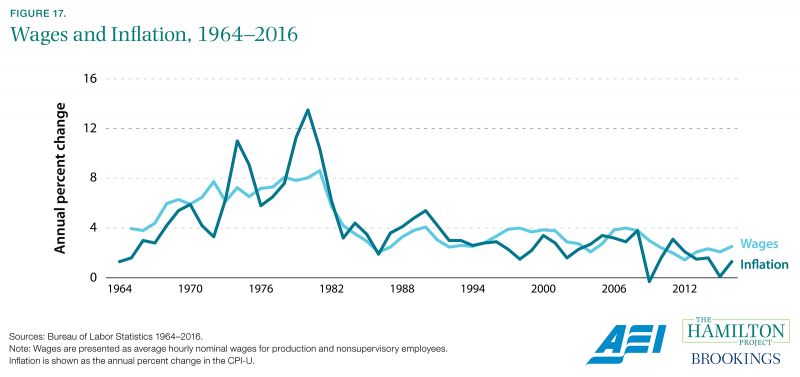
The Consumer Price Index is vital to understanding wage growth.
The modern U.S. economy is characterized by a tremendous number of constantly changing prices. Making sense of these is no easy task, yet doing so is an absolute necessity for tracking economic progress over time, adjusting wage contracts for changes in cost of living, properly interpreting financial market prices, and conducting monetary policy, just to take a few examples.
Dating all the way back to 1913, the BLS has calculated the standard measure of changes in prices, known as the Consumer Price Index (CPI). Though the BLS has improved its methodology over the years, in part due to input from experts on the 1996 Boskin Commission, the fundamental essence of the measurement is the same: observe the basket of goods and services purchased by consumers, then track changes in those prices over time, with periodic updates made to the composition of the basket (Gordon 2006). Of course, different consumers make different purchasing decisions, so the index will necessarily reflect a typical consumer experience; people who buy other baskets may experience lower or higher inflation rates.
The modern procedure for calculating the CPI is the product of decades of research and experience. It is not sufficient simply to observe posted prices for goods and services; one important complication is that the quality of many products is always improving. For example, a $1,000 computer in 2000 was much less powerful and useful than a $1,000 computer in 2017, indicating that the effective price of computing services has fallen even if consumers are paying the same dollar amount for a computer. The BLS has implemented procedures for estimating this sort of change in quality. Prices of characteristics or components of the good (e.g., hard drives inside personal computers) are used to calculate the change in price of the good (e.g., the computer) that would be observed if quality were held constant (BLS 2010). Other technical challenges to inflation measurement rise because consumers differentially substitute across goods when relative prices change, when new products are introduced and must be incorporated into the market basket, and when consumers change where they shop—e.g., to warehouse or online stores. The BLS is continuously studying these issues to get the most accurate, unbiased measurement of inflation possible.
Inflation calculations are important in part because payment increases under Social Security and other compensation programs are indexed to them. If inflation is over-stated, the total cost of the benefits will rise, causing a ripple effect through the budget. On the other hand, if it is under-stated, seniors who depend on the benefits will have a harder time making ends meet. In addition, families often receive cost-of-living increases in their pay that are calculated from government inflation statistics. Some wage contracts are written in a way that explicitly accounts for changes in the CPI, providing for automatic cost-of-living raises (Miller 2015).
Moving Forward: How to Strengthen Public Data
An analysis of today’s official statistics is incomplete without considering tomorrow’s needs. This is especially true given the rapid social and economic changes facing the country. Today’s statistical products are continuously refreshed to help us understand our changing economy. By implementing the following three suggestions, the federal government would further strengthen our nation’s data.
Continue to Address Limits in Today’s Data
First, statistical agencies should continue to address limits and deficiencies in today’s data, both through better measurement of existing data and through collection of new information where gaps in our knowledge have been identified. For example, current crime data tend to focus on those who are currently incarcerated while very little is known about the large number of people with criminal records. The reintegration of the formerly incarcerated into the economy and society should be a major policy priority, and good data on this segment of our population are essential to evaluating the success of our reintegration efforts.
As another example, many workers have entered new work arrangements in the gig economy (Katz and Krueger 2016). However, these nontraditional arrangements are not yet well accounted for by government data. The Contingent Worker Survey, last conducted by the BLS in 2005, has gained new relevance with the rise of companies like Uber and TaskRabbit. Given the increasing prevalence of alternative work arrangements, the BLS plans to bring back the survey, revamping it for the needs of the new economy (Department of Labor 2016).
Continue to Explore the Potential of Linked Survey and Administrative Data
In addition, the federal statistical system should continue to explore the potential of linked survey and administrative data. For example, the Census Bureau’s Longitudinal Employer–Household Dynamics program (Census Bureau 2016a) links worker-level information from state unemployment insurance records and firm-level information on those workers’ employers from the Quarterly Census of Employment and Wages (see figure 14). These job records can then be linked with survey data. Some European countries have taken the lead in this area: Denmark’s Household Budget Survey, for example, links data from surveys, accounting booklets, and federal registers, and then provides a more accurate economic picture while reducing the burden on survey respondents (United Nations 2007).
Increaes Data Synchronization Across Federal Agencies
Another area that deserves attention is data synchronization across federal agencies. As is highlighted throughout this paper, the federal government’s data collection is conducted by many distinct statistical agencies. In some cases, federal law does not permit these agencies to share information with each other. For example, the Census Bureau is permitted to access some IRS data to formulate its estimates; in particular, it assigns firms to industry categories with the help of this information. The BLS, which must also assign firms to industry categories when estimating employment, is not so permitted, generating substantial inconsistencies in the data assembled by the two agencies (Strain 2016). Motivated by concern that these inconsistencies reduce the quality of government-collected data, the Federal Economic Statistics Advisory Committee (2014) proposed that barriers to data sharing across agencies be removed, consistent with long-established protections for the confidentiality of federal data.
In another example of the problem, the BEA has to estimate rather than measure items like business income for nonincorporated firms. Better data sharing across agencies would allow the BEA to update and improve these estimates, which form the basis of essential economic statistics like federal deficit projections (Strain 2016). Indeed, the bipartisan Commission on Evidence-Based Policymaking was established in recognition of the fact that better use of existing data—and in particular use of administrative data and integration of administrative and survey data—improves how government programs operate.
Policy makers should continue to refine our methods for understanding the effects of federal programs. For example, concerns that our poverty statistics may not provide a sufficiently accurate picture of our nation’s poor led to the development of the Supplemental Poverty Measure by an interagency working group (Census Bureau 2016b). This new measure considers factors like tax payments, work expenses, and geographic differences to attempt to capture poverty status in a more nuanced way. Continued innovation in the collection and measurement of data will allow programs to reach the intended participants with evidence-based approaches.
