
The labor market continued its modest rate of expansion in June, according to today’s employment report. Employers added 80,000 jobs last month, about the number required simply to keep up with growth in the labor force. And the unemployment rate was unchanged at 8.2 percent. Most other indicators of labor market activity showed little movement—the employment-to-population ratio, the number of long-term unemployed, and the number of persons employed part time because they were unable to find full-time work remained essentially unchanged. All told, today’s employment report seems to confirm a slowing in the pace of recovery over the last three months from the solid pace set at the start of the year.
The Great Recession has profoundly affected almost all Americans, but it has not impacted all states equally. Some states have rebounded strongly, while others continue to struggle. Why is this the case? The answer is not simple—many economic forces are at work in creating these differences, but two are of particular importance: (1) the varying responses of state and local governments to the economic downturn, and (2) the impacts of federal stimulus spending across states.
In this month’s employment analysis, The Hamilton Project examines the effects of government policy in the rates of recovery among states and nationwide. Our survey of new evidence indicates that states that expanded government spending more (due in large part to support from federal stimulus during the recession) experienced smaller increases in their unemployment rates. This conclusion comes from a pair of new academic studies on the American Recovery and Reinvestment Act (ARRA) or the 2009 stimulus plan; both studies find robust evidence that government policy helped reduce the extent of the downturn and improve job growth. We also continue to explore the nation’s “jobs gap,” or the number of jobs that the U.S. economy needs to create in order to return to pre-recession employment levels.
The Relationship Between State Spending and Employment
There is much debate about whether and how government policies have helped to speed America’s recovery from the Great Recession. One argument is that government policies helped foster a recovery by increasing spending and reducing taxes to support workers, consumers, and businesses. An alternative view, however, sees this approach as neutral at best and counterproductive at worst.
The response of federal and state governments to the Great Recession provides an opportunity to collect evidence that sheds light on the issue. Federal policies affected some states more than others, and some states changed policies more than others, providing a real-life laboratory to examine the role of government policy by comparing the outcomes of different states that were treated and acted differently. By comparing expenditures and unemployment rates among the states, we find that those states that increased expenditures the most were less harmed by the Great Recession, relative to those that increased expenditures the least.
The graph below illustrates the relationship between increases in state government expenditures and changes in state unemployment rates. States are ranked by how much total expenditures increased from 2007 to 2010—the first bar represents the 10 states with the smallest increases in spending (on average 10 percent), while the fifth bar includes the 10 states with the largest increases (on average 25 percent). The height of the bar measures the average change in the unemployment rate for each group during this period. (To see the state-by-state breakdown of ranking and the change in state unemployment rates and per-capita expenditures, click here.)
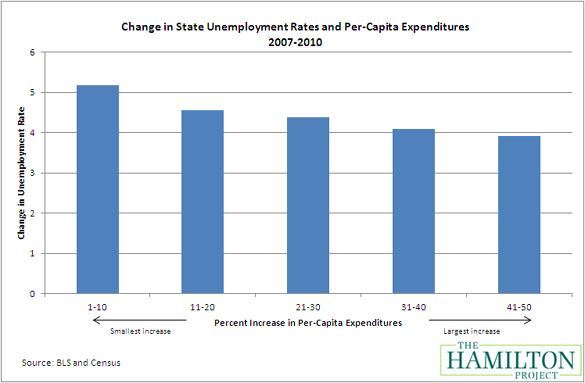
Unemployment during this period increased across the country because of the onset of the Great Recession. The increase in the nation’s unemployment rate from 2007 to 2010 was 5 percentage points. However, among those states that increased expenditures the least, the average unemployment rate increased by nearly 5.2 percentage points. On the other hand, states that increased expenditures the most experienced the smallest increase in unemployment (3.9 percentage points).
One source of this relationship is straightforward: hiring or retaining more teachers or emergency first responders means fewer people looking for work. But there are indirect effects too, as these teachers and emergency responders have money to spend, thereby increasing demand for goods and services in other areas of the economy. As a result, these increases in state spending do not just add to government jobs but add to employment across the economy.
Of course, there are numerous other factors at play in this relationship between spending and unemployment. States that were in better economic condition may have been in better fiscal shape and therefore had more flexibility to increase spending. For example, the government of North Dakota increased per-capita spending by more than 31 percent, and the state experienced the smallest rise in unemployment. But North Dakota also experienced the fortuitous expansion of gas and oil production, which increased both economic activity and employment and also filled the government’s coffers. In this case, a healthier economy may have also led to more spending, rather than more spending simply leading to a healthier economy. While the data are therefore suggestive, it is important draw on more rigorous studies to isolate the effect of stimulative spending policies during recent years.
New Evidence on the Importance of ARRA Stimulus Spending
The Great Recession and the implementation of ARRA provide a natural laboratory to examine the effect of government spending on employment. Two new studies take advantage of quirks in funding laws that caused some states to get more money for reasons that were plausibly unrelated to their economic prospects in order to explore the impact of stimulus on states. Below is a summary of two peer-reviewed, soon-to-be published empirical studies showing the direct causal relationship between ARRA spending and economic performance.
A paper by Gabriel Chodorow-Reich, Laura Feiveson, Zachary Liscow, and William Gui Woolston examines how grants to states included in ARRA affected state government spending and local labor markets. States with higher Medicaid spending before the recession received more stimulus dollars than others according to the allocation formula. For example, the state of Utah received $103 per person as of June 2010, while the District of Columbia received $507 per person. These differences in spending translated into big differences in employment. The authors estimate that an additional $100,000 in Medicaid aid to a state results in an additional 3.8 job-years, the great majority of which are outside the government, education, and healthcare sectors.
Similarly, Daniel J. Wilson investigates how differences in ARRA funding to states affected employment. Wilson takes a broad approach by examining more than Medicaid funding, taking advantage of the fact that states with more highway miles or with other characteristics unrelated to economic conditions tended to receive more stimulus money. He determines that stimulus spending had a significant impact within the first year of implementation and that each $125,000 in additional spending increased employment by about one job.
Of course, these estimates of the “cost per job” overstate the actual cost because they neglect the services provided by the spending. These funds were spent on fixing or improving infrastructure, bettering the education system, and reducing hardship in families of the unemployed—costs that would have been incurred in the future anyway and services with real value. All of the evidence, taken together, therefore points to a clear finding: the ARRA stimulus program played an important role in boosting employment in the wake of the recession.
The June Jobs Gap
As of June, our nation faces a “jobs gap” of 11.3 million jobs. The chart below shows how the jobs gap has evolved since the start of the Great Recession in December 2007, and how long it will take to close under different assumptions of job growth. The solid line shows the net number of jobs lost since the Great Recession began. The broken lines track how long it will take to close the jobs gap under alternative assumptions about the rate of job creation going forward.
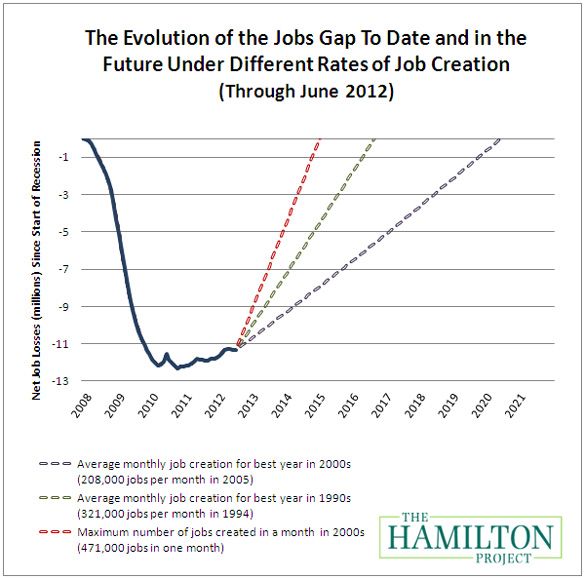
If the economy adds about 208,000 jobs per month, which was the average monthly rate for the best year of job creation in the 2000s, then it will take until June 2020 – or eight years – to close the jobs gap. Given a more optimistic rate of 321,000 jobs per month, which was the average monthly rate of the best year of job creation in the 1990s, the economy will reach pre-recession employment levels by August 2016 – not for another four years.
The Hamilton Project’s jobs gap calculator allows you to explore a range of scenarios using different assumptions about the rate of job growth. You can try it out by clicking here.
Conclusion
The Great Recession resulted in significant increases in unemployment, but it did not impact all states equally. In fact, one contributor to the disparities appears to have been the differences in state government spending. Those states that increased per-capita expenditures the most experienced the smallest rises in unemployment rates, while those that increased expenditures the least experienced the largest rises in unemployment. Although state governments certainly played a role in shaping their economic situations, much of the increased state spending was financed by the American Recovery and Reinvestment Act (the federal stimulus plan), which put significant amounts of money directly into depleted state coffers.
Given the serious challenge of the long-run budget outlook, it will be necessary to take difficult steps to address the imbalance between what the federal government spends and how much it raises in revenues. But it is also important to recognize that, despite the boost from the temporary stimulus, millions of Americans remain out of work and more than 40 percent of the unemployed have not worked for six months or longer. As policymakers grapple with these dual fiscal and economic challenges, it is important to recognize that they need not be at odds. The best prescription for improving the budget deficit over the next few years is to return the economy to health. To that end, it is instructive to consider the latest evidence that active budget policies enacted today can help boost employment and speed recovery.
