A joint report from The Hamilton Project and the Energy Policy Institute at the University of Chicago.
Introduction
The United States is in the midst of an energy revolution. The North American shale boom has unlocked vast quantities of natural gas, upending domestic electricity markets and enabling rapidly growing export volumes. American shale oil has sent global oil prices to their lowest sustained level in a decade and slashed U.S. imports in half. Meanwhile, the cost of renewable fuels like wind and solar electricity has plummeted, and they now account for the majority of new electric generating capacity.
Given this technological and economic context, the United States has perhaps never been better positioned to tackle the urgent threat of climate change. Though it is often discussed as a future problem, climate change caused by greenhouse gas (GHG) emissions is happening now. The concentration of carbon dioxide (CO2) in the atmosphere has increased from 317 parts per million in 1960 to more than 400 parts per million in 2016 (NOAA 2016), while the global average temperature has risen 1.6 degrees Fahrenheit (0.9° Celsius) above its 1960 level.
These changes are already impacting our everyday lives. Record-breaking temperatures, melting ice caps and more frequent coastal flooding, prolonged droughts, and damaging storms are just some of the intensifying risks we face as our planet continues to warm (IPCC 2007a). Despite these risks, the prices U.S. consumers pay for fossil fuels rarely reflect their costs, skewing consumption and investment choices away from cleaner fuels and discouraging the kinds of technological advancements that would allow the nation to make more efficient use of its energy resources.
Full Introduction
On our current trajectory, climate change is expected to intensify over the coming decades. If no policy actions are taken to restrict GHG emissions, expected warming would be on track for 8.1°F (4.5°C) by 2100. Strikingly, this amount of warming is actually less than would be expected if all currently known fossil fuel resources were consumed. Were this to occur, total future warming would be 14.5°F (8°C), fueled largely by the world’s vast coal resources.
The United States will not be insulated from a changing climate. If global emissions continue on their current path, average summer temperatures in 13 U.S. states and the District of Columbia would rise above 85°F (29.4°C) by the end of the 21st century, well above the 76 to 82°F (24 to 28°C) range experienced by these same states during the 1981–2010 period (Climate Prospectus n.d.). Climate change will lead to increased flooding, necessitating migration away from some low-lying areas; it will also lead to drought and heat-related damages (Ackerman and Stanton 2008).
There is no question that the United States has begun to make important progress on climate change. U.S. energy-related CO2 emissions in 2016 were nearly 15 percent below their 2005 peak, marking the lowest level of emissions since 1992 (EIA 2017a). The drop was largely driven by recent reductions in the electric power sector, where inexpensive natural gas is displacing more carbon-intensive coal-fired generation and renewables like wind and solar are slowly gaining market share.
However, large challenges remain. Avoiding dangerous future climate change will require reductions in GHG emissions far greater than what have already been achieved. Though progress in reducing emissions associated with electric power provides cause for optimism, developments in other sectors are less encouraging. In particular, transportation recently surpassed electric power generation as the largest source of U.S. emissions and is projected to be a more important contributor in coming years. Transportation CO2 emissions have increased despite strengthened fuel efficiency standards that aim to reduce emissions, suggesting that a review of this policy is warranted.
Moreover, climate change is a global problem. Recent gains in the United States have been offset by rising emissions elsewhere in the world. In past decades, most global emissions originated in the developed nations of Europe and North America. However, new GHG emissions are increasingly generated by China, India, and other developing economies, where economic growth and improving living standards are highly dependent on access to reliable, affordable energy. Today, that largely means coal. As economic and population growth surges in these countries, GHG emissions will rise accordingly; as a result, global emissions will continue to rise despite stabilization in Europe and the United States.
Numerous technologies—from nuclear power and carbon capture and sequestration to cheaper renewables and energy storage—hold considerable promise for addressing the global climate challenge. Yet current economic conditions do not favor the large-scale implementation of these technologies in developed or developing countries. Rapidly deploying these solutions on a large scale would almost certainly require some combination of expanded research and development (R&D) investments and carbon pricing, the policy interventions recommended by economic theory.
It remains uncertain whether policy makers around the world will be successful in responding to the threat of climate change. The consensus view of the scientific community is that future warming should be limited to 3.6°F (2°C) (Jones, Sterman and Johnston 2016). Achieving that target would require much more dramatic actions than have been implemented globally, with global CO2 emissions falling to near zero by 2100.
The Hamilton Project at the Brookings Institution and The Energy Policy Institute at the University of Chicago aim to support broadly shared economic growth. This jointly written document provides useful context for a discussion of the dangers to the economy posed by climate change and the policy tools for addressing those dangers. Given the immense threat that climate change represents, it is crucial that policy makers implement efficient solutions that minimize climate damages from our use of energy.
Chapter 1: The Energy and Climate Challenge
Fact 1: The United States possesses ample affordable energy.
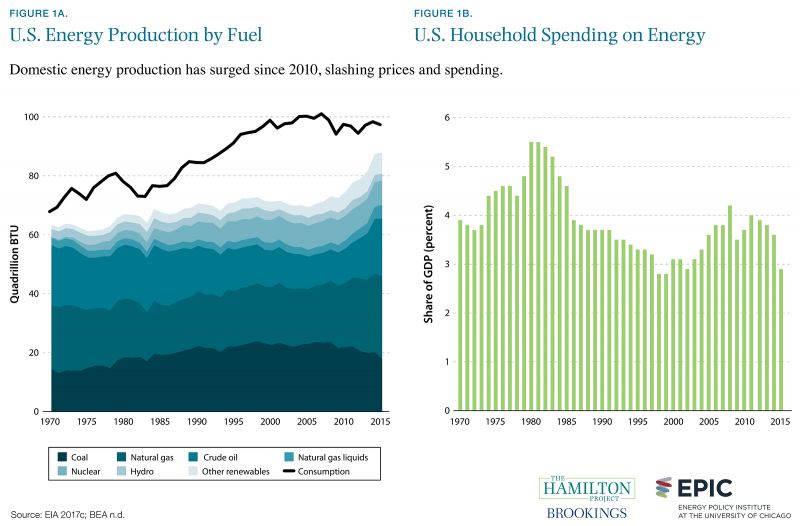
The United States is experiencing large increases in energy production, including both conventional fossil fuels and renewable sources. Driven by the advent of horizontal drilling and hydraulic fracturing, U.S. production of both natural gas and petroleum reached extremely high levels in 2015, with natural gas production even surpassing levels last reached in the 1970s (EIA 2017c). The surge in domestic production of both fuels has not only sharply reduced imports, but also created export opportunities that were widely unexpected as recently as a decade ago. U.S. liquefied natural gas (LNG) exports began in earnest in 2016, and surpassed 1 billion cubic feet per day by year-end (EIA n.d.a). Meanwhile, U.S. crude oil exports have surged following the elimination of statutory restrictions and averaged more than 500,000 barrels per day in 2016—though the nation remains a large net importer (EIA n.d.b).
Similarly, U.S. production of renewable fuels, including biomass and wind and solar electricity, has surged in recent years, growing by 55 percent since 2000. The fastest growth has occurred in the electricity sector, where wind production has grown 30-fold since 2000, and solar power by a factor of nearly seven. All told, U.S. domestic energy production reached a record 88 quadrillion BTU in 2015 compared to consumption of 97 quadrillion BTU. Total net imports supplied just 9.6 percent of consumption, down from a record 31 percent in 2005, suggesting that overall U.S. energy security has been significantly improved.
Combined with stable demand, the surge in domestic energy production has resulted in lower prices across multiple fuels, most notably oil and natural gas. The result is that American consumers are spending less on energy than at any time in decades. Measured as a share of GDP, consumer energy spending fell to 2.9 percent in 2015, its lowest level since 2002.
Fact 2: Global temperatures are rising.
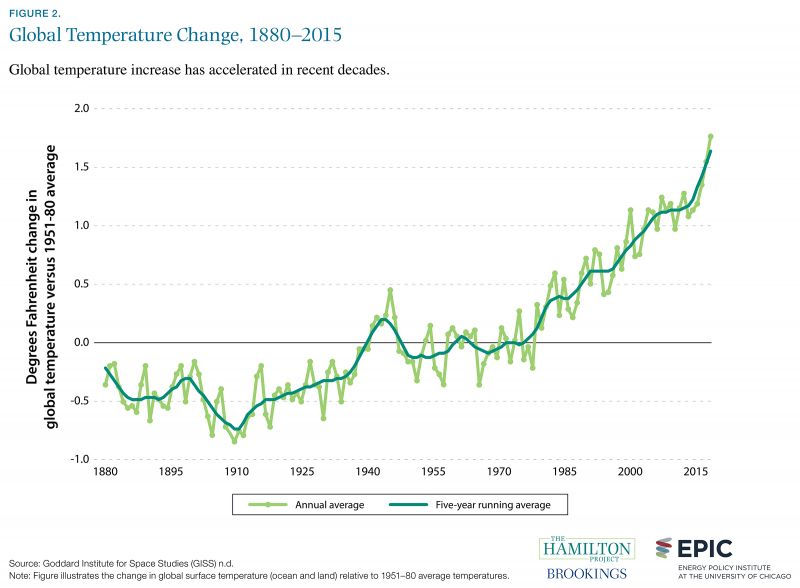
Discussions of climate change often give the impression that the phenomenon is exclusively about projections of the future—perhaps the distant future. However, climate change is already underway. The most straightforward evidence of climate change is the rising global average temperature. Indeed, “the 10 warmest years in the 134-year record all have occurred since 2000, with the exception of 1998” (GISS n.d). Using the 1951–80 period as a baseline, the current global average temperature is now elevated by 1.76°F (0.98°C). This increase has already had important effects on economies, infrastructure, and ecosystems. For example, exposure to high temperature conditions led to heat-related livestock losses exceeding $1 billion nationwide in 2011, and premature budding due to a warm winter caused $220 million in losses of Michigan cherries in 2012 (Hatfield et al. 2014).
Even this substantial temperature increase understates the extent of the departure from historical precedent. At 400 parts per million, atmospheric concentrations of CO2 have reached levels not observed for 10 to 15 million years (Tripati, Roberts, and Eagle 2009). As recently as 1960, the concentration was only 317 parts per million (NOAA 2016). CO2 concentrations have in fact already reached the threshold that—over the long run—scientists believe will trigger disruptive climate change.
Unfortunately, CO2 is removed from the atmosphere at a very slow rate. Even if policy actions were taken today to completely eliminate CO2 emissions, the atmospheric CO2 concentration would fall by only 40 parts per million over the entire 21st century (IPCC 2007b).
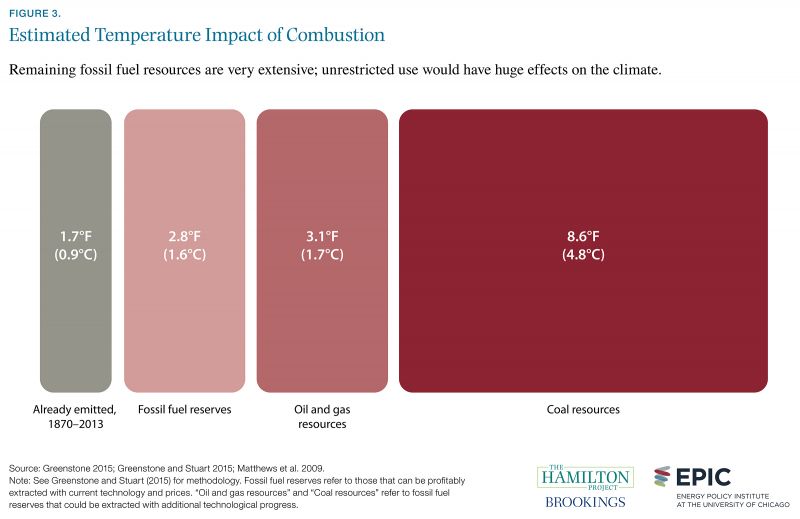
Fact 3: Global temperatures would likely rise by another 14.5°F (8°C) if all remaining global fossil fuel resources were used.
A common misconception about climate change is that the imminent exhaustion of fossil fuel resources will act as a natural restraint on CO2 emissions and associated temperature rise. In fact, fossil fuel resources remain extensive, particularly in the form of coal: 985 billion tons of global reserves of coal have been identified (BGR 2015). New technologies, ranging from hydraulic fracturing techniques to improved offshore rigs, have made it possible and economically feasible to recover much more natural gas and oil than was previously possible, further expanding the resource base (EIA 2016a).
As discussed in fact 2, prior CO2 emissions have already resulted in substantial global temperature increases. If world economies used all of the remaining fossil fuel resources that can be profitably extracted with current technology and prices, the total temperature impact is projected to be 2.8°F (1.6°C). Of course, technological progress could make this an underestimate of the potential warming to be expected from available fossil fuels. Were technological progress or price increases to induce the extraction of all additional currently known fossil fuel resources, further warming of 11.7°F (6.5°C) could be expected: 3.1°F from oil and gas and 8.6°F from coal (Greenstone 2015). Policy actions—and not the natural exhaustion of fossil fuel resources—will likely be required to avoid these outcomes.
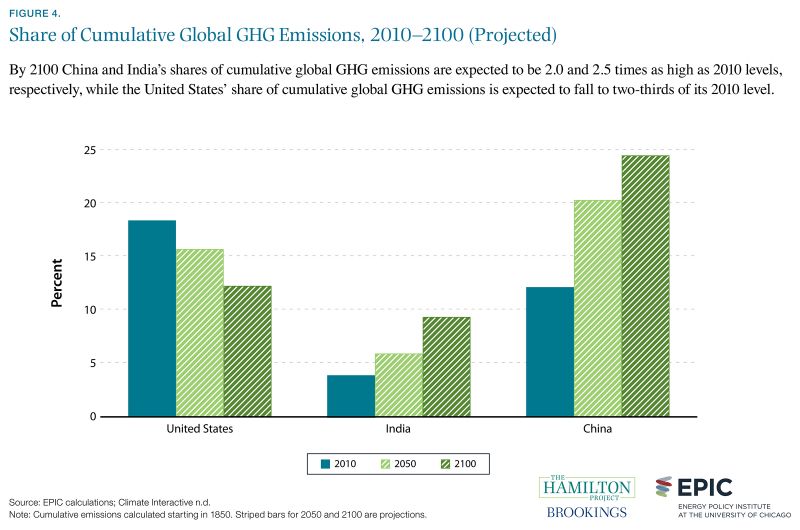
Fact 4: China and India’s share of cumulative global GHG emissions is projected to grow substantially by 2100.
The most important greenhouse gas—carbon dioxide—persists in the atmosphere for a very long and somewhat unpredictable length of time (IPCC 2007b). This is in contrast to other GHGs like methane that are removed relatively quickly from the atmosphere. Consequently, it is useful to focus not just on annual GHG emissions, but also on cumulative GHG emissions over a long period of time, which are more relevant for predicting temperature increase and climate change.
Because the United States industrialized many decades ago, it has produced sustained high levels of GHG emissions, accounting for a large share of global cumulative GHG emissions. By 2010 the United States had produced 18 percent of total global GHG emissions generated since 1850, as compared to only 4 percent generated by India and 12 percent by China. The U.S. share is projected to drop over time as developing countries’ GHG emissions grow and the United States continues to limit its new GHG emissions and experience relatively slow economic growth. By 2050 the shares of cumulative GHG emissions accounted for by China and India will be larger, at 20 and 6 percent, respectively, while the U.S. share will have dropped to 16 percent. By 2100 China and India will have produced over one-third of global cumulative GHG emissions.
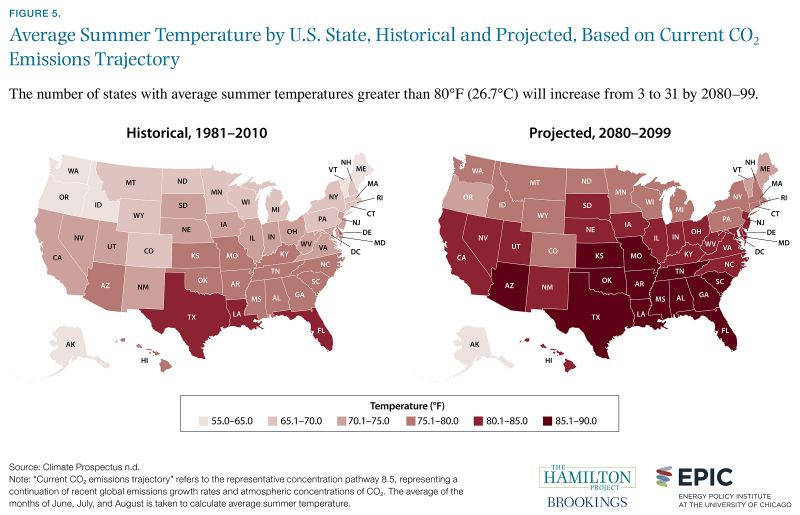
Fact 5: Over the next 70 years, every U.S. state is projected to experience increasing temperatures.
If global CO2 emissions continue to grow according to their current trajectory, the United States will feature a very different range of climates than it currently does. By 2100 the majority of U.S. states would experience summers hotter than those of Mexico in 2012. Some states would experience even higher temperatures; for instance, Texas and 9 other states would have summers comparable to summer in Sudan in 2012 (World Bank n.d.).
As shown in the maps above, the entire Deep South—with the exception of North Carolina—is projected to have an average summer temperature above 85°F (29.4°C) at the end of the current century. California, North Carolina, and Illinois would all be above 80°F (26.7°C).
Without adequate preparation, the implications for U.S. cities, industry, and agriculture would be alarming. High temperatures would cause hardship, as would drought and flooding. As discussed in a joint Hamilton Project and EPIC policy proposal by Matthew Kahn, climate change will necessitate costly adaptation by Americans and our local, state, and federal governments, most visibly through large-scale migration to areas that are less affected by climate change. In addition, many localities will need to make investments that protect them from the effects of climate change.
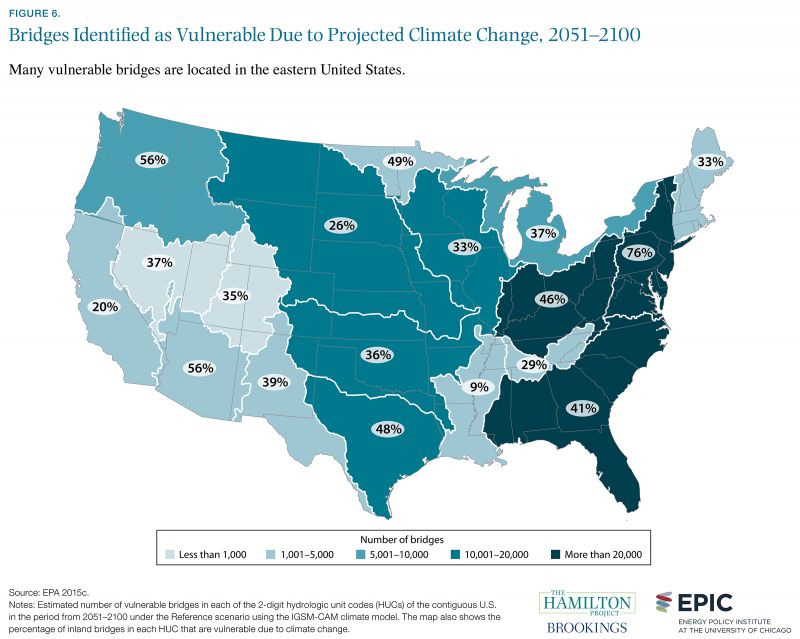
Fact 6: Much of U.S. infrastructure is vulnerable to the effects of climate change.
Much of U.S. infrastructure was not designed or built with climate change resiliency in mind. Partly for this reason, the projected costs of adapting to climate change are often large. For example, 190,000 bridges are considered to be vulnerable to flooding caused by projected climate change, and the cost of adaptation is estimated to be $170 billion for 2010–2050 and $24 billion for 2051–2100 (EPA 2015c). The estimated costs are front-loaded as a result of the large number of bridges that face near-term dangers from increased river flow. If investments are not made in adaptation, the economic damage from nonfunctional bridges would likely be even larger. Of course, if greenhouse gas emissions were reduced over the course of the 21st century, adaptation costs would be somewhat smaller.
Areas of vulnerability are especially concentrated east of the Mississippi River, where both a high absolute number and a high fraction of inland bridges are threatened. The local geological conditions, varying construction costs, and design of particular bridges all factor into projected vulnerability (Wright et al. 2012).
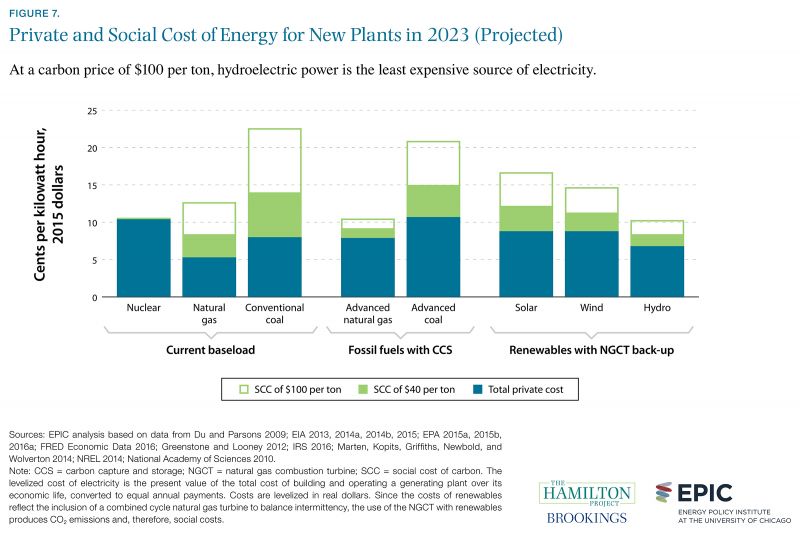
Fact 7: The prices we pay for fossil fuels do not reflect their social costs.
The prices consumers pay for fossil fuels are low relative to costs for other energy sources. In particular, natural gas has become a very inexpensive source of energy. However, this is only one part—the private cost—of the total social cost of generating electricity with fossil fuels. These private costs are shown in blue in figure 7.
Because CO2 emissions drive climate change that imposes costs on the broader society, the total social cost is considerably larger than the private cost. Of course, the social cost depends on assumptions made about damage from climate change. Using a U.S. government estimate of the cost of CO2 pollution ($40 per metric ton), the total social cost of a given energy source is shown as the sum of the blue and green bars.
After adding the cost of CO2 pollution under this standard assumption, advanced natural gas and hydroelectric tie as the least expensive energy sources, though nuclear energy is only slightly more expensive. Note that, in this analysis, solar and wind energy are associated with CO2 emissions because of the necessity of having a fossil fuel-powered backup during times of low light or wind.
Alternatively, if the cost of CO2 pollution is assumed to be substantially higher—$100 per metric ton—the total social cost is the sum of the blue, solid green, and hollow green bars. Hydroelectric energy then becomes the least costly energy source, while conventional coal production becomes the most expensive.
The technologies, policies, and other conditions that determine these prices are not fixed, of course. Market prices for renewable energy have dropped rapidly in recent years, and further technological progress is expected to lower the cost of solar energy in particular (International Renewable Energy Agency 2015).
Chapter 2: Mitigation and Adaptation
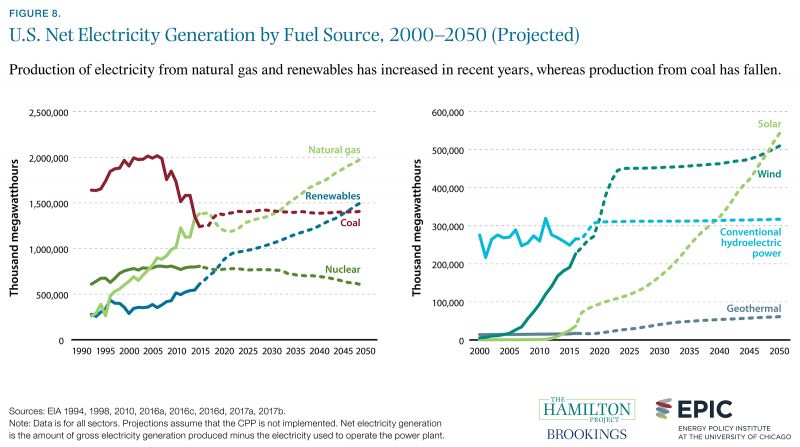
Fact 8: Electricity generation from renewable sources is expected to surpass generation from coal before 2050.
The electricity sector is experiencing revolutionary change. After decades of coal dominance in the United States, two important trends are evident, both of which act to reduce CO2 emissions. First, natural gas has begun to supplant coal as the leading source of U.S. power generation. This development can in large part be ascribed to the discovery of U.S. natural gas resources that can now be recovered through the process of hydraulic fracturing (EIA 2016e).
More recently, starting in the 2000s and accelerating in the 2010s, renewable electricity production has also substituted for coalpowered generation. Renewable power—derived largely from wind, solar, hydroelectric, and geothermal sources—is projected to exceed coal-powered generation by 2048. (These projections assume that the Clean Power Plan is not implemented.) Currently, wind and hydroelectric power are dominant within the class of renewables, but solar power is projected to account for a larger share as its price falls (Wood 2016).
Both federal- and state-level policies have directly supported expansion of solar technology through a variety of tax credits (EIA 2016f). Large-scale solar power capacity has exploded in the past several years due to technological progress and support from government programs (DOE 2016). Capital costs—which have been a major barrier to expanded solar production in the past—dropped by half between 2010 and 2015 (EIA 2016f; IEA 2014). Steep learning curves, scale efficiencies, and increased competition have decreased installation costs for photovoltaic technology (National Renewable Energy Laboratory [NREL] 2016). However, factors such as slow electricity demand growth, low natural gas prices, and electricity grid and storage limitations may limit future growth potential for renewables (EIA 2016f).
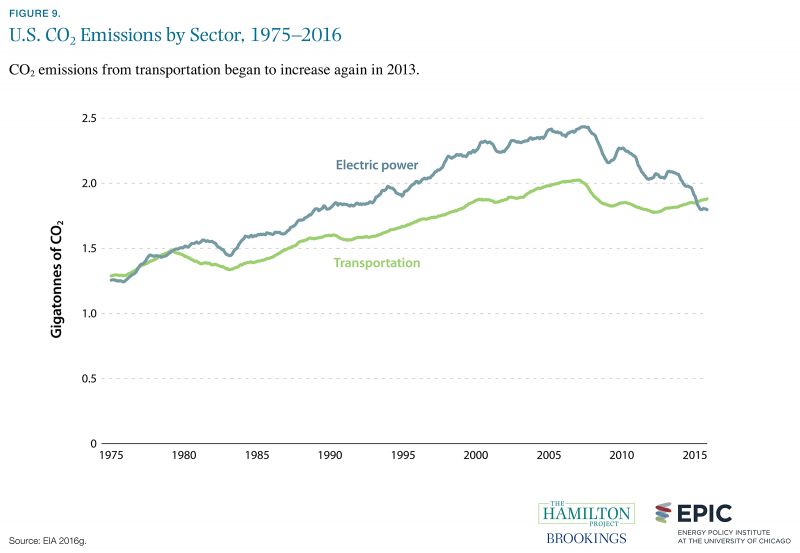
Fact 9: CO2 emissions from transportation now exceed electric power emissions.
For decades, growth in emissions from the electric power sector outpaced that of the transportation sector. However, transportation recently surpassed the power sector as the largest source of U.S. energy-related CO2 emissions in 2016 for the first time since 1979 (Vine 2016). Moreover, in its most recent long-term projections, the Department of Energy expects this dynamic to remain in place through 2040, even in the case where all current policies are extended (EIA 2016a).
The shift in emissions sources is driven by two key factors. First, as can be seen in figure 9, power sector emissions have plunged since 2008, owing to a combination of the 2007–09 financial crisis, the rapid displacement of coal by cheaper natural gas, and increasing renewable electricity generation. Second, transportation emissions have been on the rise since 2013, driven largely by the massive increase in U.S. highway vehicle miles traveled. Highway travel growth in 2015 and 2016 reached the highest levels since 1988, as was evident in fuel markets. Despite five years of progressively increasing fuel efficiency standards, U.S. gasoline demand set a historical record of 9.3 million barrels per day in 2016 (EIA 2016h).
In a joint Hamilton Project and EPIC policy proposal by Michael Greenstone, Cass Sunstein, and Sam Ori, the authors propose reforms that would more cheaply and effectively reduce CO2 emissions in the transportation sector.
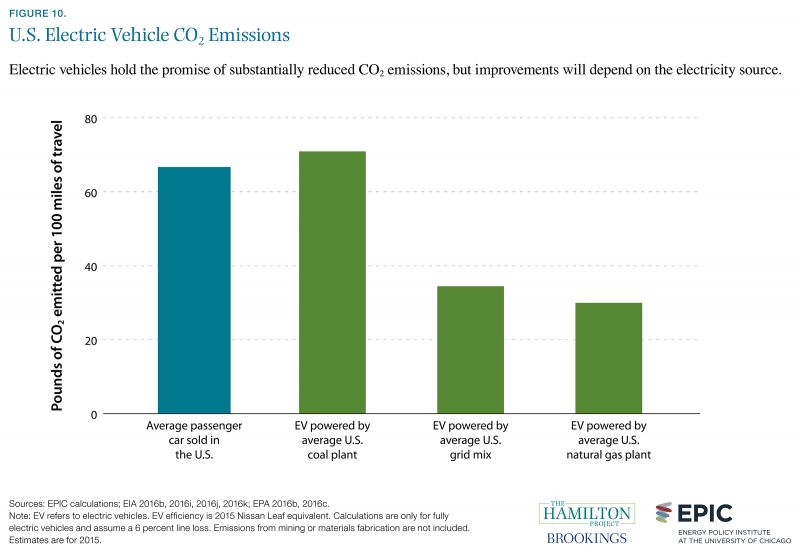
Fact 10: Emissions from electric vehicles powered by coal plants are substantially higher than those powered by natural gas plants.
Vehicles powered in part or in full by electricity have become much more common in recent years (DOE 2016). The reduction in gasoline usage implied by the rise of electric vehicles is typically assumed to contribute to CO2 emissions mitigation. Generally speaking, this is the case, but the details depend heavily on the fuel used to generate the electricity that powers the electric vehicle.
When powered by coal-fired plants, electric vehicles offer negligible CO2 emissions mitigation benefits over the average new vehicle. However, when powered by the average U.S. natural gas plant, an electric vehicle contributes nearly 60 percent less CO2 per mile than the average new gasolinepowered vehicle. When an electric vehicle is powered by the currently prevailing mix of energy sources in the United States, the gains are nearly as large.
This figure highlights the growing interaction between transportation and energy sector CO2 emissions. As the range of energy sources for vehicles widens and electric vehicles become more common, it will become increasingly important to design policies that account for CO2 emissions wherever they are generated.
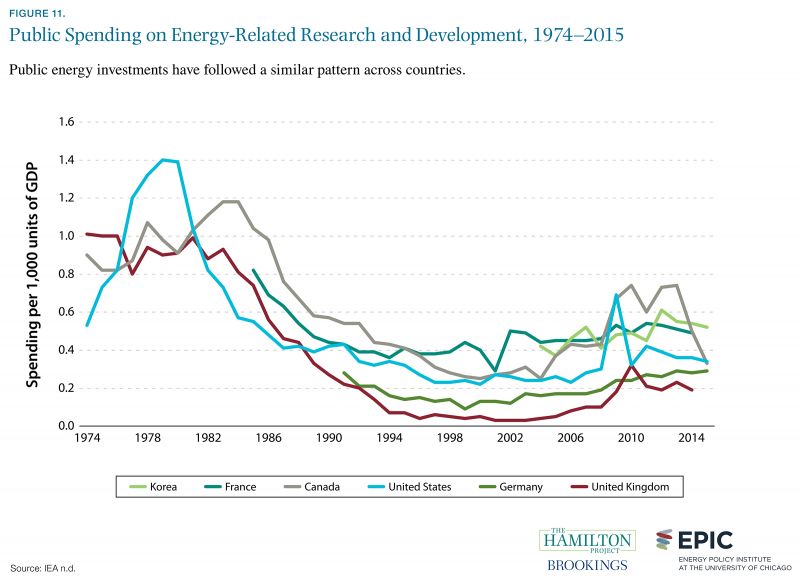
Fact 11: Public investment in energy R&D remains well below 1970s and 1980s levels.
Government investment in energy-related research and development has varied considerably over time, alternately receiving encouragement during periods of perceived crisis and lower support during periods of low prices and abundant supply. The oil shocks of the 1970s were associated with high and rising spending on energy R&D, while relatively low conventional energy prices from the mid-1980s through mid-2000s were associated with reduced investment (Avato and Coony 2008). Notably, this pattern holds true across the industrialized nations shown in figure 11, reflecting the fact that they all experienced the same changes in global energy markets.
In the United States, the composition of public energyrelated research and development investments has changed dramatically over the decades. In 1974, about three quarters of U.S. public spending was devoted to nuclear technologies. In 2014, the nuclear energy share had shrunk to 14 percent, while spending on renewable and energy efficiency technologies had grown to 35 percent. A similar trend can be observed for other countries: for example, the United Kingdom’s investment in renewable and energy efficiency technology rose from 3 percent of its 1974 spending to 38 percent of its 2014 spending.
Technologies such as energy storage, advanced nuclear power, and carbon capture and sequestration hold considerable promise for providing scalable, clean energy. However, the costs for all of these technologies require further reductions in order to be economically competitive. Increased R&D investment may help to achieve this goal.
Fact 12: Investments in climate adaptation would greatly lower the burden of climate change.
Sea-level rise poses a physical and economic threat to much of the coastal United States. By one projection, sea-level rise of 0.9 meters by 2100—which is within the range of scenarios considered by climate scientists—would put 4.2 million Americans at risk of inundation. At the high end of sea-level rise scenarios, a 1.8 meter increase would put 13.1 million at risk of inundation (Hauer, Evans, and Mishra 2016).
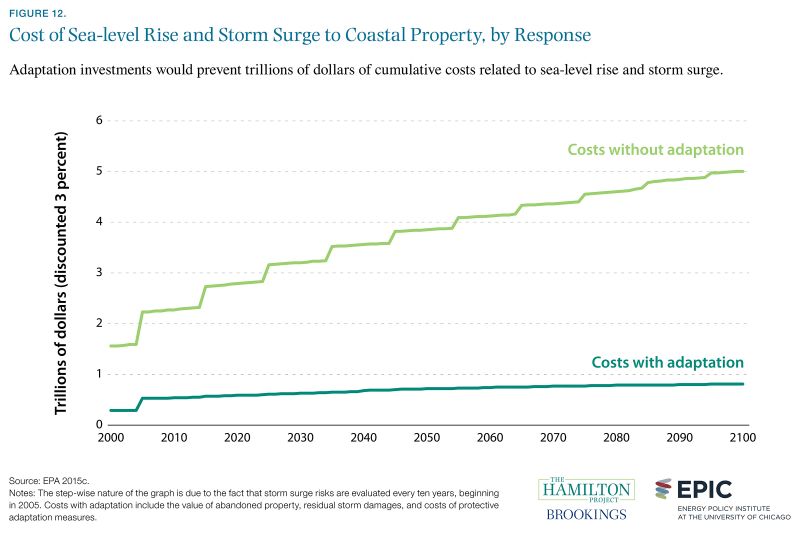
Sea-level rise, in conjunction with storm surges, will be very costly even if appropriate preparations are made. As shown in figure 12, the Environmental Protection Agency (2015c) estimates that the cumulative expense of sea-level rise and storm surges associated with climate change would be roughly $810 billion by 2100. If no preparations are made, the costs are far higher, at a cumulative $5 trillion by 2100.
These costs will take a number of forms: abandonment of property and damage from storms both figure prominently. Adaptation will itself be costly, even though it prevents larger costs from being incurred. Elevating properties above sea level and reinforcement of shorelines, for example, will generate costs in the scenario with adaptation.