Although the fiscal boost that Congress enacted in March 2020 cushioned some of the economic pain resulting from the COVID-19 pandemic, it is wearing off. The U.S. economy remains very weak and without more fiscal support the economic recovery is likely to falter. Congress and the White House are currently considering proposals to offer additional fiscal support.
In this analysis, we show the effects on economic activity, as measured by the Gross Domestic Product (GDP), of illustrative versions of several policies. Specifically, we examine five policies: a second round of checks to households, a resumption of enhanced unemployment insurance benefits, aid to state and local governments, support for small businesses, and other forms of fiscal support. In order to aid policymakers in their deliberations, this analysis shows how much stronger the economy would be with different kinds of fiscal support. The policies selected are neither intended to be comprehensive nor are they meant to recommend a particular legislative package. Together, the policies analyzed here are large enough to return projected GDP to its pre-pandemic path by mid-2021, years sooner than under current law.
We find that enacting all five of those illustrative policies and increasing federal spending by $2 trillion would raise the level of real (i.e, inflation adjusted) GDP by 0.2 percent in 2020, 4.0 percent in 2021 and 2022, and 1.6 percent in 2023 above the level it would otherwise be (authors’ calculations). If all five policies were enacted, economic activity would return to its projected path prior to the pandemic by the third quarter of 2021. Under current law, that return likely would not occur for perhaps as long as a decade. Of the five policies considered, increased unemployment insurance benefits have the largest “bang for the buck,” followed by rebates to households and aid to state and local governments. Fiscal support to small businesses has the smallest effect on the macroeconomy.
Of course, these policies should not be judged only on their macroeconomic impact, but also on the extent to which they provide needed relief to help households and businesses weather the pandemic. Nonetheless, it is instructive to compare the efficacy of each of these policies on boosting GDP.
How Fiscal Support Would Boost Economic Output
When recipients of federal aid increase their purchases of goods and services, businesses gear up production and hire more workers than they otherwise would, increasing production and GDP. In turn, those newly hired workers also increase their spending, which also leads to increases in production and GDP. (The increase in GDP for each initial dollar of spending is referred to as a fiscal multiplier.)
Illustrative Policies
We examine the effect on GDP from five illustrative policies. For comparability, each policy is assumed to total $400 billion. For some of these policies, particularly rebates, a policy of $400 billion is larger than what is generally being considered by policymakers and larger than the amount that was disbursed under the CARES Act. A smaller rebate to households ($300 billion) is also analyzed.
The five illustrative polices are:
- Rebates to households: Rebate checks of up to $1700 per adult and a child tax credit of $700 for the same households.
- Additional Unemployment Insurance payments: An increase in unemployment insurance (UI) benefits of an additional $300 per week for 12 months; and a 12-month extension of the CARES Act UI eligibility expansions to the self-employed, gig workers and those with insufficient work history for regular UI, which are set to expire at the end of 2020.
- Aid to state and local governments: An increase in general aid to state and local governments totaling $400 billion, disbursed over eight quarters.
- Fiscal support to small businesses: Another round of policy similar to the Paycheck Protection Program, totaling $400 billion in grants to small businesses, disbursed over four quarters (with three-quarters going out within two quarters).
- Other policies: Additional $400 billion for COVID-19 testing and contact tracing, higher education, and airlines.
How the Illustrative Policies are Analyzed
The impact on GDP of an additional dollar of federal aid—whether to people, businesses, or state and local governments—depends on how much and how quickly each received dollar is spent (known as the Marginal Propensity to Consume, or MPC) and how large the multiplier is. In the midst of the pandemic, the MPCs and the fiscal multiplier, in turn, depend on the extent of social distancing people practice, among other factors. As discussed in the technical appendix, for this analysis we choose MPCs based on the literature and use the multipliers the Congressional Budget Office (CBO) uses in a weak economy to calculate the effects of increased demand on GDP. We then attenuate the MPCs to account for the effects of social distancing over the next few quarters. We follow CBO in assuming that social distancing attenuates over the next three quarters; by next June, it is no longer a factor.
In addition to affecting spending, federal aid can affect the economy’s productive capacity. For example, aid to businesses while revenues are depressed can keep more of them viable until the pandemic recedes and the economy is healthier. That effect is included in this analysis. In addition, UI benefits allow people to search for work longer, which could lead to fewer people being employed. In our assessment, the effect of additional UI benefits on overall employment is not significant for the policy illustrated here.
Economic Effects of Illustrative Fiscal Policies
Figure 1 shows the effects of the five policies on the level of quarterly real GDP at an annualized rate. In the near term, the economic effects of the rebate checks to households are the largest because the checks go out quickly and recipients have a relatively large marginal propensity to consume. In 2023, the aid to state and local governments has the largest effect because the aid goes out more slowly and those governments are slower to spend the aid. Increases in unemployment insurance payments have the largest economic effects in 2022, largely because of when those payments are expected to go out to unemployed workers.
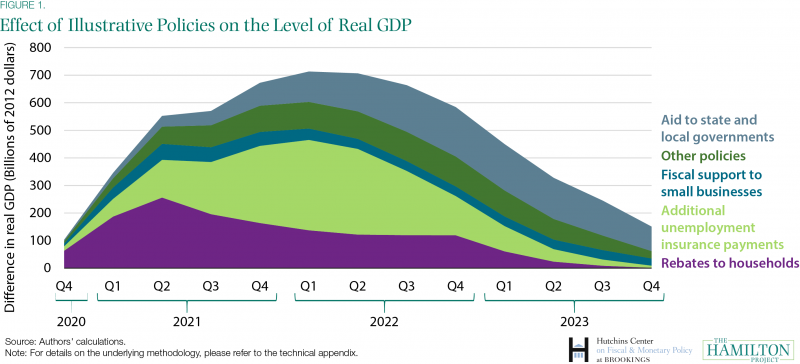
Figure 2 compares the projection of real GDP including the combined economic effects of all five policies (light green dashed line) to a modified version of CBO’s post-pandemic July 2020 projection that takes current law as given (blue dotted line) and to a projection of real GDP under CBO’s pre-pandemic January 2020 economic projection (teal dashed line). The modified version of CBO’s post-pandemic projection uses actual data for the second quarter projected forward using the growth rates in CBO’s July economic projection.
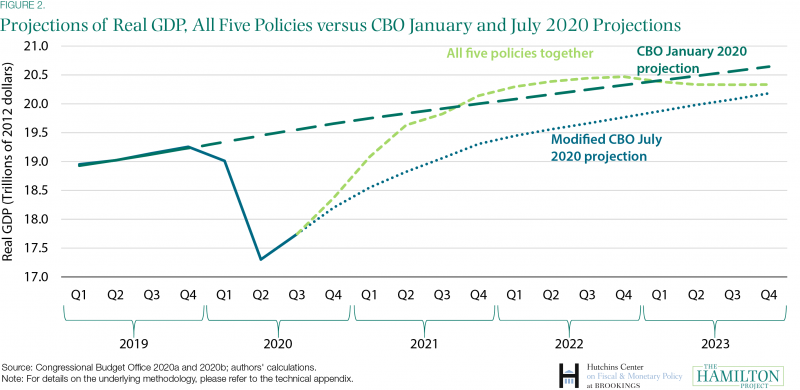
Under both post-pandemic projections, real GDP remains below its pre-pandemic peak (in the fourth quarter of 2019) for some time. However, with all five policies enacted, economic activity is back to its pre-pandemic level by the third quarter of 2021, which is the first quarter when social distancing is no longer a factor holding down activity in our analysis. Under that path, output modestly exceeds the pre-pandemic CBO baseline in 2022. Nonetheless, under that path, with all five policies enacted, cumulative GDP through 2023 is still far below its pre-pandemic projections.
The effect of fiscal policy on the economy is often expressed as the impact on real GDP growth. (See, for example, the Hutchins Center Fiscal Impact Measure.) When fiscal support increases, this initially boosts the growth rate of real GDP. In future quarters, if fiscal support maintains the higher level of GDP but does not increase it, it no longer has any effect on GDP growth. Eventually, as the support is withdrawn, the effect of the policy on GDP growth is negative.
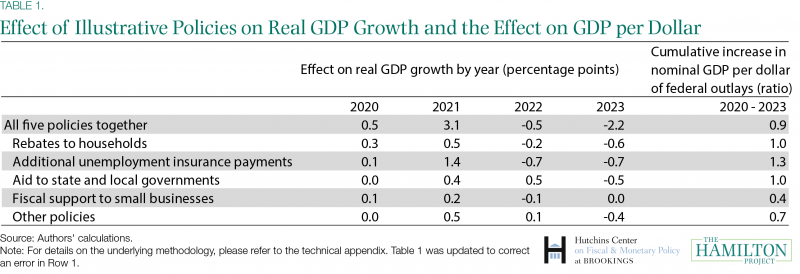
Table 1 shows the annual effects on GDP growth of each illustrative policy. Rebates to households have the largest effect this year, boosting GDP growth in 2020 by 0.3 percentage points, while expanded unemployment insurance has the largest effect in 2021. Table 1 also shows the cumulative effects on nominal GDP through the end of 2023 per dollar of fiscal support, what might be viewed as “bang for the buck.” As noted above, increases in UI benefits have the largest effect—boosting cumulative GDP by $1.30 for each $1 of federal spending. Support for small businesses has the smallest effect, because for most businesses the grants do not change spending or the chance of survival, increasing cumulative GDP by just 40 cents for every $1 of spending.
 To be sure, other policies than the ones considered here would likely show larger effects. For example, increases in food assistance through such programs as the Supplemental Nutrition Assistance Program would be estimated to have a larger “bang for the buck” than additional unemployment insurance payments. In addition, other policies that would provide fiscal stimulus would also have additional positive economic effects. For example, expanding and enlarging the Earned Income Tax Credit could increase after-tax wages for recipients and thus increase incentives for people to work.
How do the size and speed of fiscal policies alter the estimated effects?
The amount of fiscal support provided and the period over which the support flows for each policy matters. In this section, we illustrate how size and speed affect our estimated impact on real GDP using rebates to households as an example.
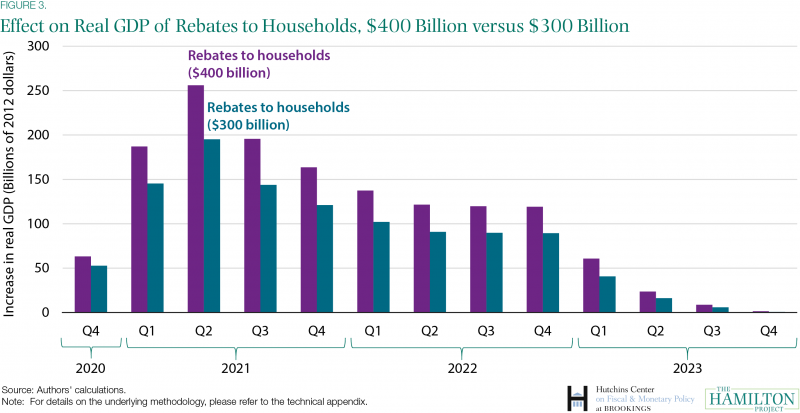
Figure 3 shows the estimated effect of rebates to households, comparing $400 billion in outlays to $300 billion in outlays. If the rebates to households totaled $300 billion, the economic effects would be smaller by roughly 25 percent. Nonetheless, the path of the estimated economic effects would have the same contour as under the illustrative policy that increased rebates by $400 billion.
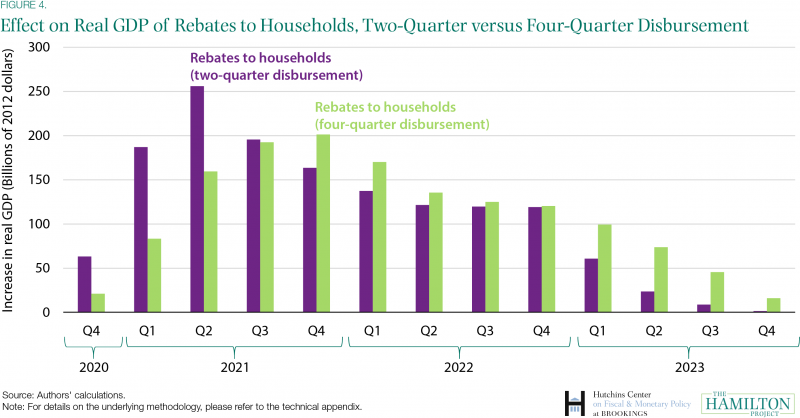
 The speed of the policy also affects the results. The policy described above assumed that the $400 billion was disbursed almost entirely in one quarter. If instead it was disbursed over four quarters, the near-term effect on GDP—when the economy is projected to be at its weakest—would be smaller (Figure 4). In addition, the immediate boost to GDP in later quarters would be larger because more of the money would be received by households after social distancing had fully receded.
Increasing the sizes of the policies would result in larger economic effects, and for modest increases the results are generally scalable. However, for large changes, the results are not scalable. In particular, a doubling of the aid would likely result in less than a doubling of the boost to GDP. MPCs for households and unemployed people would fall. States would spend the money more slowly and more of the aid would result in lower taxes. If the economic effects were slow enough to occur when the economy is much stronger, the fiscal multiplier would be lower.
Finally, two smaller collections of fiscal policies enacted over time could achieve much the same aggregate economic effect as is estimated here. Here, the collection of illustrative policies increases federal outlays by $2 trillion, with most of those outlays occurring over the next two quarters and the large majority occurring within four quarters. Alternatively, policymakers could—for example—enact policies now that increased outlays by $1.25 trillion relatively quickly and then in early 2021 enact other policies that increased outlays by $0.75 trillion. Depending on the nature of those collections of policies, the economic effects over the next three years could be similar to the ones presented here.
