
Interactive
Office-to-apartment conversion calculator
A calculator can determine the financial viability of office-to-apartment conversions and quantify the amount of subsidies needed.
Read More
Explore All Data
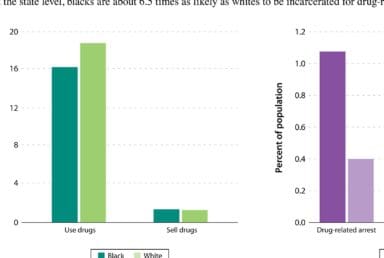
Rates of Drug Use and Sales, by Race; Rates of Drug Related Criminal Justice Measures, by Race
Black and white Americans sell and use drugs at similar rates, but black Americans are 2.7 times as likely to be arrested for drug-related offenses.