
The labor market continued its modest rate of expansion in July, according to today’s employment report. Employers added 163,000 jobs last month, the largest increase since February. The unemployment rate remained essentially unchanged at 8.3 percent.
A notable aspect of the July employment report is the decline in public-sector employment. In fact, public-sector employment (i.e. federal, state, and local government jobs) declined in 10 of the past 12 months, in sharp contrast to 29 consecutive months of private-sector job growth. Indeed, falling public employment has been among the largest contributors to unemployment in the United States since the end of the Great Recession.
In this month’s employment analysis, The Hamilton Project examines public-sector employment trends over the last three decades and finds that government employment contracted, both in absolute numbers and as a share of the population, during the Great Recession and throughout the current recovery. Additionally, we report on the results of a new analysis that finds that the cuts in public school teachers are projected to reduce the future earnings of today’s students by more than five times as much as the current budget savings.
We also continue to explore the nation’s “jobs gap,” or the number of jobs that the U.S. economy needs to create in order to return to pre-recession employment levels.
Declining Government Employment
Total government (i.e., the sum of state, local, and federal) employment has decreased by over 580,000 jobs since the end of the recession, the largest decrease in any sector since the recovery began in July 2009. State and local governments, faced with tough choices imposed by the confluence of balanced-budget requirements, falling tax revenues, and greater demand for public services, have been forced to lay off teachers, police officers, and other workers.
In order to look at specific occupations, it is necessary to turn to the Current Population Survey; the below table uses the data to assess the occupations where some of the key reductions in the public-sector workforce occurred. In raw numbers, the largest cuts were to teachers, but of these occupations, the largest percentage decline was among emergency responders.
| Occupation | Employment (2009) | Employment (2011) | Change in Employment | Percent Change in Employment |
| Teachers | 3,942,700 | 3,721,938 | -220,762 | -5.6% |
| Policemen | 666,579 | 610,427 | -56,125 | -8.4% |
| Fire fighters | 233,051 | 277,158 | 44,107 | 18.9% |
| Emergency responders | 69,370 | 39,170 | -30,200 | -43.5% |
| Air-traffic controllers | 23,959 | 17,128 | -6,831 | -28.5% |
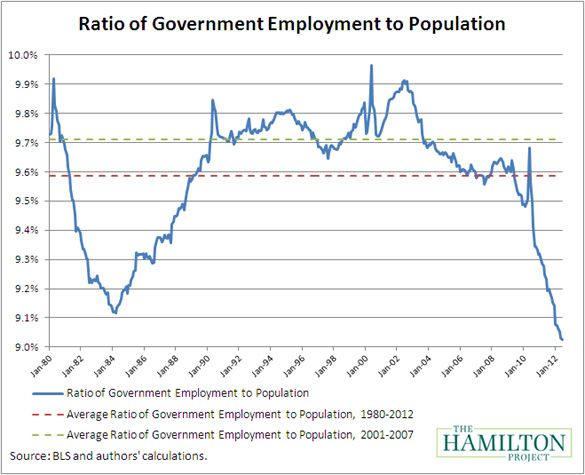
A look at the last four decades indicates that we are in unchartered territory with regard to government employment. From 1980 to 2012, 9.6 percent of adults were employed by the public sector, with a slightly higher fraction (9.7 percent) employed by the government in the years 2001-2007.
The below chart reveals that once the American Recovery and Reinvestment Act (ARRA) began to phase down – and state and local governments struggled to balance their budgets – government employment dropped precipitously and now stands at 9.0 percent. As the graph illustrates, this is the lowest level of public-sector employment in over 30 years.
The Short-Run Consequences of Government Layoffs
In the short term, reducing government employment, particularly during recessions, adds workers directly to the unemployment rolls. In addition, fewer workers translates into fewer paychecks, which dampens consumption and further spreads through the economy, magnifying the effects of the recession.
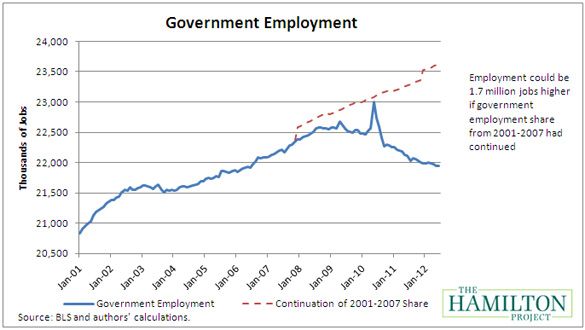
To examine the direct consequences of lower government employment, consider the case in which employment had hewed to its historical level. Between 2001 and 2007, the average ratio of government employment to population was 9.7 percent. Had that share remained steady, government employment would have been more than 23.6 million in June 2012 as compared to its actual level of 21.9 million. That is, employment would be 1.7 million jobs higher today if the share had remained constant, and the unemployment rate would be 7.1 percent instead of the current rate of 8.2 percent (see graph below).
The Long-Run Impact of the Reduction in Public Employment
Of course, it is always critical for governments to assess whether taxpayers’ money is being well-spent. It also goes without saying that many public sector employees provide health care, maintain state and local infrastructure, provide protective services, and help educate the next generation of workers.
One area where there is a sound body of literature to draw upon is the returns to education – specifically, the impact of class-size on student achievement and lifetime earnings. Drawing on this evidence, we quantify the impact of reductions in the number of public school teachers on our country’s future.
In 2011 there were over 220,000 fewer teachers in America’s classrooms than in 2009, a reduction accounting for nearly forty percent of the decrease in public-sector jobs during this period. This decline in the number of teachers increased the student-teacher ratio by 5.9 percent.
To determine the consequences of these reductions, we assumed that class-size increases were applied equally across all grades in K-12 schools. We then drew from recent research that links future earnings with class size to assess the wage impacts for today’s children, when they become working-age adults.1 All of this is explained in more detail here, but the bottom line is that this research suggests that the Great Recession will live on for decades through the lower future wages for our children.
Of course, an important test for the efficiency of government spending is whether the benefits exceed the costs. The savings from these cuts, in terms of teacher salaries and benefits, are $11.8 billion per year nationwide. While a significant figure, it is substantially smaller than the estimated present value in foregone earnings of $49.3 billion dollars for the children, whose education is affected by larger class sizes. To put a fine point on these findings, this translates into a per-student, per-year loss of nearly $1,000 in future earnings. In summary, the foregone benefits are more than four times larger than the current budget savings!
The July Jobs Gap
As of July, our nation faces a “jobs gap” of 11.3 million jobs. The chart below shows how the jobs gap has evolved since the start of the Great Recession in December 2007, and how long it will take to close under different assumptions of job growth. The solid line shows the net number of jobs lost since the Great Recession began. The broken lines track how long it will take to close the jobs gap under alternative assumptions about the rate of job creation going forward.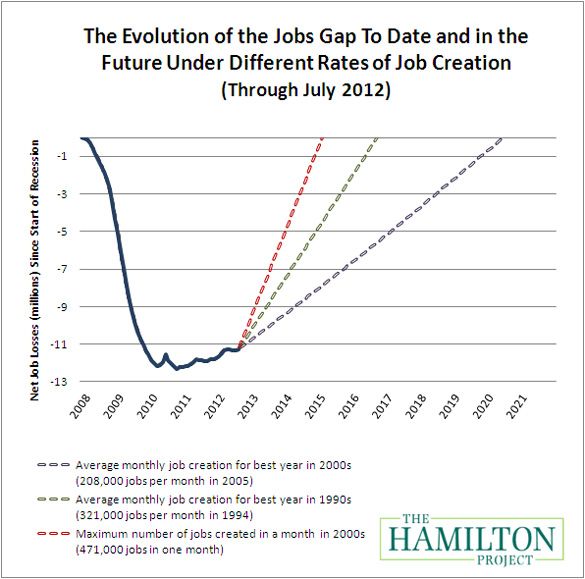
If the economy adds about 208,000 jobs per month, which was the average monthly rate for the best year of job creation in the 2000s, then it will take until June 2020 – or eight years – to close the jobs gap. Given a more optimistic rate of 321,000 jobs per month, which was the average monthly rate of the best year of job creation in the 1990s, the economy will reach pre-recession employment levels by September 2016 – not for another four years.
Conclusion
The private sector continues to be an engine for growth as the United States recovers from the Great Recession. However, tight budgets force a number of difficult decisions on policymakers (especially state and local ones), who are forced to lay off workers in order to meet their bottom lines. The result is that public-sector employment has been in sharp decline. This has worsened the current economic situation and the nation’s unemployment rate. These cuts – at least in the case of public school teachers – have also compromised our children’s future in ways that fail the even the strictest cost-benefit test. As state and local governments continue to face challenging budgets, a real risk is that they will be forced to make decisions that are both penny and pound foolish.
Chetty, Raj, John N. Friedman, Nathaniel Hilger, Emmanuel Saez, Diane Whitmore Schanzenbach, and Danny Yagan. 2011. “How Does Your Kindergarten Classroom Affect Your Earnings? Evidence from Project STAR.” Quarterly Journal of Economics 126(4): 1593-1660.