Each month, The Hamilton Project calculates our nation’s “jobs gap,” or the number of jobs that the U.S. economy needs to create in order to return to pre-recession employment levels—while also absorbing the people who newly enter the labor force each month and adjusting for the changing age distribution of the population.i As of the end of January 2016, our nation faces a jobs gap of 1.8 million jobs—the number needed to return to pre-recession employment as a share of the population.ii The jobs gap has declined by 82,000 jobs since last month.
Today’s employment report from the Bureau of Labor Statistics (BLS) shows that employers added 151,000 jobs. Although the unemployment rate has declined since 2011, inching down to 4.9 percent last month, the broader measure of the employment-to-population ratio, which includes people who have stopped looking for work and are therefore no longer considered to be in the labor force, has changed little since the end of the Great Recession. It currently stands at 59.6 percent, up less than 1.5 percentage points over the last five years, and far less than its pre-recession level of 62.7 percent in late 2007.
Beginning this month, The Hamilton Project introduces an additional methodology to calculate the jobs gap. Specifically, we add a new jobs gap measure that calculates the number of jobs needed to reach the pre-recession unemployment rate after allowing for demographic shifts and changes in labor force participation, which has been gradually falling for more than a decade. We present this new method in addition to our standard jobs gap measure—which calculates the number of jobs needed to return to the pre-recession employment-to-population ratio—to enable our readers to see the contrast between the two methods of estimating the jobs gap.
Below you will find additional background and context concerning The Hamilton Project’s introduction of the additional jobs gap measure.
Jobs Gap Measures
- The payroll count jobs gap is the simple, unadjusted count of payroll jobs needed to reach the pre-recession employment level.
- The pegged employment-to-population ratio jobs gap estimates the number of jobs needed to reach the pre-recession employment-to-population ratio after adjusting for population growth and aging.
- The pegged unemployment rate jobs gap estimates the number of jobs needed to reach the pre-recession unemployment rate after allowing for changes in labor force participation over time and after adjusting for population growth and aging.
Introducing the Pegged Unemployment Rate Jobs Gap Measure
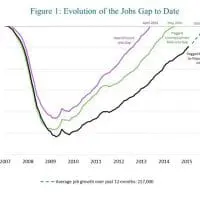
In Figure 1, we first show the simple, unadjusted count of payroll jobs lost during the Great Recession and then regained since the jobs recovery began in March 2010 (highlighted in the purple line above in Figure 1). This payroll count jobs gap fully closed nearly two years ago, in April 2014.
As we have emphasized since our jobs gap analysis began in 2010, however, the simple payroll count jobs gap does not represent the total number of jobs needed to bring the economy back to pre-recession levels because the population and potential labor force have continued to grow. As a result, this measure understates the size of the shortfall. At the same time, the share of the population that falls into different age categories has shifted—particularly because of the aging of the large baby-boom generation. Since employment-to-population ratios tend to fall as workers age, this demographic shift reduces the number of jobs needed to return to pre-recession levels. The Hamilton Project’s jobs gap estimates adjust for these factors, and starting this month, we now term THP’s standard jobs gap approach the “pegged employment-to-population ratio” jobs gap, because it calculates the number of jobs needed to return to the pre-recession employment-to-population ratio. The pegged employment-to-population ratio jobs gap—shown in black in Figure 1—still shows a deficit of 1.8 million jobs.
We extrapolate future job growth under the assumption that job growth will continue at its average rate over the past 12 months (currently 217,000 jobs per month).iii If this growth rate holds, the economy will reach pre-recession levels in January 2017.
We add to our standard approach a new “pegged unemployment rate” measure of the jobs gap that estimates the jobs needed to return to 2007 unemployment rates—that is, the ratio of the number unemployed to the number in the labor force—while allowing for shifts in labor force participation rates over time. This new measure (described in more detail below) is shown in green in Figure 1 above and indicates that the pegged unemployment rate jobs gap closed in May 2015.
Calculating the Jobs Gap: Technical Details
Calculating the jobs gap requires data on employment levels and population counts over time, disaggregated by age and sex, as well as projections of future population growth. In addition, it requires setting a pre-recession benchmark to which jobs growth progress will be compared.
In August 2014, The Hamilton Project updated its original methodology for calculating the monthly jobs gap by calculating a baseline employment-to-population ratio based on pre-recession data. To be more specific, we held constant annual average employment-to-population ratios in 2007 for each of 28 groups defined by age ranges and gender, and allow the population within each group to evolve over time according to population projections. This enabled us to account for both population growth and the aging of the population in determining the number of jobs that must be created for the labor market to have the same employment-to-population ratio as it had before the recession began, adjusted for demographic changes.iv We continue to calculate this measure of the jobs gap, which we now term the “pegged employment-to-population ratio” gap measure.
As shown below in Figure 2, the overall labor force participation rate has been declining in recent years. Since 2007, the participation rate has declined from 66.0 percent to 62.7 percent. While the causes of this decline are still being debated, many analysts believe that some of the decline is structural—that is, due to the aging of the population and other forces such as changes in retirement behavior—and some is due to cyclical job market weaknesses such as weak demand (Aaronson et al. 2014). We have long acknowledged that by calculating the jobs gap based on fixed employment-to-population ratios we do not adjust for long-term participation trends within age groups, such as declining participation among teenagers or rising participation among senior citizens.
This month’s addition of a pegged unemployment rate jobs gap measure, in contrast, essentially makes the extreme assumption that the entire decline in labor force participation is permanent. This method calculates the number of jobs needed to return to pre-recession unemployment rates after adjusting for not only changes in demographics but also labor force participation rates. To be more specific, to calculate the pegged unemployment rate jobs gap, we take the labor force in each month since 2007 for each of the 28 age-sex groups, multiply it by the group-specific employment rate (i.e., one minus the unemployment rate) that prevailed in 2007, and aggregate the number of jobs needed to return to pre-recession levels.v
As The Hamilton Project has discussed previously, economists generally think that the decline in labor force participation rates in recent years reflects multiple sets of forces, some supply side and some demand side. At this point, there is no consensus about which changes should be considered permanent and which we should expect to be reversed. Accordingly, the two approaches we produce this month measure the jobs gap against two different benchmarks, both of which adjust for changing population demographics. Our regular measure is pegged to pre-recession employment-to-population ratios; changes in labor force participation rates are not incorporated into the calculation. The new measure pegged to pre-recession unemployment rates shows how the jobs gap differs if instead we make the extreme assumption that the entire decline in labor force participation rates is permanent. While no measure is perfect, these approaches are transparent, and allow interested analysts to make additional adjustments if they so choose. Next month, The Hamilton Project will further explore these factors by providing an analysis that explores how the jobs gap would measure up based on different assumptions about what share of the decline in labor force participation is permanent.
References
Aaronson, Stephanie, Tomaz Cajner, Bruce Fallick, Felix Galbis-Reig, Christopher Smith, and William Wascher. 2014. “Labor Force Participation: Recent Developments and Future Prospects.” Brookings Papers on Economic Activity, Fall 2014. The Brookings Institution, Washington, DC.
i We thank Jane Dokko, Benjamin Harris, Lawrence Katz, and Melissa Kearney for helpful conversations.
ii This estimate reflects updated population estimates and projections, and a correction to a prior data entry error. As a result, the estimate is substantially lower than last month’s jobs gap report.
iii In previous months we also showed a projection of job growth based on the average growth rate since March 2010, the trough of the jobs deficit; over time these two projections have substantially converged. The Hamilton Project website offers an interactive feature that allows users to enter their own monthly jobs growth number, to see how the path to closure varies by growth rate.
iv To be more precise, we take population projections from the Census Bureau and modify them to accord with the BLS estimates of the adult civilian, non-institutionalized population, the same population over which the employment-to-population ratio is calculated. Annual estimates of the population within each age-sex cell are converted to monthly numbers by assuming a constant growth rate between years for the intervening months. For example, the employment-to-population ratio in 2007 for men age 30 to 34 was 89.4 percent. The population for this cell is forecast to rise from 10.36 million in 2015 to 10.49 million in 2016. This annual population growth of 130,000 is converted to a monthly increase of about 10,800 and then multiplied by 89.4 percent to reach 9,655, the number of new jobs needed each month for this cell to keep the employment-to-population ratio constant. The procedure is performed for each cell and the resulting numbers are then summed across cells. Because employment as measured in the BLS household survey (which is used to calculate the unemployment rate) includes a larger scope of workers than the BLS payroll survey (which is used to estimate month-to-month employment gains by employers), we make them comparable by scaling down the household-based measure. Specifically, we multiply the monthly job needs by 0.94, the ratio of payroll employment to household employment that prevailed in 2007.
v Because the disaggregated labor force counts are not seasonally adjusted, we use a 12-month moving average of labor force. In other words, the December 2015 labor force used in the calculation is the average of the January–December 2015 monthly levels.