See The Hamilton Projects updated Jobs Gap Calculator to estimate different assumptions of job growth and recovery.
According to today’s employment report from the Bureau of Labor Statistics (BLS), employers added 209,000 jobs in July, about the same monthly pace of job creation that has prevailed over the last two years. Although the unemployment rate has steadily declined since 2011, reaching 6.2 percent last month, the broader measure of the employment-to-population ratio, which includes people who have stopped looking for work, has changed little since the end of the Great Recession. It currently stands at 59.0 percent, up less than 1 percentage point over the last five years, and far less than its pre-recession level of 62.7 percent in late 2007.
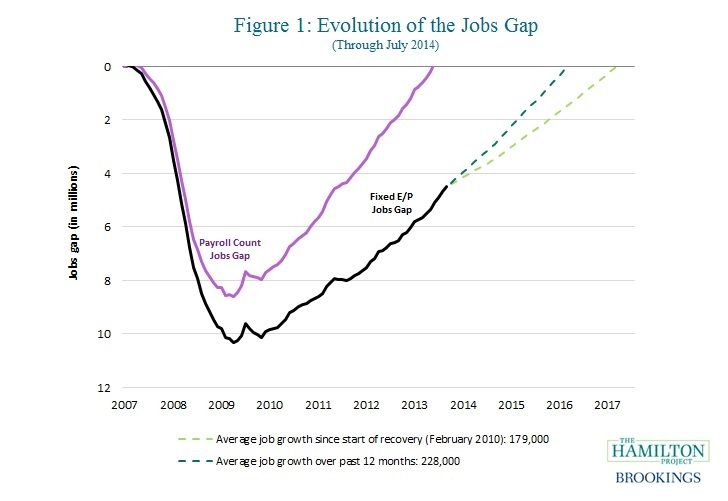
Each month, The Hamilton Project calculates America’s “jobs gap,” or the number of jobs that the U.S. economy needs to create in order to return to pre-recession employment levels while absorbing the people who newly enter the labor force each month. As of the end of July 2014, our nation faces a jobs gap of 4.5 million jobs.[1]
A New Approach to the Jobs Gap Analysis
With this update to our jobs gap analysis, we have implemented a few changes to the visual presentation of the gap. First, we have added another series to show the simple count of payroll jobs lost during the Great Recession and then regained since the jobs recovery began in March 2010. This deficit, shown in purple in Figure 1 below, fully closed three months ago, in April 2014. As we have emphasized since our jobs gap analysis began in 2010, however, the payroll job count deficit does not represent the total number of jobs needed to bring the economy back to pre-recession levels because the population and potential labor force have continued to grow. Our preferred measure of the jobs gap accounts for this growth. In contrast with the payroll count, our jobs gap still shows a deficit of 4.5 million jobs. While this level is less than half the gap reached during the trough in February 2010, we are still far from a complete recovery.
Another change with this month’s analysis is how we track the pace of recovery. Previously, we showed how long it would take for the jobs gap to close under alternative assumptions about the future pace of job growth, with these assumptions drawn from historical patterns. Specifically, we provided projections for employment growing at the average monthly rate for the best year of job creation in the 2000s, the average monthly rate for the best year of job creation in the 1990s, and the best single month of job creation in the 2000s. However, it has become increasingly clear that these assumptions are outside of the reasonable range of expected job growth. Instead, we now show job growth under assumptions based on the current recovery, and will update these assumptions monthly as new information becomes available. In particular, the dashed lines project monthly job growth at either the average rate since the jobs recovery began in March 2010 (currently 179,000 jobs per month), or the average rate of job growth over the preceding 12 months (currently 228,000 jobs per month). Under average growth since March 2010, it will take until February 2018 to close the jobs gap; under the more optimistic growth of the last 12 months, the economy will reach pre-recession employment levels in January 2017.
Refining the Methodology
In September 2013, The Hamilton Project’s employment analysis discussed how reduced rates of immigration and lower rates of labor force participation—both due in large part to the Great Recession—had caused earlier forecasts of labor-force growth to be revised sharply downward. While it makes economic sense to ignore lower-than-expected population in calculating a jobs gap—people not living in the United States are not eligible to be counted as having a U.S. job—reduced labor force participation rates, particularly within age groups, are more problematic. To accurately estimate the jobs gap, we need to know how these participation rates—and thus the underlying labor force—would have evolved in the absence of the recession.
When The Hamilton Project created the jobs gap analysis, we used BLS projections of the labor force made in 2009, before the depth of the recession was apparent. However, these initial projections lacked sufficient detail more than a few years out, and subsequent projections by BLS incorporated the reduced participation rates from the recession—precisely what we wanted to avoid conceptually in constructing the jobs gap. Thus, beginning with the update based on August 2013 numbers, we switched to projections of the potential labor force made by the Congressional Budget Office (CBO). These projections attempt to control for business-cycle fluctuations in participation rates and incorporate the effects of additional policy changes, such as implementation of the American Taxpayer Relief Act or the Affordable Care Act. While they represent an improvement over the BLS projections in adjusting for the business cycle, they are still not ideal. Although they are updated annually, the adjustment process changes somewhat each time and large revisions are possible, making the procedure complex and less than transparent.
In the interest of greater simplicity, starting with this update, we no longer directly use labor force projections to account for the changing labor force. Instead, we create a baseline based on employment-to-population ratios before the onset of the recession. That is, holding constant annual average employment-to-population ratios in 2007 for each of 28 age-sex cells (14 age groups for each of males and females), we allow the population within each cell to evolve over time according to population projections that are not sensitive to the business cycle. This allows us to account for both population growth and the aging of the population in determining the number of jobs that must be created for the labor market to be in the same position as it was before the recession began.
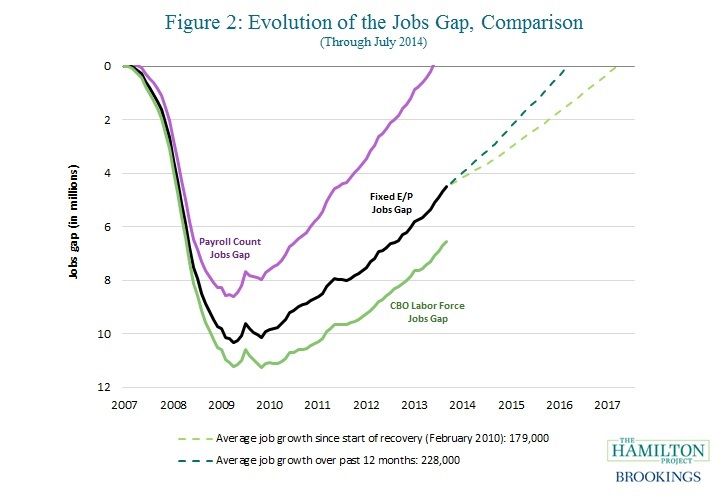
Figure 2 above shows how the jobs gap changes according to the new methodology. The green line shows the previous methodology based on CBO labor force projections and the black line is the new methodology based on fixed employment-to-population ratios. It has the effect of shrinking the current gap by two million jobs, with most of this difference opening up during the recession; since 2012 the black and green lines have been roughly parallel. The spread between methodologies is primarily due to CBO projecting faster labor force growth during (but not after) the recession than was necessary to keep employment-to-population ratios constant.
Challenges to Calculating the Jobs Gap
Accurately determining potential employment—the hypothetical measure of the number of workers who would be employed after controlling for business-cycle factors—is challenging. Potential employment can change due to a variety of factors, including immigration, demographics, labor force participation by older workers, and decisions by working-age individuals about whether to participate in the labor force. With our new approach, we account for many of the factors that could be predicted to change before the recession, but we remain agnostic about how other factors were affected by the recession. For example, our use of fixed employment-to-population ratios means we will not capture long-term participation trends within age groups, such as declining employment among teenagers or rising employment among senior citizens. (Both the CBO and BLS consider these trends quite minor in affecting the total labor force over the next several years.) However, while no approach is perfect, our approach is transparent, and allows interested analysts to make additional adjustments if they so choose.
[1]This post originally reported a jobs gap of 5.7 million for July 2014. This estimate was revised in February 2016 to correct a data entry error.
[2] To be more precise, we take population projections from the Census Bureau and modify them to accord with the BLS estimate of the adult civilian, non-institutionalized population, the same population over which the employment-to-population ratio is calculated. Annual estimates of the population within each age-sex cell are converted to monthly numbers by assuming a constant growth rate between years for the intervening months. For example, the employment-to-population ratio in 2007 for men age 30 to 34 was 89.4 percent. The population for this cell is forecast to rise from 10.17 million in 2013 to 10.30 million in 2014. This annual population growth of 130,000 is converted to a monthly increase of about 10,800 and then multiplied by 89.4 percent to reach 9,655, the number of new jobs needed each month for this cell to keep the employment-to-population ratio constant. The procedure is performed for each cell and the resulting numbers are then summed across cells. Because employment as measured in the household survey (which is used to calculate the unemployment rate) includes a larger scope of workers than the payroll survey (which is used to estimate month-to-month employment gains by employers), we make them comparable by scaling down the household-based measure. Specifically, as we did previously, we multiply the monthly job needs by 0.94, the ratio of payroll employment to household employment that prevailed in 2007.