
Employers added 165,000 jobs in April, according to the Bureau of Labor Statistics, following upwardly revised gains of 332,000 in February and 138,000 in March. The three-month average pace of job gains of 211,000 was slightly above the average pace of 173,000 jobs over the last twelve months. The unemployment rate edged down to 7.5 percent, and the fraction of the population reporting a job edged up. The unemployment rate has now declined 0.6 percentage point since last April, although much of this change can be attributed to declining rates of labor-market participation rather than increases in employment.
These numbers continue a pattern of steady growth in the labor market, but they also confirm that America’s recovery from the Great Recession is still very much a work in progress. The public sector, especially, has been a drag on the economy in recent months. While the private sector has added roughly 2.2 million jobs over the past year, employment in state, local, and federal governments has declined by 89,000, including significant losses to teachers and emergency responders. In this challenging economic climate, there is growing concern about how sequestration—the across-the-board budget cuts to discretionary spending that took effect on March 1—may negatively impact the recovery even more. Indeed, forecasters at the Congressional Budget Office project that the sequestration could reduce overall GDP growth in the United States by 0.6 percentage point and cost the economy 750,000 jobs by the end of 2013.
In this month’s employment analysis, The Hamilton Project examines the trajectory of public-sector employment since the onset of the Great Recession and contrasts this decline to periods of economic recovery after previous recessions. We find that the last several years’ policy choices are starkly different from those following previous recessions. Specifically, there are 2.2 million fewer jobs today, relative to what would have occurred with the policy response typical of the five preceding recessions. We also continue to explore the “jobs gap” and find that the country needs to add about 10.0 million jobs to return to pre-recession employment levels.
Government Employment Since the Recession
The downward trend in public-sector employment, described in a Hamilton Project report last summer, has continued into the opening months of 2013. While the private sector has added jobs to the economy in every month since March 2010, a total increase of approximately 6.8 million jobs, the public sector has contracted. To put this in perspective, federal, state, and local governments added jobs in only twelve of the thirty-eight months since March 2010 and have lost more than 625,000 jobs over this period.
The graph below shows the ratio of government employment to the civilian non-institutional population (every civilian in the United States sixteen and older who is not in prison or a live-in care facility) going back to 1980. For the twenty years prior to the Great Recession, this ratio stayed relatively constant, but since then it has dropped precipitously, except for the temporary uptick in 2010 when government employment rose to accommodate demand for U.S. Census workers.
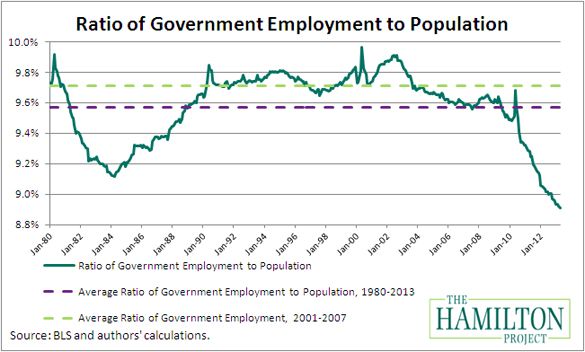
This figure shows that the percentage of individuals working for federal, state, and local governments is at a decades-long low. In fact, the ratio of government employment to population has not been below 9 percent since the mid-1960s. The result, as detailed in last summer’s Hamilton Project report, is over 200,000 fewer teachers, 50,000 fewer policemen, and 6,000 fewer air-traffic controllers since 2009.
Government Policy: It's Different This Time
By cutting jobs during a period of already high unemployment, budget policies have contributed to the tepid pace of labor-market recovery and stand out as a departure from typical policy responses after recessions. The figure below shows the change in government employment forty-six months after every recession in the United States going back to 1970. (The double-dip recessions of 1980 and 1981, which ended in November 1982, are counted as a single event.) The bars are scaled by the population of the United States in June 2009 so that the magnitudes of employment changes are comparable.
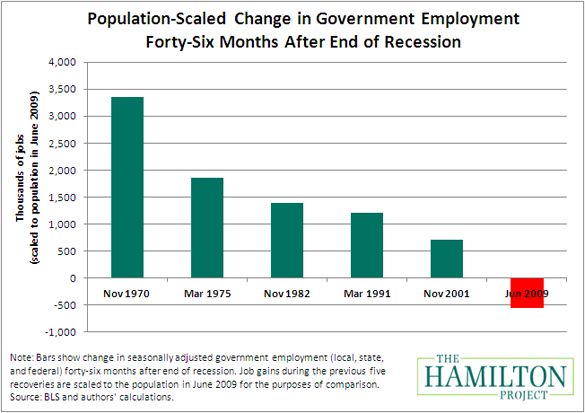
The ongoing recovery, which began when the Great Recession ended in June 2009, dramatically deviates from the usual pattern. In the forty-six months following the end of the five other recent recessions, government employment increased by an average of 1.7 million. During the current recovery, however, government employment has decreased by more than 500,000. Put together, the policy differences have led to 2.2 million fewer jobs today. Such a large contraction of the public-sector during a recovery is unprecedented in recent American economic history.
The April Jobs Gap
As of April, our nation faces a jobs gap of 10.0 million jobs. The chart below shows how the jobs gap has evolved since the start of the Great Recession in December 2007, and how long it will take to close under different assumptions of job growth. The solid line shows the net number of jobs lost since the Great Recession began. The broken lines track how long it will take to close the jobs gap under alternative assumptions about the rate of job creation going forward.
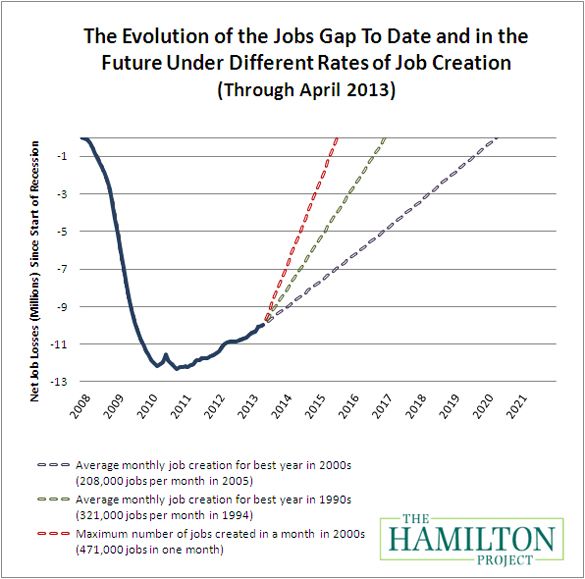
If the economy adds about 208,000 jobs per month, which was the average monthly rate for the best year of job creation in the 2000s, then it will take until April 2020 to close the jobs gap. Given a more optimistic rate of 321,000 jobs per month, which was the average monthly rate of the best year of job creation in the 1990s, the economy will reach pre-recession employment levels by December 2016.
To explore the outcomes under various job creation scenarios, you can try out our interactive jobs gap calculator by clicking here. You can also view the jobs gap chart for each state here.
Conclusion
Policymakers are currently faced with the unenviable task of simultaneously increasing employment and addressing America’s long-term budget deficits, but—at a time when the rate of government employment is at a historic low—sequestration threatens to further slow the growth of the public sector and lengthen the time it will take to close America’s jobs gap. Even when ignoring any indirect impacts, a typical policy response to the Great Recession would have led to a jobs gap that is 2.2 million jobs smaller than current gap of about 10.0 million and commensurately reduced the amount of time until the economy returns to full employment.
It is critical to achieve both employment gains and fiscal stability. The textbook approach is for government to continue to support the recovery and credibly enact deficit reduction that will not take hold until the employment crisis has been mitigated substantially. With respect to deficit reduction, The Hamilton Project recently released a collection of fifteen proposals that seek to reduce the deficit while improving efficiency and promoting broad-based economic growth. To see how these proposals could impact the long-term deficit, you can try our interactive budget calculator here. The Hamilton Project also continues to explore policies to boost employment, including a recent discussion paper on improving worker training programs.