Introduction
This Hamilton Project memo presents nine economic facts that provide relevant background context to the water crisis in the United States. Chapter 1 reviews the historical, current, and projected occurrence of drought in the United States. Chapter 2 describes the importance of water to our national economy. Chapter 3 underscores some of the economic and institutional barriers to more-efficient use of water. We examine these issues through the lens of economic policy, with the aim of providing an objective framing of America's complex relationship with water.
Read the full introduction»
A prolonged and serious drought in the American West has elevated concerns about the state of our nation's water use and supply. The United States has a large supply of water overall, but it often is not found where it is needed, when it is needed, or in a useable form. The challenge of water scarcity has both economic and political ramifications. U.S. businesses report substantial concerns over water supply. Water shortages have already strained relationships between states and among their water users: more than thirty-five states have had conflicts with neighboring states over water (Glennon 2009).
For affected local economies, especially those reliant on agriculture, drought is disastrous; scarce water can threaten the viability of agricultural production. In California alone, the drought is expected to cost 17,100 seasonal and part-time jobs in 2014 (Howitt et al. 2014). In January of this year California's governor declared a state of emergency (Brown 2014), and the state identified and offered support to seventeen water systems expected to face severe water shortages in the subsequent sixty to one hundred days (California Department of Public Health 2014). Furthermore, in response to rapidly dwindling groundwater reserves, California lawmakers passed historic legislation in September that will regulate, for the first time in the state's history, the pumping of water from underground water sources. Water is vital to many national industries besides agriculture, serving as a critical input to a range of sectors in the economy, including energy, information technology, and even retail. The water crisis is as much an economic issue as it is an environmental one, and demands focused national attention.
Water supply, including surface water found in streams, rivers, lakes, or reservoirs, as well as groundwater stored in underground aquifers, remains mostly dependent on climate patterns. In certain regions—in particular the Colorado River Basin, which supplies much of the West's water—demand has outpaced the average supply of water. Innovative solutions—such as the processes of reclaiming and desalinating water to turn low-quality water into freshwater suitable for human consumption or irrigation—account for only a minor share of America's water supply. Moreover, water supply is further challenged by increased climate variability, which directly impacts the reliability of water supply and calls into question the adequacy of our nation's water infrastructure, much of which was designed to accommodate climatic projections that are increasingly obsolete.
The demand for water is complex and varied, as water is used for an array of purposes, in very different ways. Much of the total withdrawn water—water diverted from a source, such as an aquifer, river, or ocean—is immediately returned to the source after the intended use or is reused for the same purpose, especially when it is used for cooling (e.g., in the technology industry or for power generation). A substantial fraction of withdrawn water, including a large share of water used for agriculture, is consumed—evaporated, incorporated into crops, used as drinking water, or otherwise removed from the source.1
Demand for water throughout the United States is high. In fact, the United States is one of the largest withdrawers of water per capita in the world (Food and Agriculture Organization of the United Nations 2014). The nation's high reliance on water is due in part to a substantial agricultural sector, and in part to the United States' extensive use of thermoelectric power, which withdraws a significant amount of water (although many of these plants recirculate the water for repeated use). In addition, our per capita rates of domestic use—how much water each person uses at home—are comparatively high. For example, U.S. domestic water use is ninety-eight gallons per person per day (Kenny et al. 2009), compared to thirty-seven gallons in the United Kingdom and about thirty-two gallons in Germany (Eurostat 2014). Fortunately, water conservation measures in recent years have led to continued declines in per capita domestic water use.
Many of our country's traditional supply-related solutions (e.g., building dams and reservoirs, diverting rivers, and drilling wells that pump groundwater from aquifers) are no longer viable, sustainable, or affordable, especially given the magnitude of the challenge. Reallocation of water could potentially play a crucial role in addressing the crisis, but many long-standing legal doctrines and institutional norms have severely hindered the trading of water. Water pricing tends not to be based on the cost of providing water; some observers contend that the low cost of water not only has led to elevated levels of demand, but also has hindered both conservation and investment in new technologies and infrastructure. While investment and innovation in the energy sector have soared in recent years, investments in new technology for water markets have stagnated just above zero. In sum, many of the economic mechanisms that are typically used to allocate a scarce resource—such as trading, pricing, and investment in more-efficient technology—are absent from our nation's water markets.
A founding principle of The Hamilton Project's economic strategy is that long-term prosperity is best achieved by fostering sustainable economic growth. One way to promote this goal is through efficient use of our nation's resources. Achieving pragmatic regulations that encourage more-efficient use of our nation's water, combined with robust incentives for innovation, can better position our nation's economy to handle the demands of the growing imbalance between water supply and demand. Effective, market-based solutions to the national water crisis can ultimately benefit consumers, farmers, water-dependent industries, and taxpayers. In this spirit, we offer “In Times of Drought: Nine Economic Facts about Water in the United States” to bring attention to recent trends in our nation's supply of and demand for water, and to highlight the importance of an efficient allocation of water resources for economic growth.
This document presents nine facts that provide relevant background context to the water crisis in the United States, focusing on supply and demand issues. Chapter 1 reviews the historical, current, and projected occurrence of drought in the United States. Chapter 2 describes the importance of water to our national economy. Chapter 3 underscores some of the economic and institutional barriers to more-efficient use of water. We examine these issues through the lens of economic policy, with the aim of providing an objective framing of America's complex relationship with water.
Chapter 1. The Occurrence of Drought in the United States
Although not historically unprecedented, the United States is experiencing severe drought conditions. The current drought in the United States is concentrated in the West and Southwest, regions that are vulnerable to drought and whose populations are projected to grow rapidly in the coming decades.
Fact 1. The United States is experiencing serious, but not unprecedented, drought conditions.
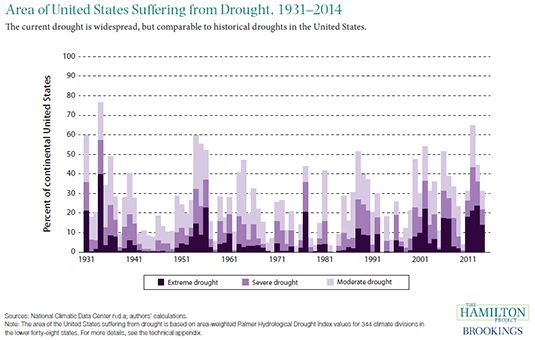
Much of the country is currently facing considerable drought conditions, with as much as 57 percent of the continental United States experiencing abnormally dry or drought conditions in 2014 (U.S. Drought Monitor 2014). Widespread droughts occur regularly in the United States, however. As illustrated in figure 1, droughts covering 40 percent or more of the country have occurred at least once in eight of the past nine decades, with some decades experiencing more than one such drought. Despite California's exceptional drought conditions, the current drought is well within the historical range of episodic droughts. The Dust Bowl drought, which struck the country in several waves during the 1930s, covered more than 70 percent of the country at its peak in 1934 (Anderson et al. 2003). Other notable droughts include the drought of the 1950s, the drought of 1987–89, and the drought of 2012 (ibid.; Smith et al. 2014).
Despite the periodic occurrence of droughts, U.S. water infrastructure remains unprepared to accommodate prolonged and widespread drought conditions. Reservoirs in California have fallen to just 59 percent of their historical averages, as more than 80 percent of the state suffers from extreme or exceptional drought (Tinker 2014; U.S. Drought Monitor 2014). Elsewhere in the American West the persistently dry conditions have brought the principal reservoirs of the Colorado River Basin—Lake Mead and Lake Powell—to some of their lowest historical levels (Tinker 2014).
Figure 1. Area of United States Suffering from Drought, 1931–2014
Fact 2. Many of America's Western states are consistently vulnerable to drought.
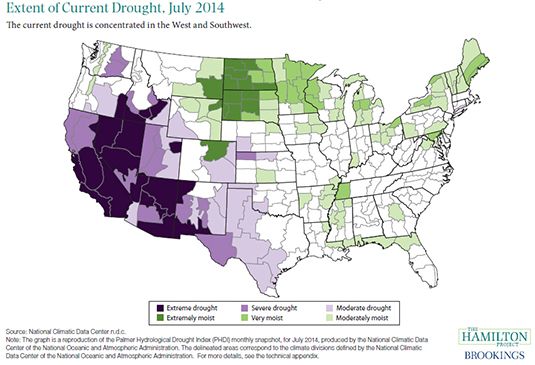
The current drought is concentrated in the arid American West, specifically in Arizona, California, and Nevada, as illustrated in figure 2. Parts of Idaho, New Mexico, Oregon, Texas, Utah, and Washington are also suffering from the current drought.
Historically, Western states have faced the greatest variability in precipitation and temperature, and thus the greatest vulnerability to drought (National Climatic Data Center n.d.a). Furthermore, these variations are expected to increase in the coming decades. Using a model that accounts for climate change, water withdrawals for economic activity, population growth, and efficiency improvements, the U.S. Department of Agriculture (USDA) projects that the larger Southwest—which includes most of the areas currently experiencing drought—will face significant water shortages in the future, and will face substantial hurdles to balancing water supply with demand (USDA 2012).
States often experience adverse economic effects during prolonged droughts. In California the current drought has hindered agricultural activity, and is expected to cost the sector approximately $2.2 billion in economic losses in 2014 (Howitt et al. 2014), a substantial share of California's approximately $25 billion farming sector (Bureau of Economic Analysis 2014). The energy sector—including oil and gas production and hydroelectric power generation—is also vulnerable to drought (U.S. Energy Information Administration 2012). In California, the drought in 2012 contributed in part to a more than one-third reduction in the state's hydroelectric-power generation relative to the previous year (California Energy Commission 2014). Droughts can also hinder other water-dependent sectors, such as tourism and recreational fishing (Martin 2014; State of California 2012). In addition, adverse impacts can be borne by governments in the form of disaster payments and lower tax revenue, and by consumers in the form of higher food and energy prices (Dreibus, Josephs, and Jargon 2014; Lawrence 2012; National Energy Technology Laboratory 2009; USDA 2014).
Figure 2. Extent of Current Drought, July 2014
Fact 3. Population growth is highest in America's driest states.
More Americans will likely live in drought conditions as the population increasingly shifts to Western states, which receive limited precipitation and are more vulnerable to drought. (Precipitation—mainly rain, sleet, snow, and hail—is a major source of water.) Five of the ten fastest-growing states between 2000 and 2010 each receive, on average, less than twenty inches of precipitation per year, as compared to a national average over the twentieth century of thirty inches (National Climatic Data Center n.d.b; National Oceanic and Atmospheric Administration [NOAA] n.d.; U.S. Census Bureau 2012). Nevada and Arizona—which grew at rates of 35 percent and 25 percent, respectively—each receive an average of less than fifteen inches of annual precipitation (NOAA n.d.; U.S. Census Bureau 2012).
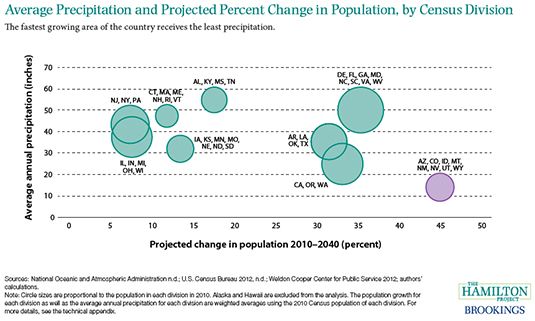
This trend is projected to continue. The driest region of the country—the Census Bureau's Mountain division, comprising Arizona, Colorado, Idaho, Montana, Nevada, New Mexico, Utah,and Wyoming—is expected to grow by approximately 45 percent between 2010 and 2040 (see figure 3). The second-driest region—California, Oregon, and Washington, in the Pacific division—is also projected to grow substantially, by 33 percent. Although high rates of population growth are also expected to occur in wetter, Southeastern states, such as Florida and Georgia, the share of the U.S. population living in states that receive less than thirty inches of average annual precipitation is expected to rise from less than 31 percent in 2000 to more than 35 percent in 2040 (NOAA n.d.; U.S. Census Bureau 2012; Weldon Cooper Center for Public Service 2012).
These population shifts suggest that Americans will increasingly live in the driest areas of the country. And since population growth affects demand for water, the population shift toward drier states will exacerbate water-related challenges and put a strain on existing water infrastructure if the growth is not met with progressively greater conservation efforts.
Figure 3. Average Precipitation and Projected Percent Change in Population, by Census Division
Chapter 2. The Importance of Water to the U.S. Economy
A vast majority of the United States' water withdrawals go to two sectors, irrigation and power generation. Water is also vital for companies in a variety of industries.
Fact 4. Half of water withdrawals in the United States are used for power generation.
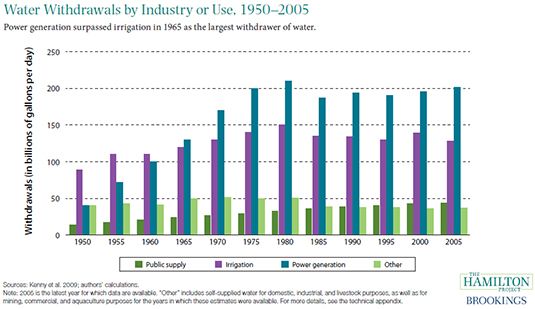
Roughly 80 percent of the nation's water withdrawals go to power generation and irrigation. Not all of this water is consumed or used up, however. Water scientists distinguish between water withdrawals (water diverted from a source, such as an aquifer, river, or ocean) and water consumption (water that evaporates, is incorporated into crops, is used as drinking water, or is otherwise removed from the source).2 Withdrawn water can be either fresh or saline, although the latter is typically employed for power generation.
In 2005, the latest year for which data are available, approximately 49 percent of total water withdrawals were used to generate power, and another 31 percent were used for irrigation. Power generation—more specifically, the generation of electricity in power plants—often requires water to operate steam-driven turbines, and water is also important for cooling in power plants (especially nuclear ones) (Kenny et al. 2009; U.S. Energy Information Administration 2014). Irrigation includes water applied to assist crop and pasture growth as well as to maintain vegetation on recreational lands such as parks and golf courses (ibid.). The share of withdrawn water that is consumed—not returned to its source—is higher for agriculture than it is for power generation, so even though withdrawals are greater for power generation, consumption is not (U.S. Department of Agriculture 2013b).
Only 11 percent of total water withdrawals went to public-supply water uses in 2005.3 The other 9 percent of total withdrawals were primarily self-supplied, used for domestic, livestock, and mining purposes, among others.
As shown in figure 4, power generation became the largest withdrawer of water in 1965 as the amount of energy generated nationwide increased. Since the mid-1970s, however, water withdrawals for power generation have stabilized even as population and the economy have grown. This stabilization is due in part to limited water availability in some areas as well as to laws such as the Clean Water Act that regulate cooling systems and mandate use of best available technology. Power plants have increasingly built cooling systems that recirculate water, as opposed to using water and then returning it to its source. Thus, although power generation withdraws more water than irrigation, much of this water is recirculated; the ratio of total water withdrawals to energy produced declined significantly between 1950 and 2005, from 63 to 23 gallons per kilowatt hour (ibid.).
Figure 4. Water Withdrawals by Industry or Use, 1950–2005
Fact 5. Eighty percent of California's freshwater withdrawals go to agriculture.
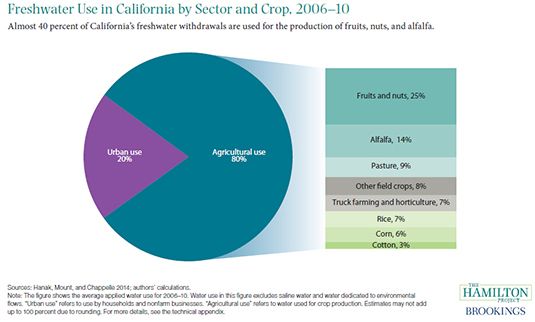
Agriculture requires large amounts of water. As our country's leading producer of food, California withdraws most of its freshwater for agricultural purposes. Approximately 80 percent of California's freshwater goes to agricultural uses, as seen in figure 5, with the remaining 20 percent going to urban uses for households and nonfarm businesses.4 The production of fruits and nuts alone uses almost one quarter of California's freshwater, and alfalfa production uses more than one eighth of the state's freshwater.
California's agriculture is critical to our national economy. Over one third of the country's vegetables and nearly two thirds of the country's fruits and nuts were produced in California in 2012 (U.S. Department of Agriculture 2013a). California is also the near-exclusive supplier of certain crops in the United States. For instance, between 94 percent and 99 percent of our country's shelled almonds, olives, broccoli, and celery were produced in California in 2012 (ibid.). California is also the country's largest agricultural exporter: in 2012 the state's agricultural exports generated more than $18 billion, 13 percent of the nation's total; among fruits, nuts, and vegetables, the exports of California alone accounted for almost three fifths of the U.S. total (U.S. Department of Agriculture 2013c).
The share of water that California uses for agriculture peaked in 1980 and has gradually declined since then (Hanak et al. 2012). However, the value of agricultural output has continued to increase as farmers have adopted more-efficient irrigation techniques and shifted toward crops that generate more value per volume of water used (ibid.). However, these improvements are not universal; for example, as a result of economic incentives, many of California's farmers continue to use tremendous amounts of water growing alfalfa during the summer when temperatures are high and both yields and quality are low (Glennon 2009). These agricultural patterns are due in part to restrictions on water trading, as well as to the relatively low water prices charged to farmers, as compared to prices charged to nonagricultural water users.
Figure 5. Freshwater Use in California by Sector and Crop, 2006–10
Fact 6. Water is a crucial input for a wide variety of American industries, not just agriculture.
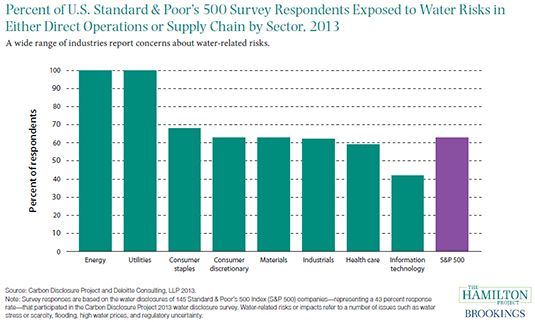
Companies in all sectors report that they are exposed to water risks such as water stress or scarcity, high water prices, and regulatory uncertainty. Respondents in a recent water-stewardship survey represented different industries, including those with obvious ties to water such as energy and utilities, as well as those for which water connections are less immediately apparent, such as the consumer discretionary sector (e.g., Starbucks and Best Buy) and the consumer staples sector (e.g., Wal-Mart and Whole Foods) (Carbon Disclosure Project and Deloitte Consulting, LLP 2013). As shown in figure 6, in each of the eight sectors at least 40 percent of respondents reported exposure to water risks in their companies' direct operations or in their supply chains.
Companies in a broad range of industries rely on water as a critical input. As an example, the technology industry heavily depends on water as a cooling mechanism because of its remarkable heat-absorbing capacity; in fact, many companies use water as a means to cool millions of computers that generate a considerable amount of heat (Glennon 2009). Similarly, water is essential for producing electricity and is thus indispensable to the energy industry. Water is necessary not only for producing power, but also for mining, refining, processing, and transporting oil, natural gas, coal, and other fuels, such as ethanol (ibid.). Fracking, also, is highly dependent on large amounts of water to extract oil and gas.
As our country becomes increasingly high-tech and requires even more energy, companies will continue to need water. For this reason, many businesses have begun implementing concrete targets or goals—such as usage reduction, efficiency improvements, or regulation compliance—focused solely on water management within their direct operations (Carbon Disclosure Project and Deloitte Consulting, LLP 2013).
Figure 6. Percent of U.S. Standard & Poor's 500 Survey Respondents Exposed to Water Risks in Either Direct Operations or Supply Chain by Sector, 2013
Chapter 3. Barriers to Efficient Uses of Water
Both domestic water use and water prices vary across the United States. Moreover, our country's systems for delivering water are highly fragmented.
Fact 7. Domestic use of water per capita is highest in the driest states.
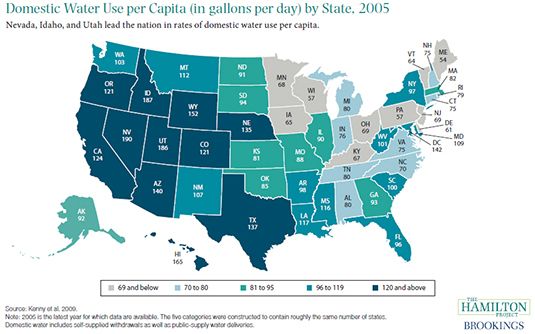
Domestic water use per capita—how much water each person uses at home—varies substantially across states. In particular, many of the states facing the most severe drought conditions also have the highest rates of domestic water use per capita.
There is considerable regional variation when it comes to total domestic water use, which includes indoor uses (e.g., drinking, flushing toilets, preparing food, showering, and washing clothes and dishes) as well as outdoor uses (e.g., watering lawns and gardens and washing cars) (Kenny et al. 2009). States with the largest populations predictably use the most water. However, as illustrated in figure 7, there is also wide regional variation in domestic water use per capita, ranging from 54 gallons per day in Maine to 190 gallons per day in Nevada, with Idaho (187 gallons) and Utah (186 gallons) right behind. Indeed, the highest rates of domestic water use per capita in the country are consistently found in the West.
Outdoor watering is the main factor driving the higher use of domestic water per capita in drier states in the West. Whereas residents in wetter states in the East can often rely on rainwater for their landscaping, the inhabitants of Western states must rely on sprinklers. As an example, Utah's high rate of domestic water use per capita is driven by the fact that its lawns and gardens require more watering due to the state's dry climate (Utah Division of Water Resources 2010). Similarly, half of California's residential water is used solely for outdoor purposes; coastal regions in that state use less water per capita than inland regions, largely because of less landscape watering (Hanak, Mount, and Chappelle 2014; Mount, Freeman, and Lund 2014). It is worth noting, however, that per capita water use in California has declined in recent decades as a result of efforts to reduce water use through pricing incentives and mandatory installation of water-saving technologies, such as restricted-flow showerheads and low-flow toilets (Mount, Freeman, and Lund 2014).
Figure 7. Domestic Water Use per Capita (in gallons per day) by State, 2005
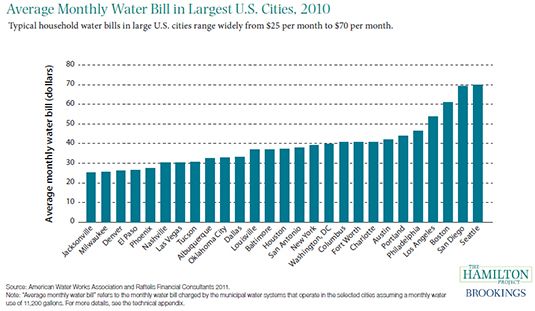
Fact 8. Household water prices vary tremendously across cities.
The price that households pay for water is highly variable across cities, even when controlling for the volume of water that different households use. Figure 9 shows average monthly water bills for households in large U.S. cities, assuming monthly consumption of 11,220 gallons, which is the typical usage for a family of four.
In Seattle, water costs $70 each month, or two and a half times the cost of water in Jacksonville or Milwaukee. Many cities in the West—such as Denver, El Paso, Phoenix, Las Vegas, Tucson, and Albuquerque, as shown in figure 8—have inexpensive water bills, but other dry cities, such as Los Angeles and San Diego, have among the highest water costs. Some of these differences are explained, in part, by provisions of the Clean Water Act that legally required certain older cities, including Boston and Seattle, to build new infrastructure—the costs of which are passed on to consumers through higher water bills (Glennon 2012). While many factors influence the price of household water, it is interesting to note that even cities in close proximity to one another may have considerably different water bills for the same volume of water. Philadelphia and Baltimore, for example, are less than one hundred miles apart, yet water systems in Philadelphia charge almost $10, or about 27 percent, more per month than water systems in Baltimore.
Many utilities also employ rate structures that change as water consumption changes. While some American cities (such as Nashville, Albuquerque, Oklahoma City, New York, Washington, DC, Portland, and Seattle) use uniform pricing structures, in which users are charged a constant rate for each gallon, many other cities (such as Phoenix, Dallas, and Los Angeles) employ increasing block rates that rise as consumption rises (American Water Works Association and Raftelis Financial Consultants 2011). Systems in some cities—such as Milwaukee, Baltimore, and Philadelphia—use decreasing block rates (where the cost of an additional gallon decreases as the total amount of water consumed increases), though this type of pricing structure is being phased out: from 1998 to 2010, the share of municipal systems using decreasing block rates fell from 35 percent to 19 percent (ibid.).
Figure 8. Average Monthly Water Bill in Largest U.S. Cities, 2010
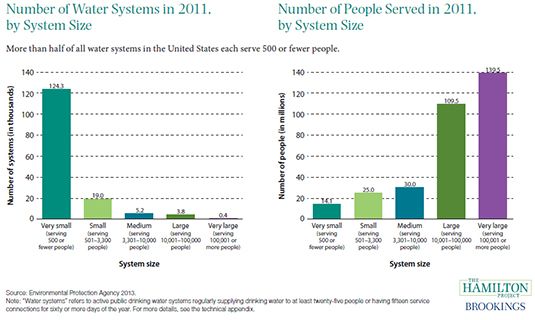
Fact 9. There are more water systems in the United States than there are schools.
The United States has a complex network of water systems designed to meet a variety of objectives. In 2011 there were more than 152,000 water systems in service across the country (Environmental Protection Agency [EPA] 2013). Indeed, our country has more water systems than it has elementary, middle, and high schools and post-secondary institutions combined (National Center for Education Statistics 2014). The severe fragmentation of the water sector not only poses a challenge to regulators, but also can inhibit the diffusion and take-up of new technologies (Matheson 2013).
Water systems vary by function. About two thirds of U.S. water systems are seasonal or do not serve the same population year-round, ranging from campgrounds and gas stations serving one hundred or fewer people, to the New York State Fair serving about 2 million Americans (EPA 2013, 2014). The remaining 50,000 or so water systems, called Community Water Systems, are in service year-round and provide water to at least twenty-five people and often far more (EPA 2013). The EPA estimated that Community Water Systems served almost 300 million people in 2011, or approximately 96 percent of the U.S. population (ibid.).
Water systems vary greatly in terms of number of customers served. For example, roughly 250 million people are served by approximately the largest 4,200 Community Water Systems. An additional 50 million people are served by roughly 50,000 smaller Community Water Systems. (As mentioned above, the remaining 100,000 water systems are seasonal or serve transient populations.) As illustrated in figure 9, the majority of water systems are very small, serving 500 or fewer people. Variation in system size presents challenges. For example, small and specialized water systems may lack the institutional capacity to raise the necessary funding for costly repairs, new equipment, and meeting EPA regulations (Cooper n.d.). Small water systems would likely benefit from new technologies: in the latest EPA report, the smallest water systems (those serving 500 or fewer people) were responsible for approximately 74,000 water quality violations (EPA 2013).
Figure 9A & 9B. Number of Water Systems in 2011, by System Size; Number of People Served in 2011, by System Size
Endnotes
- The U.S. Geological Survey (USGS) defines consumptive water use as “that part of water withdrawn that is evaporated, transpired by plants, incorporated into products or crops, consumed by humans or livestock, or otherwise removed from the immediate water environment” (USGS 2014).
- See endnote 1.
- Public-supply water refers to water withdrawn by public and private suppliers. Most of this water is delivered to customers for domestic, commercial, and industrial uses (Kenny et al. 2009). For more details, see the technical appendix in the PDF.
- These figures exclude saline water which is often used for power generation, and also exclude the share of water dedicated to environmental flows or that is lost before reaching the user.