Another good employment report today suggested that the labor market is continuing to improve. Employer payrolls increased by 227,000 in February and by an average of 245,000 over the last three months. The private sector again led the way with 233,000 new jobs and has now experienced two consecutive years of job growth. Although the unemployment rate was unchanged, new entrants to the labor market expanded the labor force and the overall share of the population working edged up.
In past months, The Hamilton Project has examined the toll the Great Recession has taken on various segments of the population through its employment analysis—looking at the plight of men, women, the young and the old. These groups have all been impacted in different ways, with young workers having been particularly hard hit and leaving the labor force in great numbers. A hallmark of each employment analysis has been an examination of the “jobs gap,” or the number of jobs that the U.S. economy needs to create in order to return to pre-recession employment rates, while also absorbing the people who enter the labor force each month.
In this month’s analysis, we examine how changing demographics will impact the composition of America’s workforce over the next several years. As the Baby Boomers retire, immigration flows change, and the number of young people entering the labor force declines, the number of new jobs needed to maintain pre-recession employment norms will decline. By breaking down these changes and accounting for labor force growth, we can better understand how long it will take for the labor market to fully recover, and what the labor force may look like in the new economy. At the end of this post, we use these labor force projections to update our calculation of the jobs gap.
When we initially began our jobs gap calculations in May 2010, we did not expect that the employment problem would persist so far into the future. We assumed that we would need 125,000 jobs per month to account for new entrants to the labor force, in line with the near-term rate of labor force expansion anticipated by the Bureau of Labor Statistics before the recession began. However, as it has become clear that the recovery will persist for at least several more years from today, a more accurate calculation of the jobs gap requires accounting for the ways in which the labor force will evolve. As a result of new adjustments to the data, we now project that, at a job creation rate of 208,000 per month (the average rate for the best year of job creation in the 2000s), it will take until 2020 to close the jobs gap.
Demographic Changes and What They Mean for America’s Labor Force
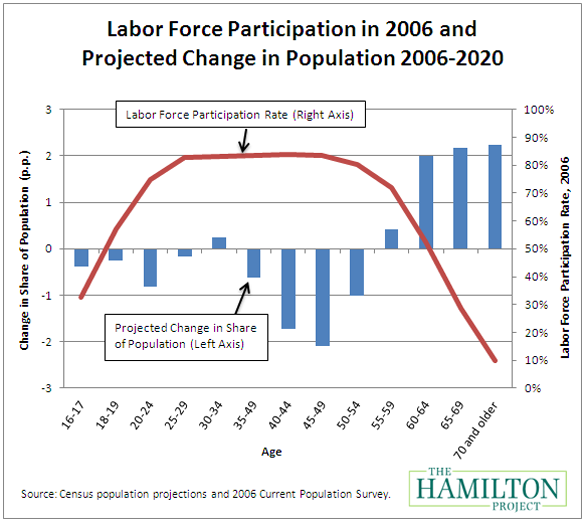
The red line in the following chart illustrates the “life cycle” of employment. Young workers and older workers tend to work less; the young are finishing high school and attending college while older workers reduce their employment during their retirement years. In between those age groups, almost all Americans ages 25-50 actively participate in the labor force. While there has been a trend of greater employment among older Americans and lower employment among younger Americans, the general pattern of labor-market participation across age groups is expected to continue into the future.
However, due to the aging of the Baby Boom generation, the number of older Americans is expected to rise. The blue bars in the chart show the change in the share of the population for each age group, indicating that the number of Americans ages 60 and older is expected to increase significantly as a share of the population by 2025. One result of this aging of the population is that overall labor force participation rates (and therefore the number of new jobs required to keep up with the labor force) are expected to decline.
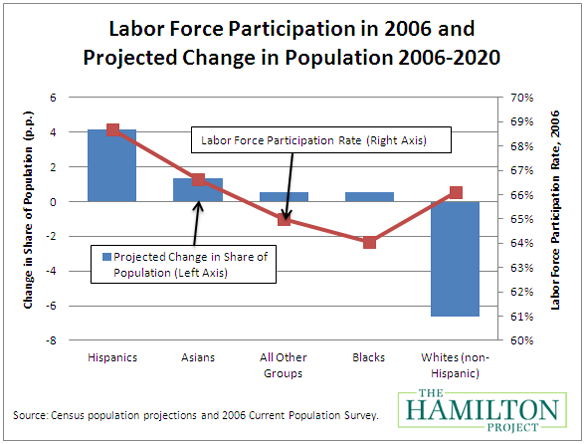
In addition, because of differences in demographic characteristics, fertility rates, and immigration, Hispanics and Asians are expected to become a larger share of the working-age population by 2020. Both of these groups exhibit particularly high labor force participation rates and so their growth will increase the economy-wide labor force participation rate. In 2006, for instance, Hispanics had a labor force participation rate of 68.7 percent, compared with 66.1 percent for non-Hispanic whites. Labor force participation rates and population projections by race and ethnicity are shown in the figure below:
Implications of Demographic Change on the “Jobs Gap”
The demographic changes described above have important implications for the size of the labor force in the future and for the number of new jobs required each month. Young people graduating from high school or college and new immigrants are entering the labor force all the time. At the same time, some current job holders leave the workforce for retirement or other reasons. Given the time frame involved, accurate measurement requires projections of population growth and trends in employment rates of younger and older workers.
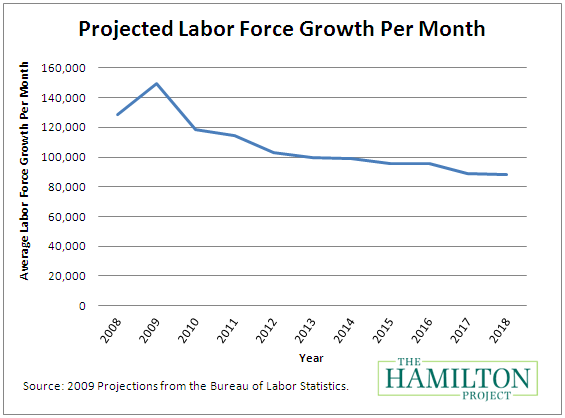
The following figure uses labor force growth projections from the Bureau of Labor Statistics to illustrate how many new entrants are expected to be looking for jobs each month. Prior to the Great Recession, demographic factors and population growth meant that the labor force was projected to increase by about 130,000 people per month. In order to maintain the November 2007 unemployment rate of 4.7 percent, over 95 percent of these new entrants would have needed to find jobs. In other words, the economy would have needed to create about 1.5 million jobs a year, or approximately 125,000 jobs per month, just to accommodate new entrants without increasing the unemployment rate. Because of changes in demographic factors, in the absence of the effects of the recession on labor force participation, the labor force growth rate was expected to decline to about 90,000 people per month by 2018.
All of these projections are based on expectations for population growth, assumptions of labor force participation rates for different demographic groups, and beliefs about what a normal labor market looks like—all of which are subject to change. For instance, the overall labor force participation rate in 2006 peaked at 66.4 percent, but in the late 1990s the labor force participation rate had reached over 67 percent. More recently, the recession resulted in sizable reductions in immigration and labor force participation rates. Why is this important? These projections depend on assumptions that may prove incorrect and such errors would naturally lead to changes in the actual labor force growth.
The February Jobs Gap
As of February, our nation faces a jobs gap of 11.4 million jobs, 5.2 million from jobs lost since 2007, and another 6.1 million jobs that should have been created in the absence of the recession.
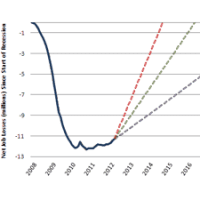
The chart below, which incorporates pre-recession assumptions about labor force growth from the Bureau of Labor Statistics, shows how the jobs gap has evolved since the start of the Great Recession in December 2007, and how long it will take to close under different assumptions for job growth. The solid line shows the net number of jobs lost since the Great Recession began. The broken lines track how long it will take to close the jobs gap under alternative assumptions about the rate of job creation going forward.

If the economy adds about 208,000 jobs per month, which was the average monthly rate for the best year of job creation in the 2000s, then it will take until February 2020—8 years—to close the jobs gap. Given a more optimistic rate of 321,000 jobs per month, which was the average monthly rate for the best year of job creation in the 1990s, the economy will reach pre-recession employment levels by April 2016—not for another four years.
Conclusion
When The Hamilton Project first began its analysis of the jobs gap in May 2010, we noted that even at a robust rate of job creation it would take many years for the jobs gap to close. Since then, however, an unusually gradual recovery has meant that the jobs gap continued to grow.
Calculating our nation’s jobs gap is complicated and based on a variety of assumptions. However, it is important for measuring progress in restoring the labor market to its pre-recession health, and it is also important for informing policy. Under even the most optimistic projections for employment growth, it will take many years to return to “normal,” which has implications for the policies that we choose to undertake today. Put another way, the jobs gap calculations suggest that even policies whose benefits take years to be realized may not come too late to help workers impacted by the Great Recession.
America’s workers will face new challenges in the new economy and must be prepared for the challenges of tomorrow’s labor market. The Hamilton Project has produced labor-related policy proposals in areas such as training, education, immigration, and innovation and will continue to contribute proposals that aim to expand opportunity and increase prosperity through broad-based growth.