Reducing chronic absence and developing conditions for learning are instrumental to improving outcomes for students and can be improved through policy reform and leadership. Schools and educators have the power to improve both student attendance and conditions for learning.
Chronic absence, which is typically defined as a student missing 10 percent or more of school for any reason, signifies that a student is missing so much school that they are academically at risk. In addition, the four school conditions for learning include physical and emotional health and safety; sense of belonging, connectedness, and support; academic challenge and engagement; and social and emotional competence for students and adults.
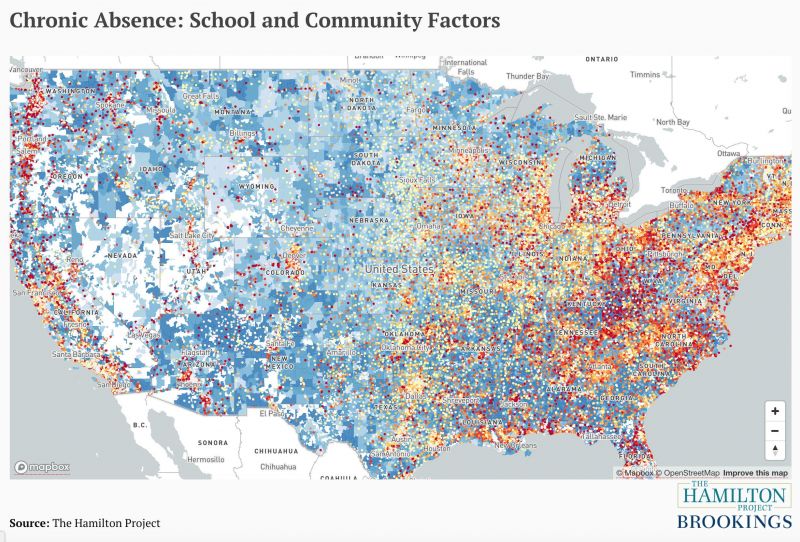
A new Hamilton Project data interactive, “Chronic Absence: School and Community Factors,” examines the factors that affect learning at local elementary, middle, and high schools across the United States. The interactive provides a range of information for every school in the nation, including:
- Student Chronic Absence (2015-16): the share of students at a school who missed more than 15 days;
- Exclusionary Discipline/Week (2015-16): the frequency of in- and out-of-school suspensions;
- English and Math Proficient (2016-17; 2017-18): the share of students who were proficient in English/Language Arts or Math by state-determined standards;
- Student: Teacher Ratio (2015-16): the ratio of students to full-time equivalent classroom teachers;
- Student: Support Staff Ratio (2015-16): the ratio of students to nurses, psychologists, social workers, and counselors; and,
- Teacher Attendance (2015-16): the share of full-time equivalent classroom teachers who were absent more than 10 days.
The interactive allows users to search by zip code or school name and click on schools to discover more information. The interactive also shows whether a school is in the top or bottom quintile of a given measure, so users can see how a school compares to others throughout the nation.
“Chronic Absence: School and Community Factors” accompanies a new paper titled, “Using Chronic Absence Data to Improve Conditions for Learning” that I co-authored with Hedy Chang and Jane Sundius of Attendance Works and David Osher and Mara Schanfield of the American Institutes for Research. In this paper, we describe how education leaders, community partners, and policymakers can address inequities and improve student outcomes by creating conducive learning environments that encourage students to come to school. The paper also details the complex relationships between community, school, and public policy factors that affect both student outcomes and the set of policies and practices to improve attendance and conditions for learning.
While national chronic absence data are increasingly accurate and widely available, the same is not true of national data on the level of physical, social, and emotional health and safety in schools or the other three conditions for learning that we have described in the report. In response, the interactive provides data points for each school that proxy these concepts, such as suspension rates and student–teacher ratios.
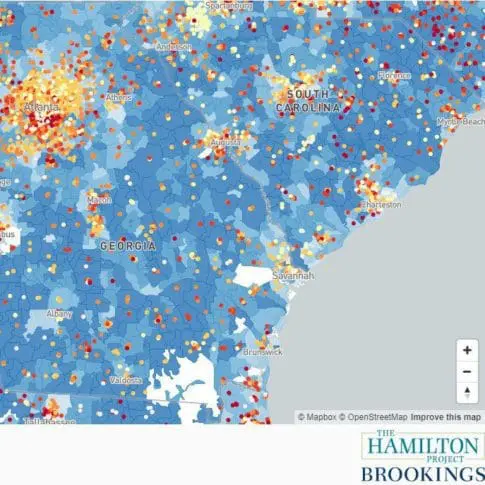
The data interactive also goes outside the school building, displaying an index of community factors that affect learning by zip code. The variables that compose the index include: the share of the adult population who are high school dropouts, the adult employment-to-population ratio, the share of children living in poverty, the share of children without health insurance, the share of children living in the same home as the previous year, household median income in the zip code, the extent of residential racial segregation, life expectancy, and average daily air quality in the county. In the interactive, light blue shading reflects more supportive community conditions (i.e. higher values of the index) and darker blue shading reflects less-supportive community conditions (i.e. lower values of the index). While the zip code in which a school is located may not fully represent a particular school’s attendance zone, where a school is situated provides context for school-level conditions for learning.
The map also shows school rates of chronic absence by grade level, from lower levels of chronic absence (yellow) to higher (red). By clicking on a school, users will see a set of proxies that reflect school conditions for learning. These proxies include the frequency of exclusionary disciplinary incidents (suspensions), student achievement as measured by proficiency in English/language arts and math, student–teacher ratio, student–support staff ratio, and the share of teachers who missed 10 or more days of school. The data for community factors are from 2013–17; for chronic absence, discipline, and teacher factors from 2015–16; and student achievement from 2016–17 or 2017–18 where available. Student achievement data from 2017-18 is italicized.
The Every Student Succeeds Act’s enactment and the decision of 36 states and Washington DC to hold schools accountable for reducing rates of chronic absence signifies the priority given to improving school attendance. The Hamilton Project has many resources for tackling chronic absence:
- Those interested in looking more closely at how rates of chronic absence vary across different student characteristics and schools can find those details in two interactives: “Chronic Absence across the United States” and “Chronic School Absenteeism in the United States.” These Hamilton Project interactive maps allow anyone to explore rates of chronic absence at the school, district, state, and national levels by student and school characteristics.
- Those interested in the relationship between chronic absence and school accountability policy can find two Hamilton Project strategy papers, “Lessons for Broadening School Accountability under the Every Student Succeeds Act” and “Reducing Chronic Absenteeism under the Every Student Succeeds Act.” These reports lay out a rationale for holding schools accountable for improving attendance and a framework for states as they oversee ESSA implementation. These papers describe the incidence of chronic absence, present analyses of factors that relate to chronic absence, and describe evidence-based strategies for schools as they work to reduce rates of chronic absence among students.
These resources jointly shine a light on the problem of chronic absence and illuminate actionable paths forward for school leaders and policymakers working toward improving school conditions for learning.
Visit the interactive map, Chronic Absence: School and Community Factors.