Editor’s note: This analysis will be updated quarterly as new data are released. It was last updated on April 30, 2026, with data through Q1 2026.
There are various ways to evaluate recent trends in real pay (nominal pay adjusted for inflation), including using different pay and inflation measures and reference periods. These factors can lead to different conclusions about trends in real pay in the United States. In October 2023, we published a detailed analysis breaking down these differences. The interactive figures in this updated piece allow you to explore changes in real pay using five different pay measures and two inflation measures, relative to a base period of your choice, relative to prior business cycle trends, and across sectors. The interactives will update each quarter as new data are released.
Select base period:
The interactives in this piece illustrate how conclusions about real pay depend on the following three factors: the pay measures, inflations measures, and reference periods used. These are described more fully in our October 2023 analysis.
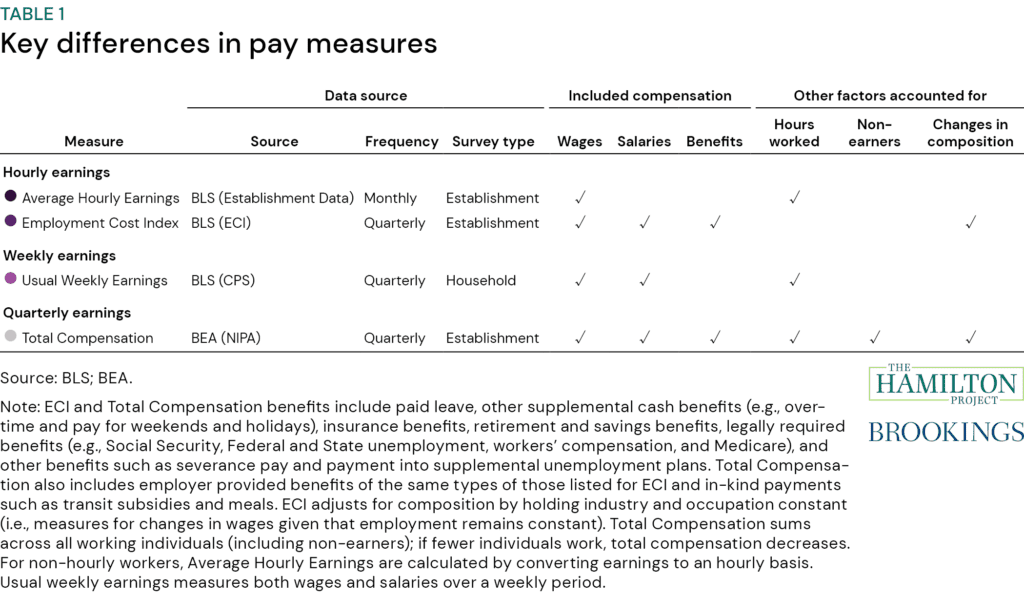
Pay measures: There are various metrics of pay for work (cash and, using some metrics, benefits) before taxes and government transfers. These interactive figures show changes in pay using the following measures: Average Hourly Earnings (AHE), the Employment Cost Index (ECI), Median Usual Weekly Earnings, and Total Compensation (compensation reported in the National Income and Product Accounts). These metrics differ in what pay they include and whether they account for hours worked or labor market composition changes, as summarized in table 1. The interactives also show changes in AHE limited to production and non-supervisory workers, roughly 80 percent of the total private nonfarm workforce, a measure that provides additional insight into pay trends for middle- and lower-income workers and allows comparison with longer-term trends (since it is available back to 1964 versus 2006 for AHE for all private workers).
Inflation measures: These interactive figures show changes in pay using two inflation measures: the Consumer Price Index (CPI) and the Personal Consumption Expenditures (PCE) index. As explained in our prior analysis, adjusting for inflation to compute real pay is essential for understanding changes in purchasing power. Both the CPI and the PCE are commonly used measures of consumer price inflation, with differences explained in our prior analysis and here.
Reference period: The choice of reference period matters significantly, particularly given the volatility in the economy during and immediately following the pandemic. These interactives allow you to select various reference periods going back to 2019, and to compare current pay to trends over past business cycles.
Comparing to recent years
The first interactive above shows the annualized percent change in real pay from the fourth quarter of each year from 2019 to 2025 through the most recent quarter with available data. For example, choosing “Q4 2019” in the dropdown will produce the annualized percent change in real pay from Q4 2019 to Q1 2026. Looking at growth over this period shows that nearly all measures of real pay have grown since Q4 2019 (the quarter before the start of the pandemic and associated recession), with stronger growth if pay measures are adjusted by PCE. The picture is more mixed if looking at growth starting in Q4 2020.
The calculator shows annualized growth in real pay between any two quarters selected, starting in Q2 2006 (the first quarter for which data are available for all pay measures) and ending in the most recent quarter. For example, the calculator computes growth in real pay since Q1 2024, showing that all real pay measures have grown since then.
Looking at just the most recent quarter (2026 Q1), most real pay measures declined. Of note, whether adjusting using PCE or CPI, AHE and AHE for production nonsupervisory workers fell for the first time since 2022. Adjusted using PCE, total compensation also fell for the first time since 2022. (Some data were not available for some months of 2025 Q4 due to the government shutdown; see the note at the end of the analysis for how we interpolated these data.)
Comparing across business cycles
Another way to investigate changes in pay is to look at how pay has changed in recent years compared to past trends.
Select pay indicator:
The second interactive figure shows pay from 2000 to present, comparing actual real pay to real pay trends over the most recent prior business cycle (2007–19). These trend rates are plotted as dashed lines, showing predicted levels of pay if this trend had been maintained. The figure shows that median usual weekly earnings and AHE limited to production and non-supervisory workers are above trend regardless of the inflation measure used, while ECI is below trend.
AHE and total compensation are currently above the prior business cycle trend if inflation is measured using the PCE but roughly on pace with trend if inflation is measured using the CPI. Notably, those longer-term trends suggest that, for all measures, pay was above trend in 2019, right before the pandemic.
Select base period:
As an additional way to compare trends over time, the third interactive figure compares growth in real pay during the current business cycle to date with growth rates in the prior three business cycles (for measures where data are available).
Comparing across sectors
In the following two interactive figures, we also explore changes in ECI and AHE across sectors. The sectors are sorted from low- to high-wage based on AHE in Q1 2026.
Select base period:
Select base period:
There is considerable heterogeneity across industries. Using AHE, all sectors saw increases in pay relative to the fourth quarter of 2019 (results are mixed using ECI). Further, the information sector has consistently seen weaker pay growth than other sectors across periods and across both ECI and AHE.
Acknowledgments: The authors are grateful to Marie Wilken for providing helpful comments and to Chloe East for her excellent work on the prior analysis which served as a foundation for this interactive. They are also grateful to Riki Matsumoto for research assistance on updating the interactive.
Editor’s note: Note that, in the Q1 2024 update, ECI reflected ECI for all civilians. Starting in Q2 2024, the figures use ECI for all private workers, consistent with the original analysis. In Q1 2025, we added Average Hourly Earnings for production and nonsupervisory workers as a pay indicator to the first three interactive figures, as well as a new interactive figure looking at past business cycles. The Q3 2025 update was delayed due to the government shutdown and subsequent lag in data releases.
The Q4 2025 update was delayed due to data delays related to the government shutdown. Additionally, due to the shutdown, data are not available for Q4 2025 median usual weekly earnings for employed full-time workers or for the October 2025 CPI. For median weekly earnings, we use an average of the Q3 2025 and Q1 2026 value for Q4 2025. For the CPI, we assume equal percentage growth in October and November of 2025.