Data
THP visualizes economic issues through figures and data interactives.
Interactive
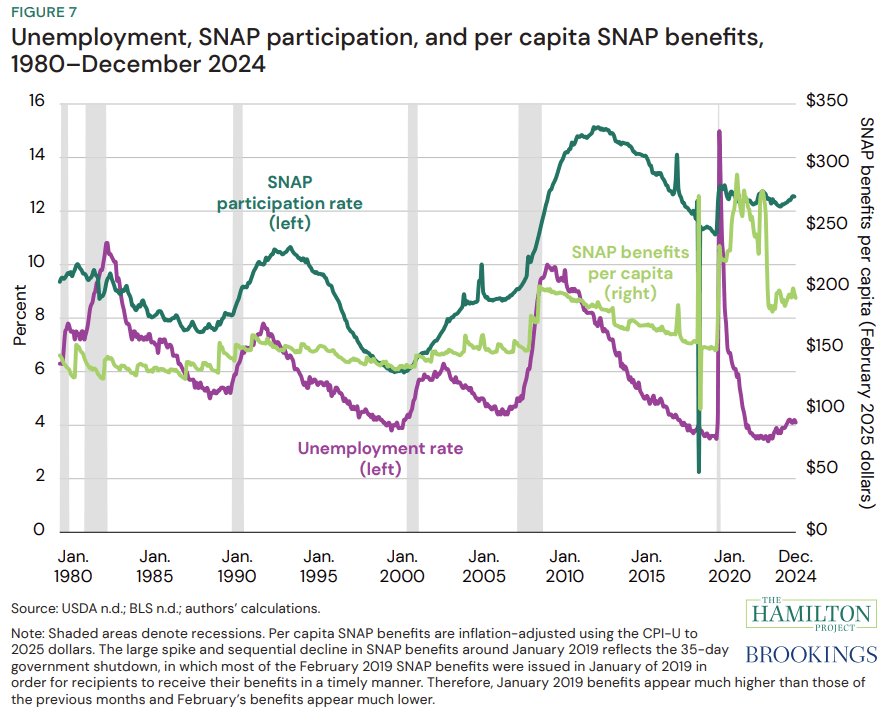
Tracking federal outlays to the Supplemental Nutrition Assistance Program (SNAP)
The figures on this page visualize federal outlays to SNAP for November 2025, with comparisons to prior months and prior years.
Interactive
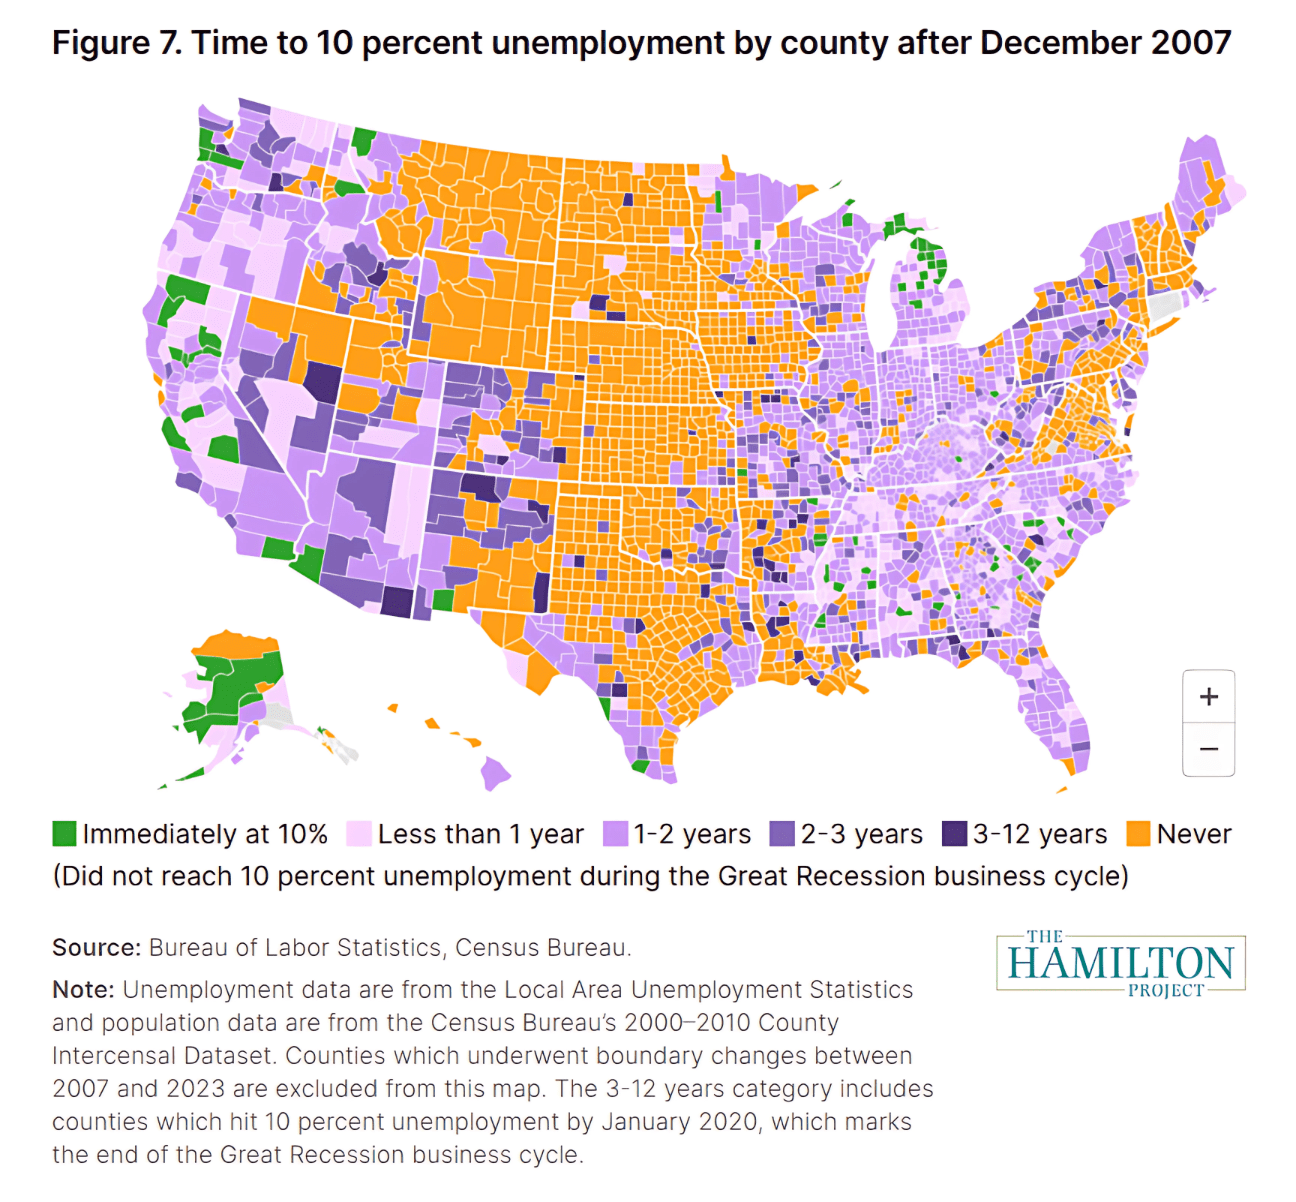
Assessing SNAP work requirement waiver policies by applying OBBBA rules to the Great Recession
This interactive allows users to see how areas would have been affected under the One Big Beautiful Bill Act's SNAP waiver rules.
Interactive
SNAP payment error rates by state, FY 2003–24
This data interactive shows SNAP payment error rates for the U.S. and for each state from fiscal year 2003 through fiscal year 2024.
Interactive
Assessing SNAP work requirement waiver policies
This interactive allows users to see how areas would have been affected under the proposed SNAP waiver rules.
Featured Figures
Explore data from our publications

