Skip to Main Content
The Hamilton Project
  • Newsletter Signup
  • News and Commentary
  • Brookings
  • Topics
    • Economic Security & Inequality
    • Education
    • Effective Government
    • Employment & Wages
    • Energy & Climate
    • Health Care
    • Healthy Economy
    • Housing & Infrastructure
    • Immigration
    • Recessions
    • Social Insurance
    • Tax Policy & Budget
    • Technology & Innovation
  • Publications
  • Data
  • Events
  • About
    • Mission and Vision
    • Advisory Council
    • Staff
    • Careers
    • Contact Us
  • Search

Data

THP visualizes economic issues through figures and data interactives.
Interactive

Tracking trade amid uncertain and changing tariff policies

Monitor the effects of tariff policies on trade with this interactive tracker showing total merchandise, duties, and price inflation by industry and country.
Effective Government Healthy Economy Tax Policy & Budget
Interactive

Tracking federal expenditures in real time

Track federal expenditures and filter by department, program, and more. Data are updated daily.
Effective Government
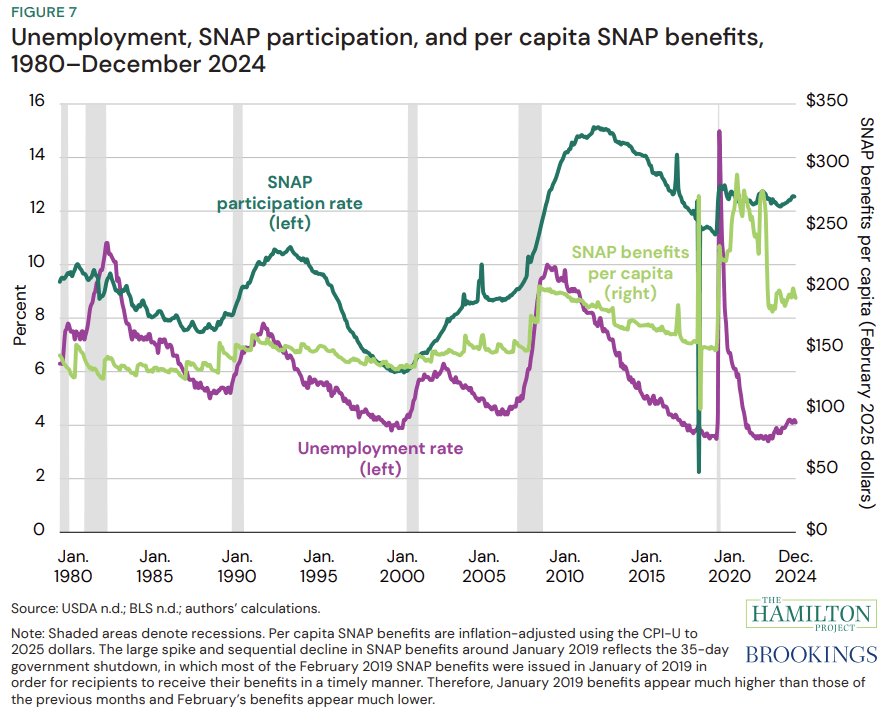
Figure showing Unemployment, SNAP participation, and per capita SNAP benefits, 1980–December 2024

"A primer on SNAP work requirements"

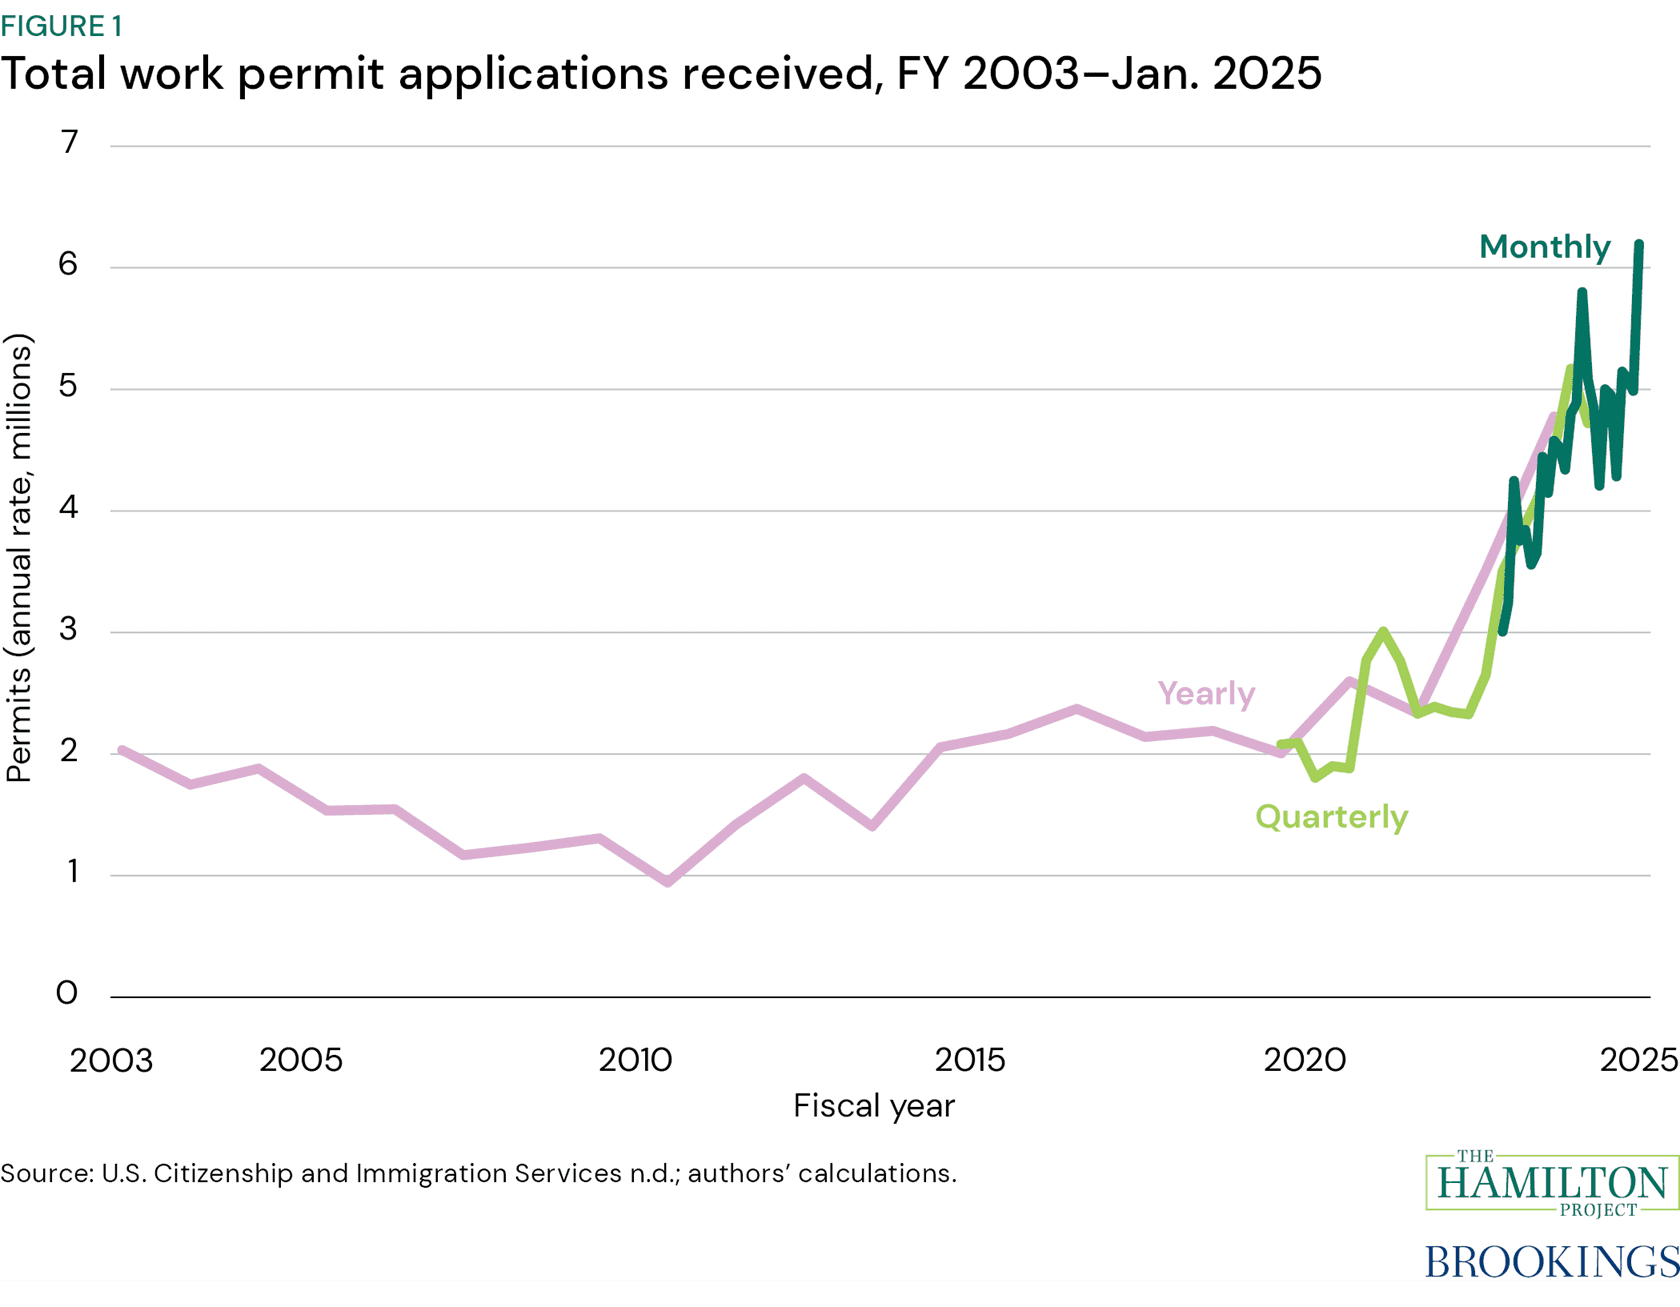
Figure 1: Total work permit applications received, FY 2003 to January 2025

"Work permit applications suggest prior immigration is still pushing up labor supply—for now"

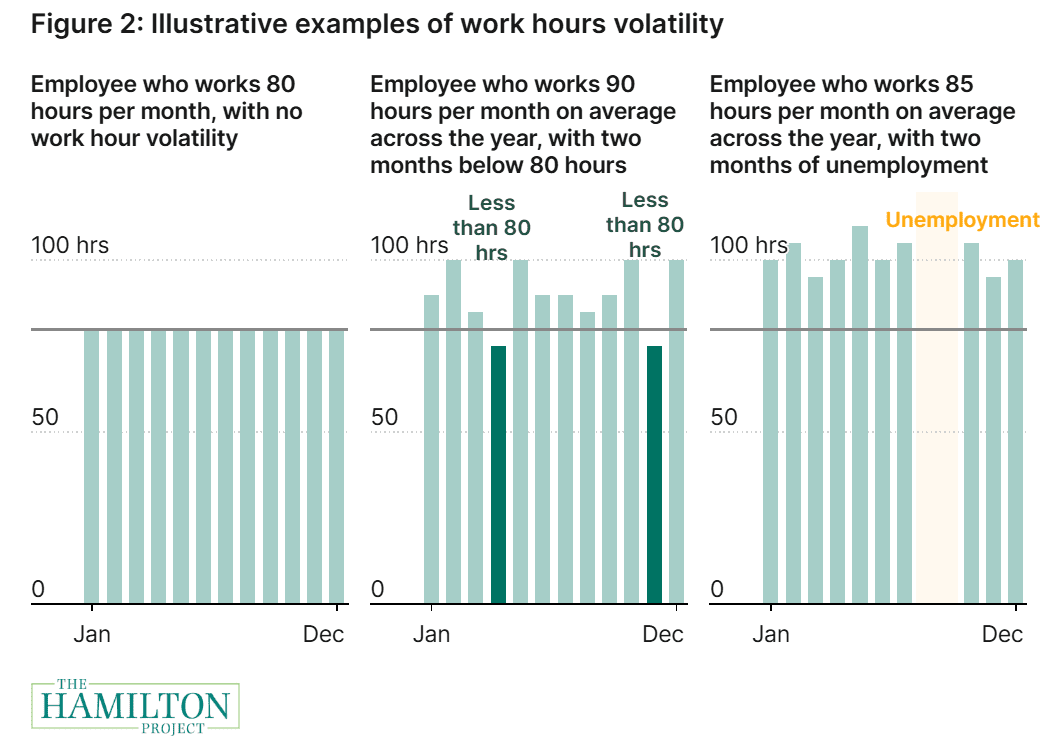
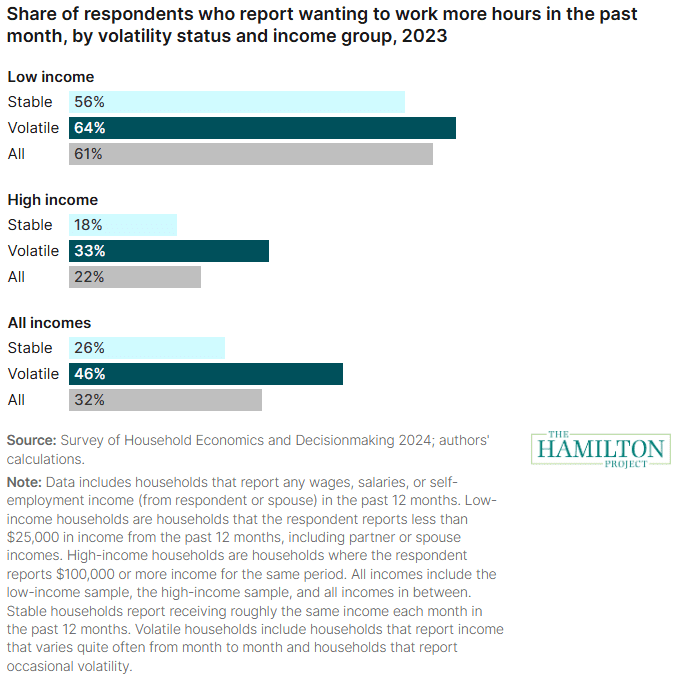
"Low-income workers experience—by far—the most earnings and work hours instability"

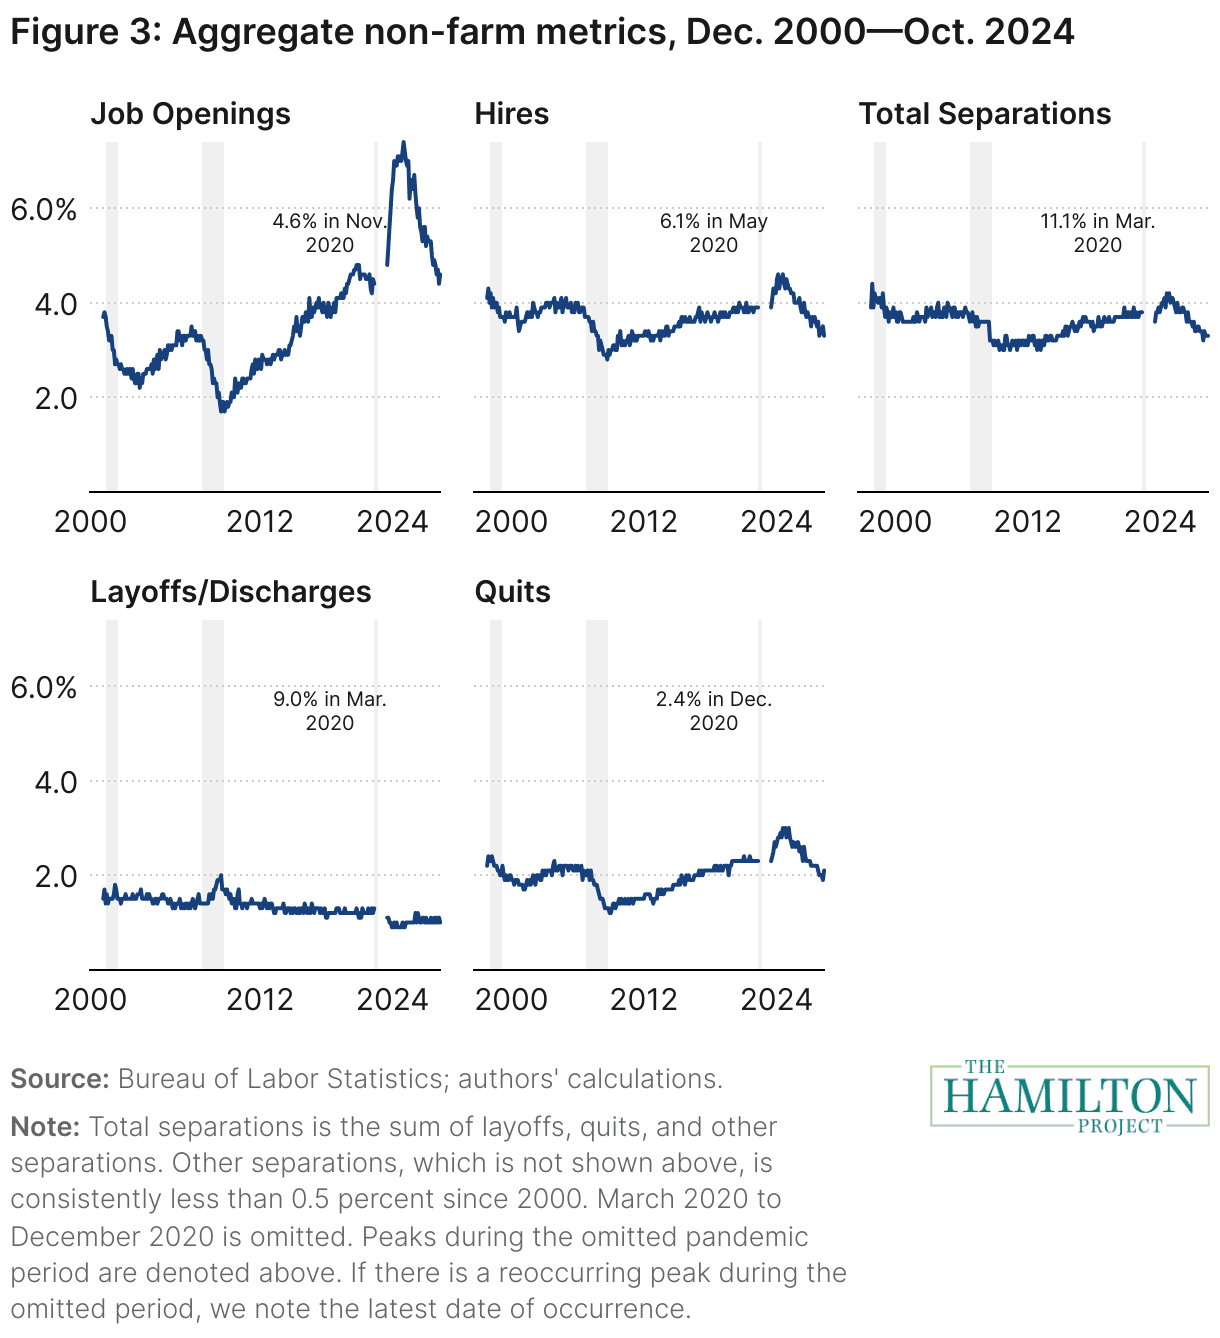
Figure 3: Aggregate non-farm metrics, from "The softening labor market is still growing"

"The softening labor market is still growing"

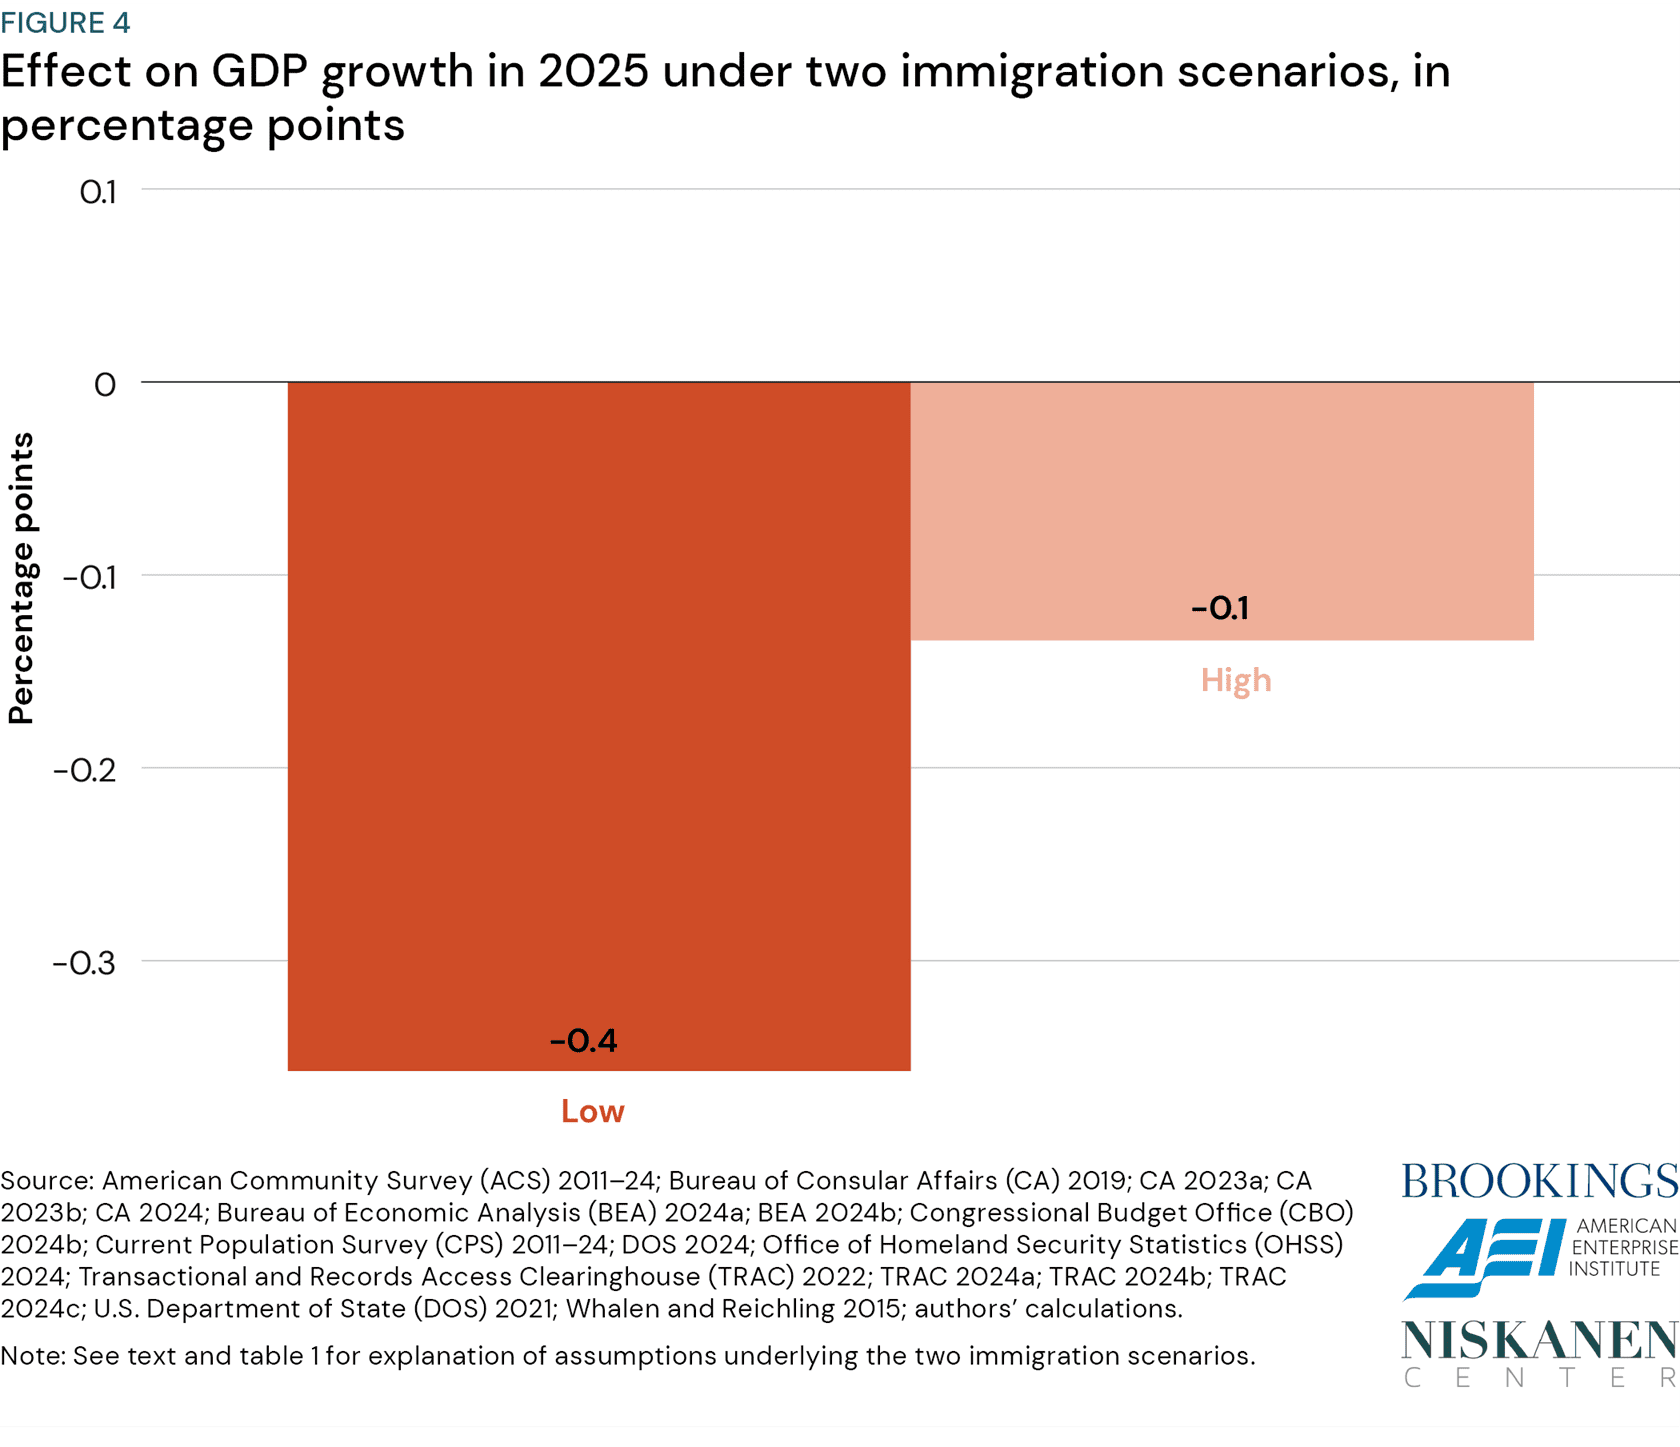
Figure 4: Effect on GDP growth in 2025 under two immigration scenarios, in percentage points, from "Immigration and the macroeconomy in the second Trump administration"

"Immigration and the macroeconomy in the second Trump administration"

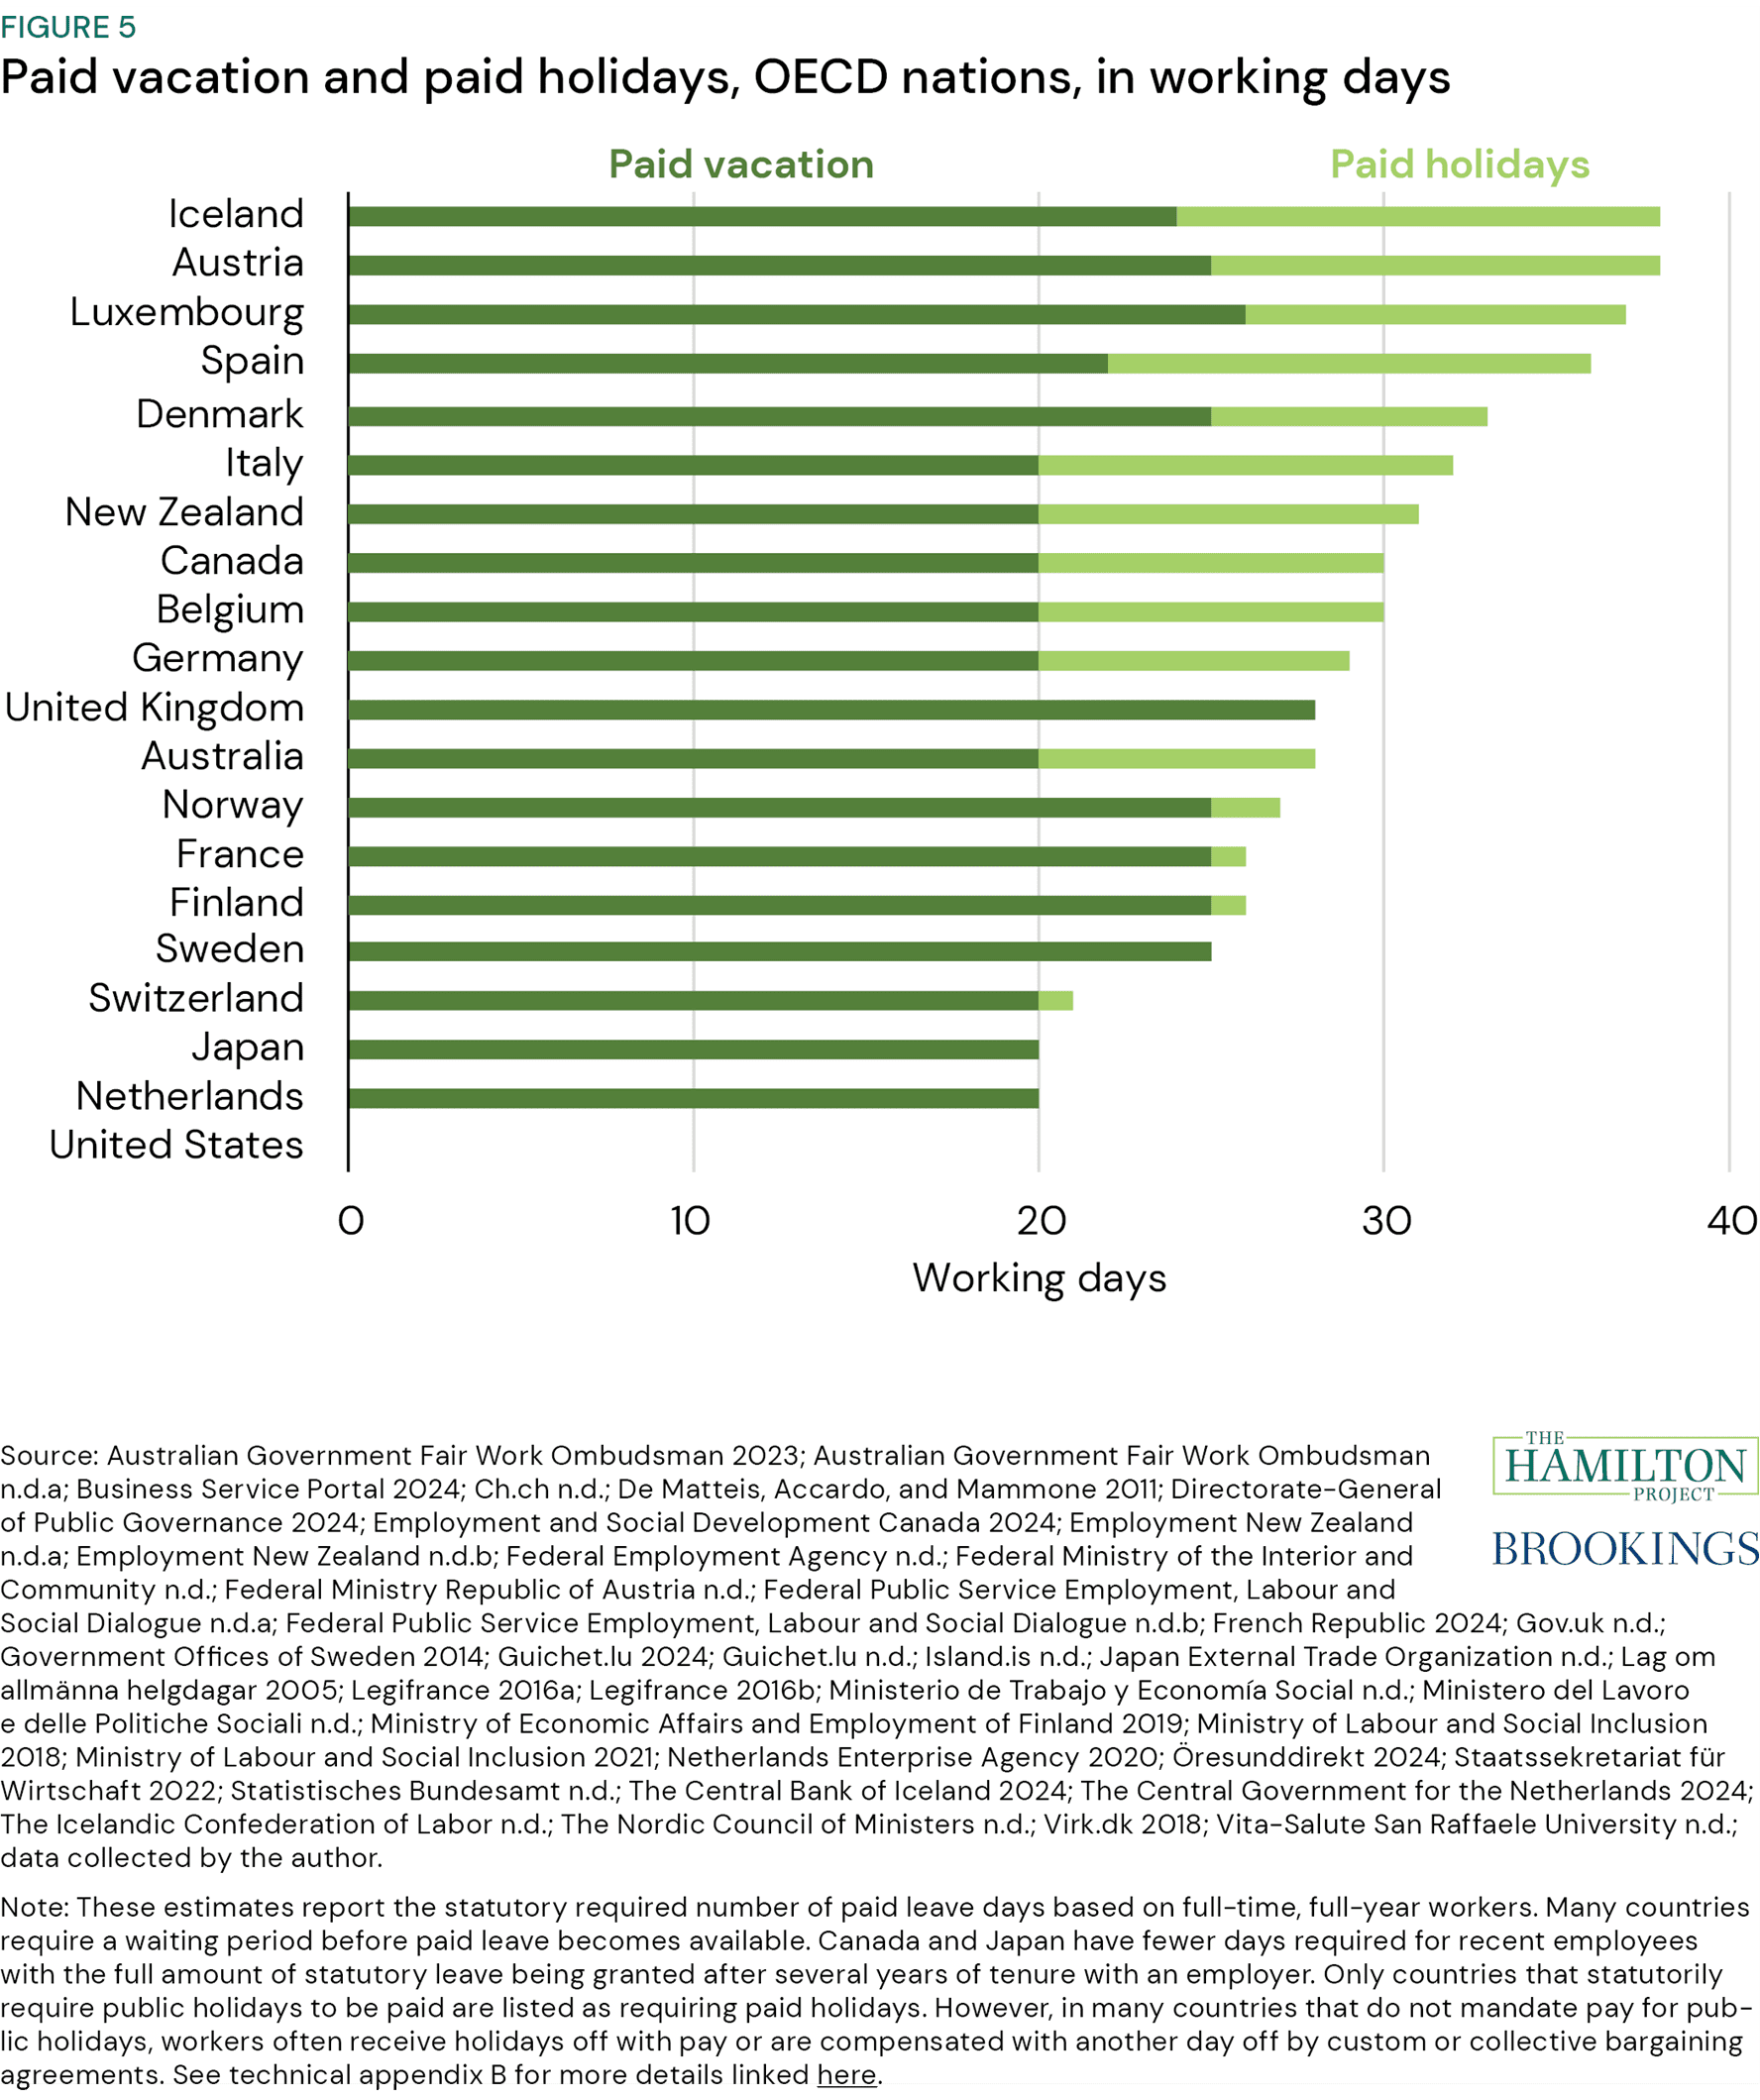
Figure 5: Paid vacation and paid holidays, OECD nations, in working days, from "A federal guarantee for earned paid time off"

"A federal guarantee for earned paid time off"

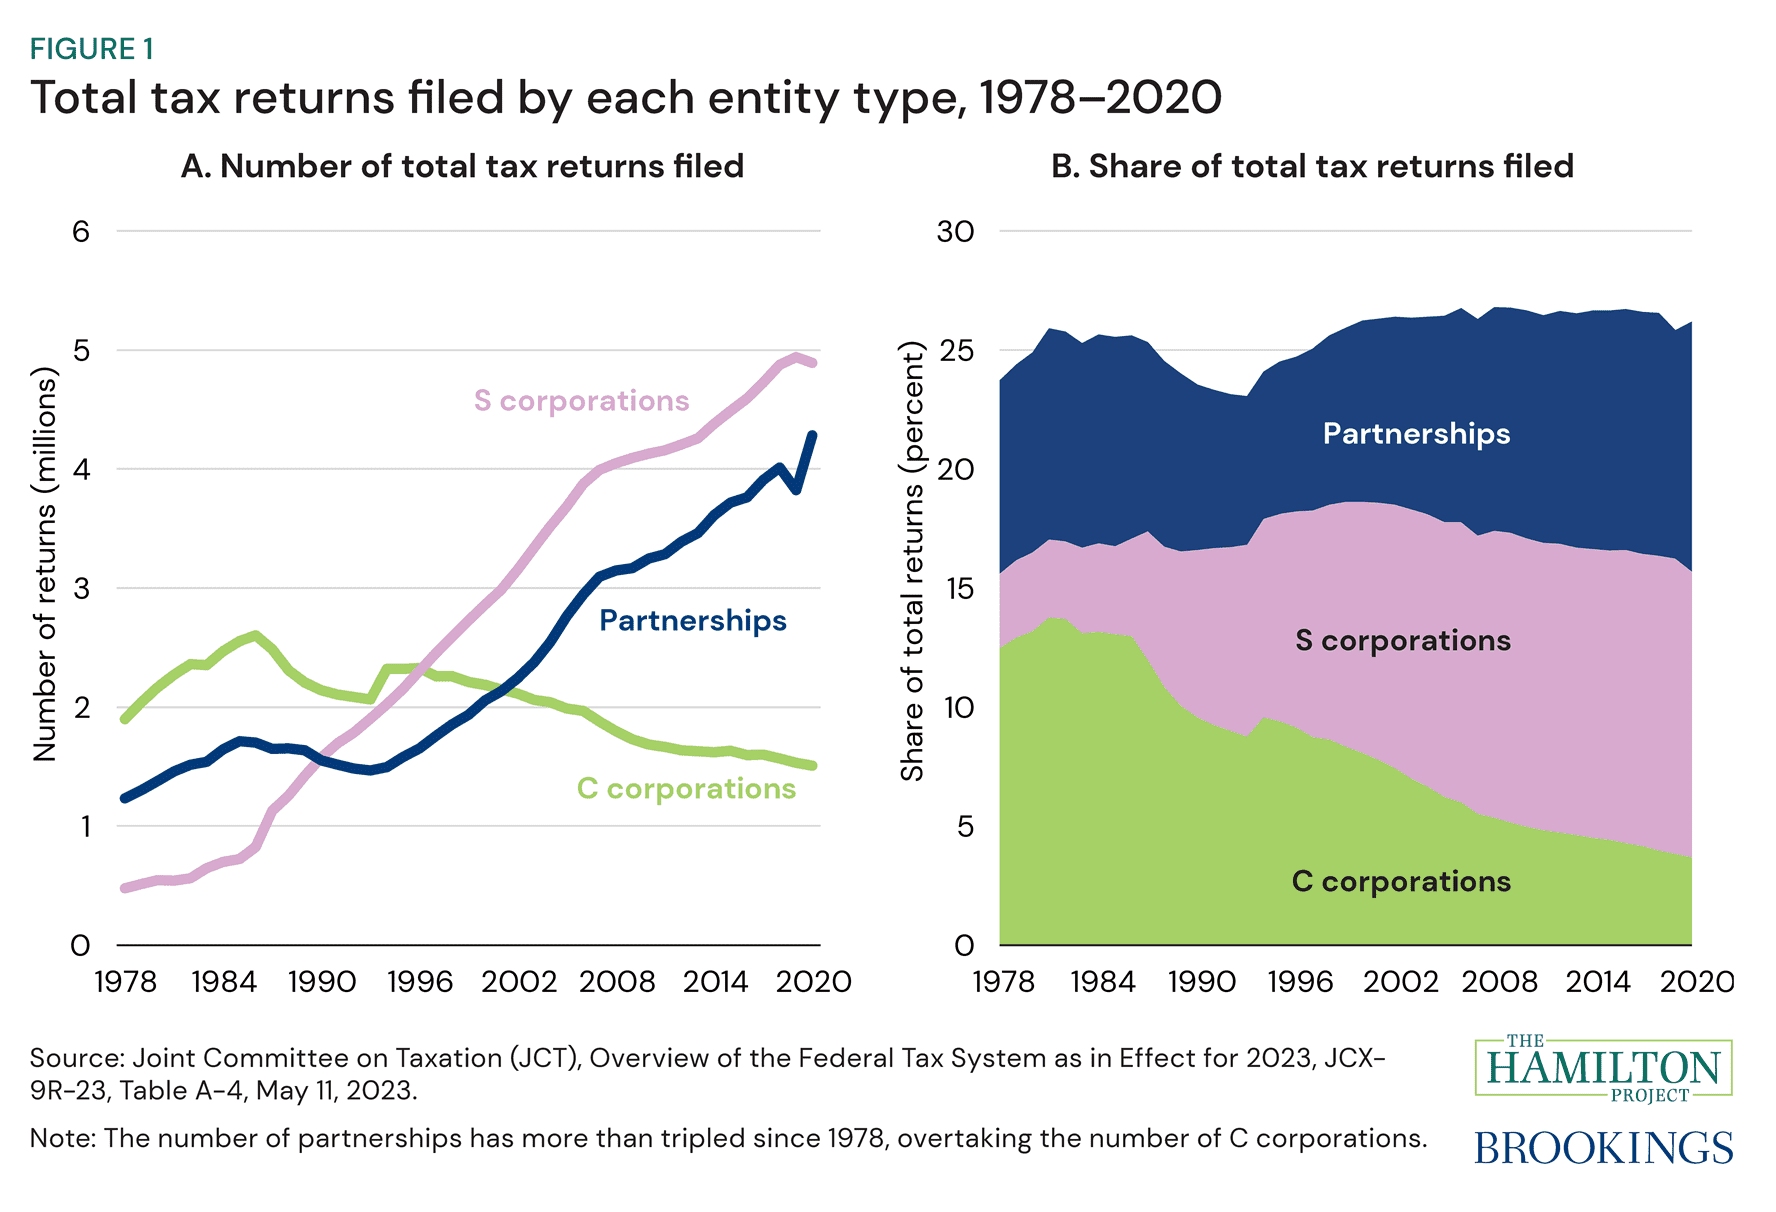
Figure 1: Total tax returns filed by each entity type, from "Modernizing partnership taxation"

"Modernizing partnership taxation"

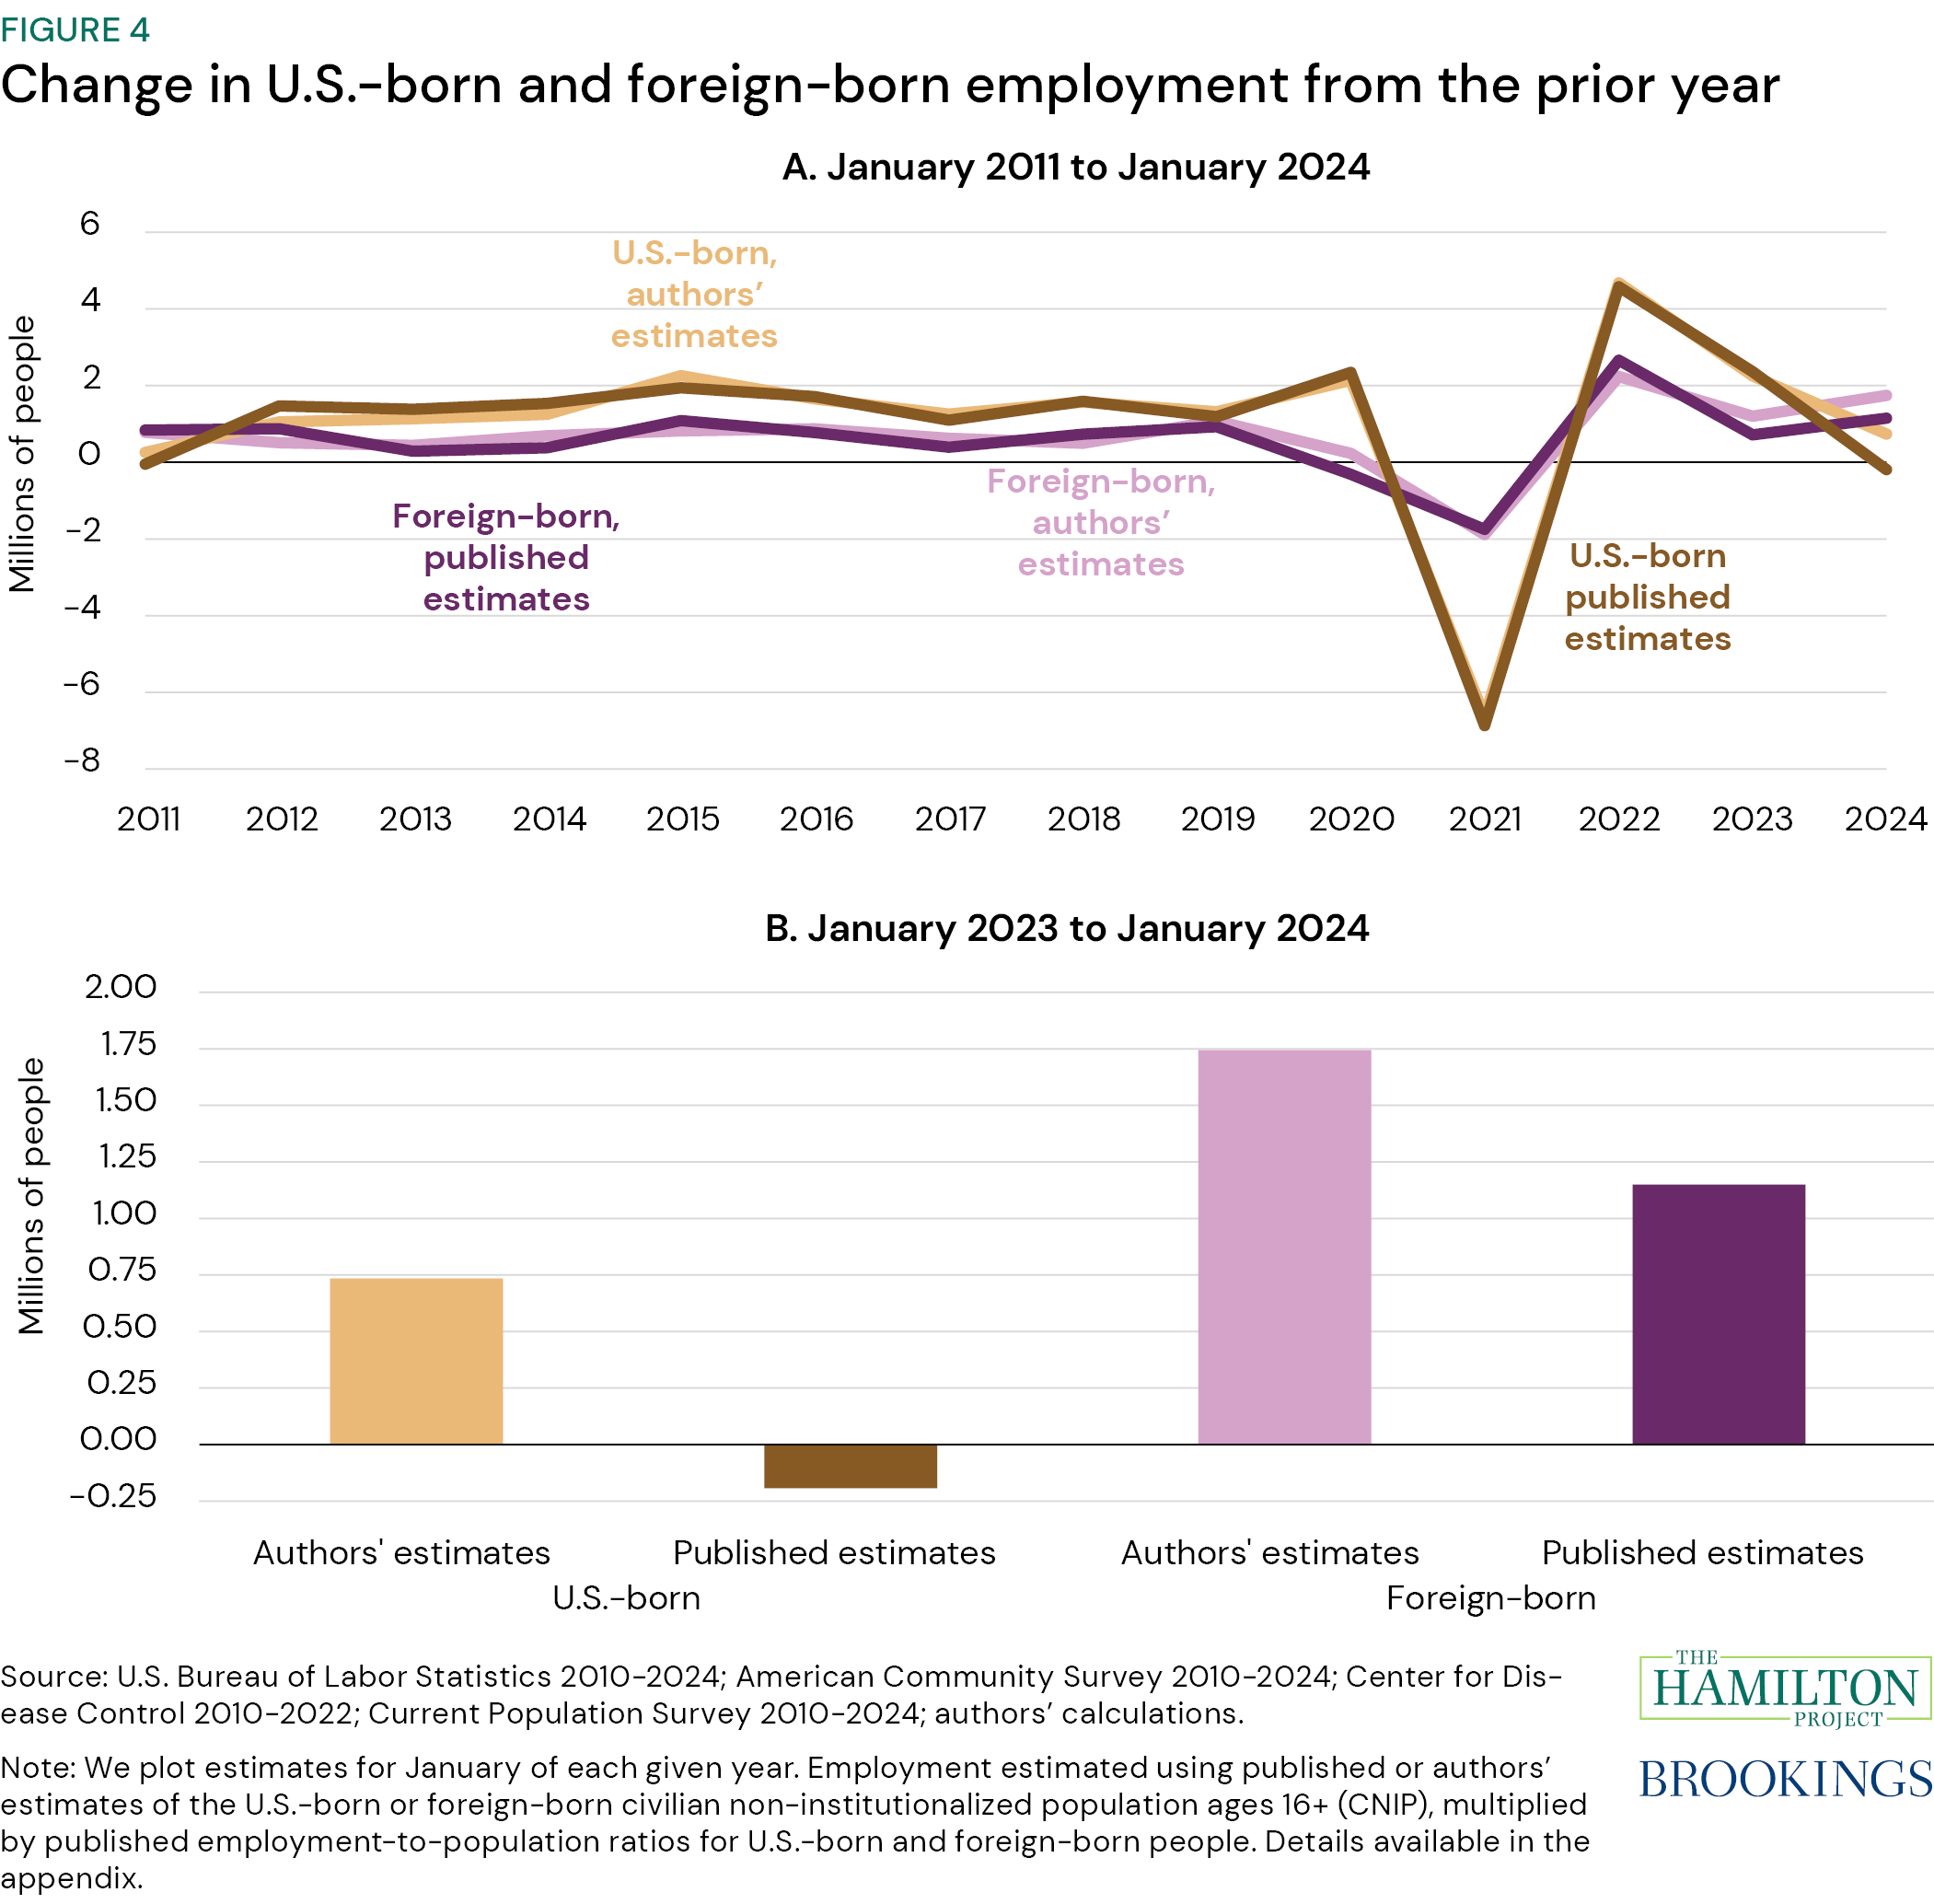
Figure 4: Change in US-born and foreign-born employment from the prior year, from "The strong labor market has boosted US-born employment"

"The strong labor market has boosted US-born employment"

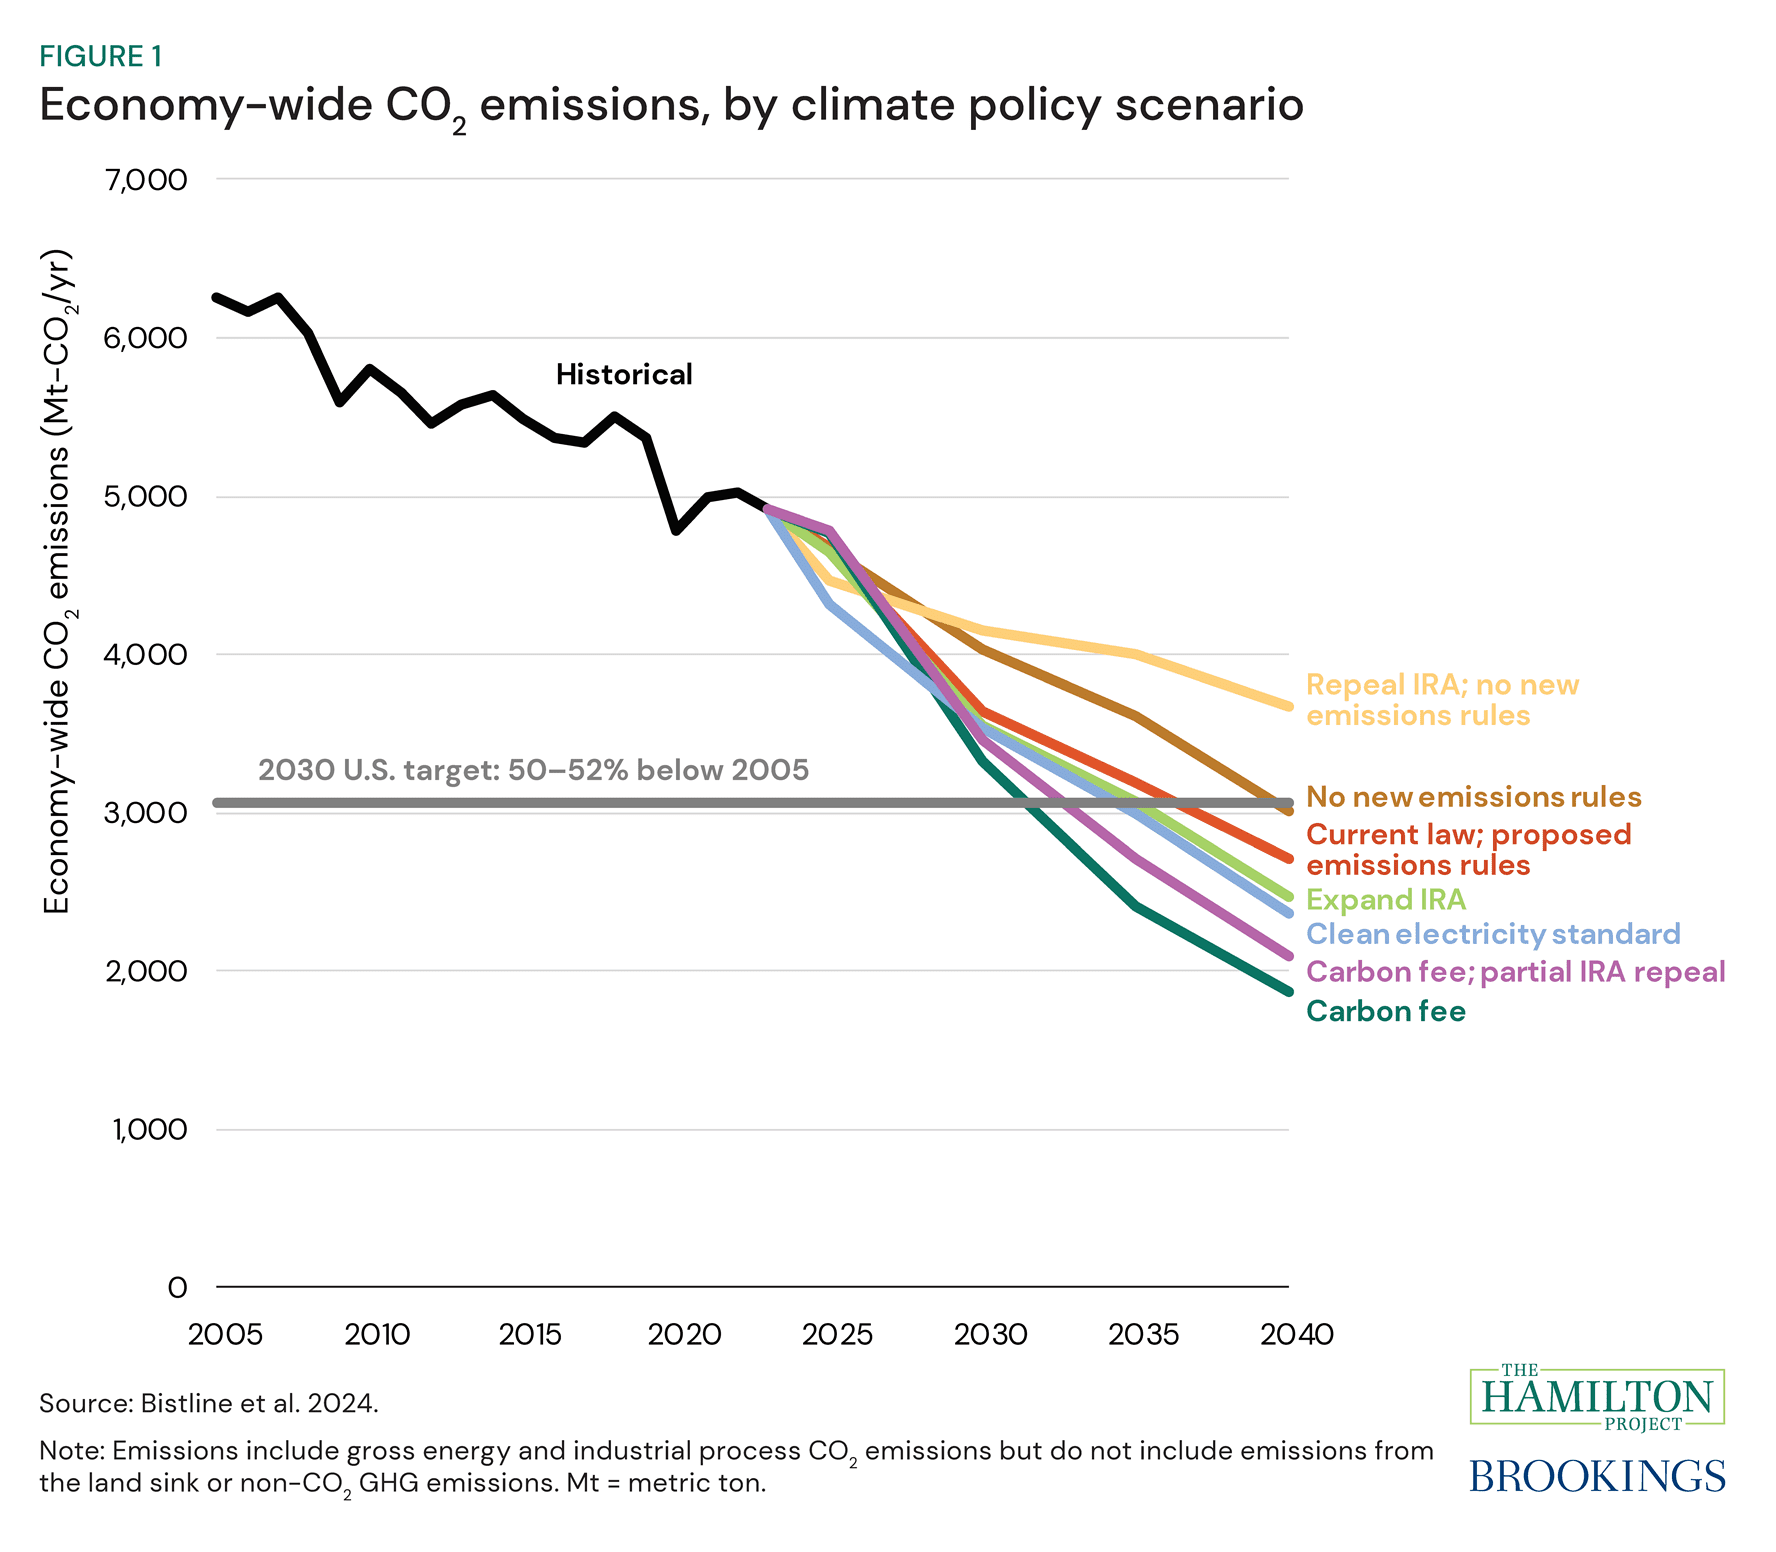
Figure 1: Economy-wide carbon dioxide emissions, by climate policy scenario, from "Climate tax policy reform options in 2025"

"Climate tax policy reform options in 2025"

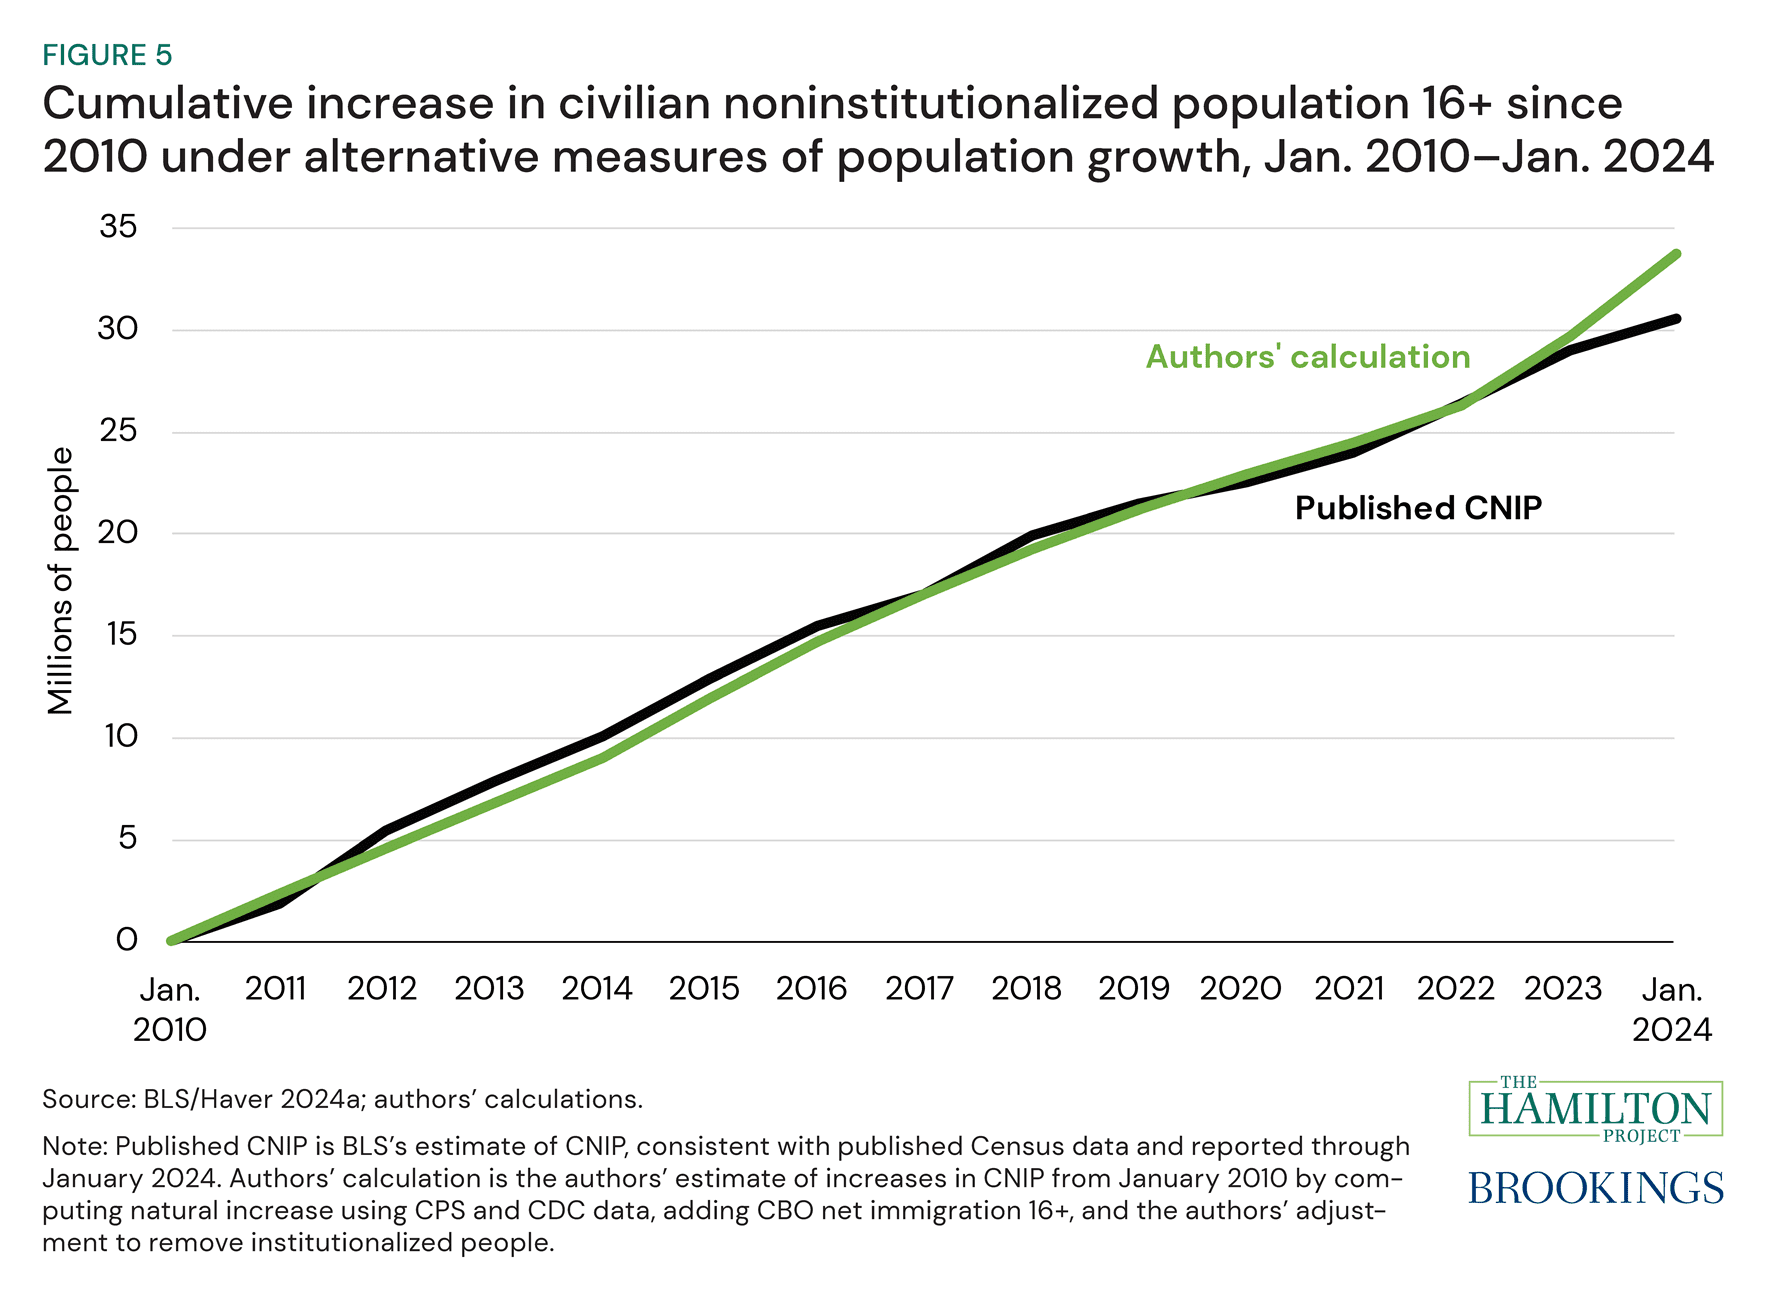
Figure 5: Cumulative increase in civilian noninstitutionalized population 16+ since 2010 under alternative measures of population growth, from "New immigration estimates help make sense of the pace of employment"

"New immigration estimates help make sense of the pace of employment"

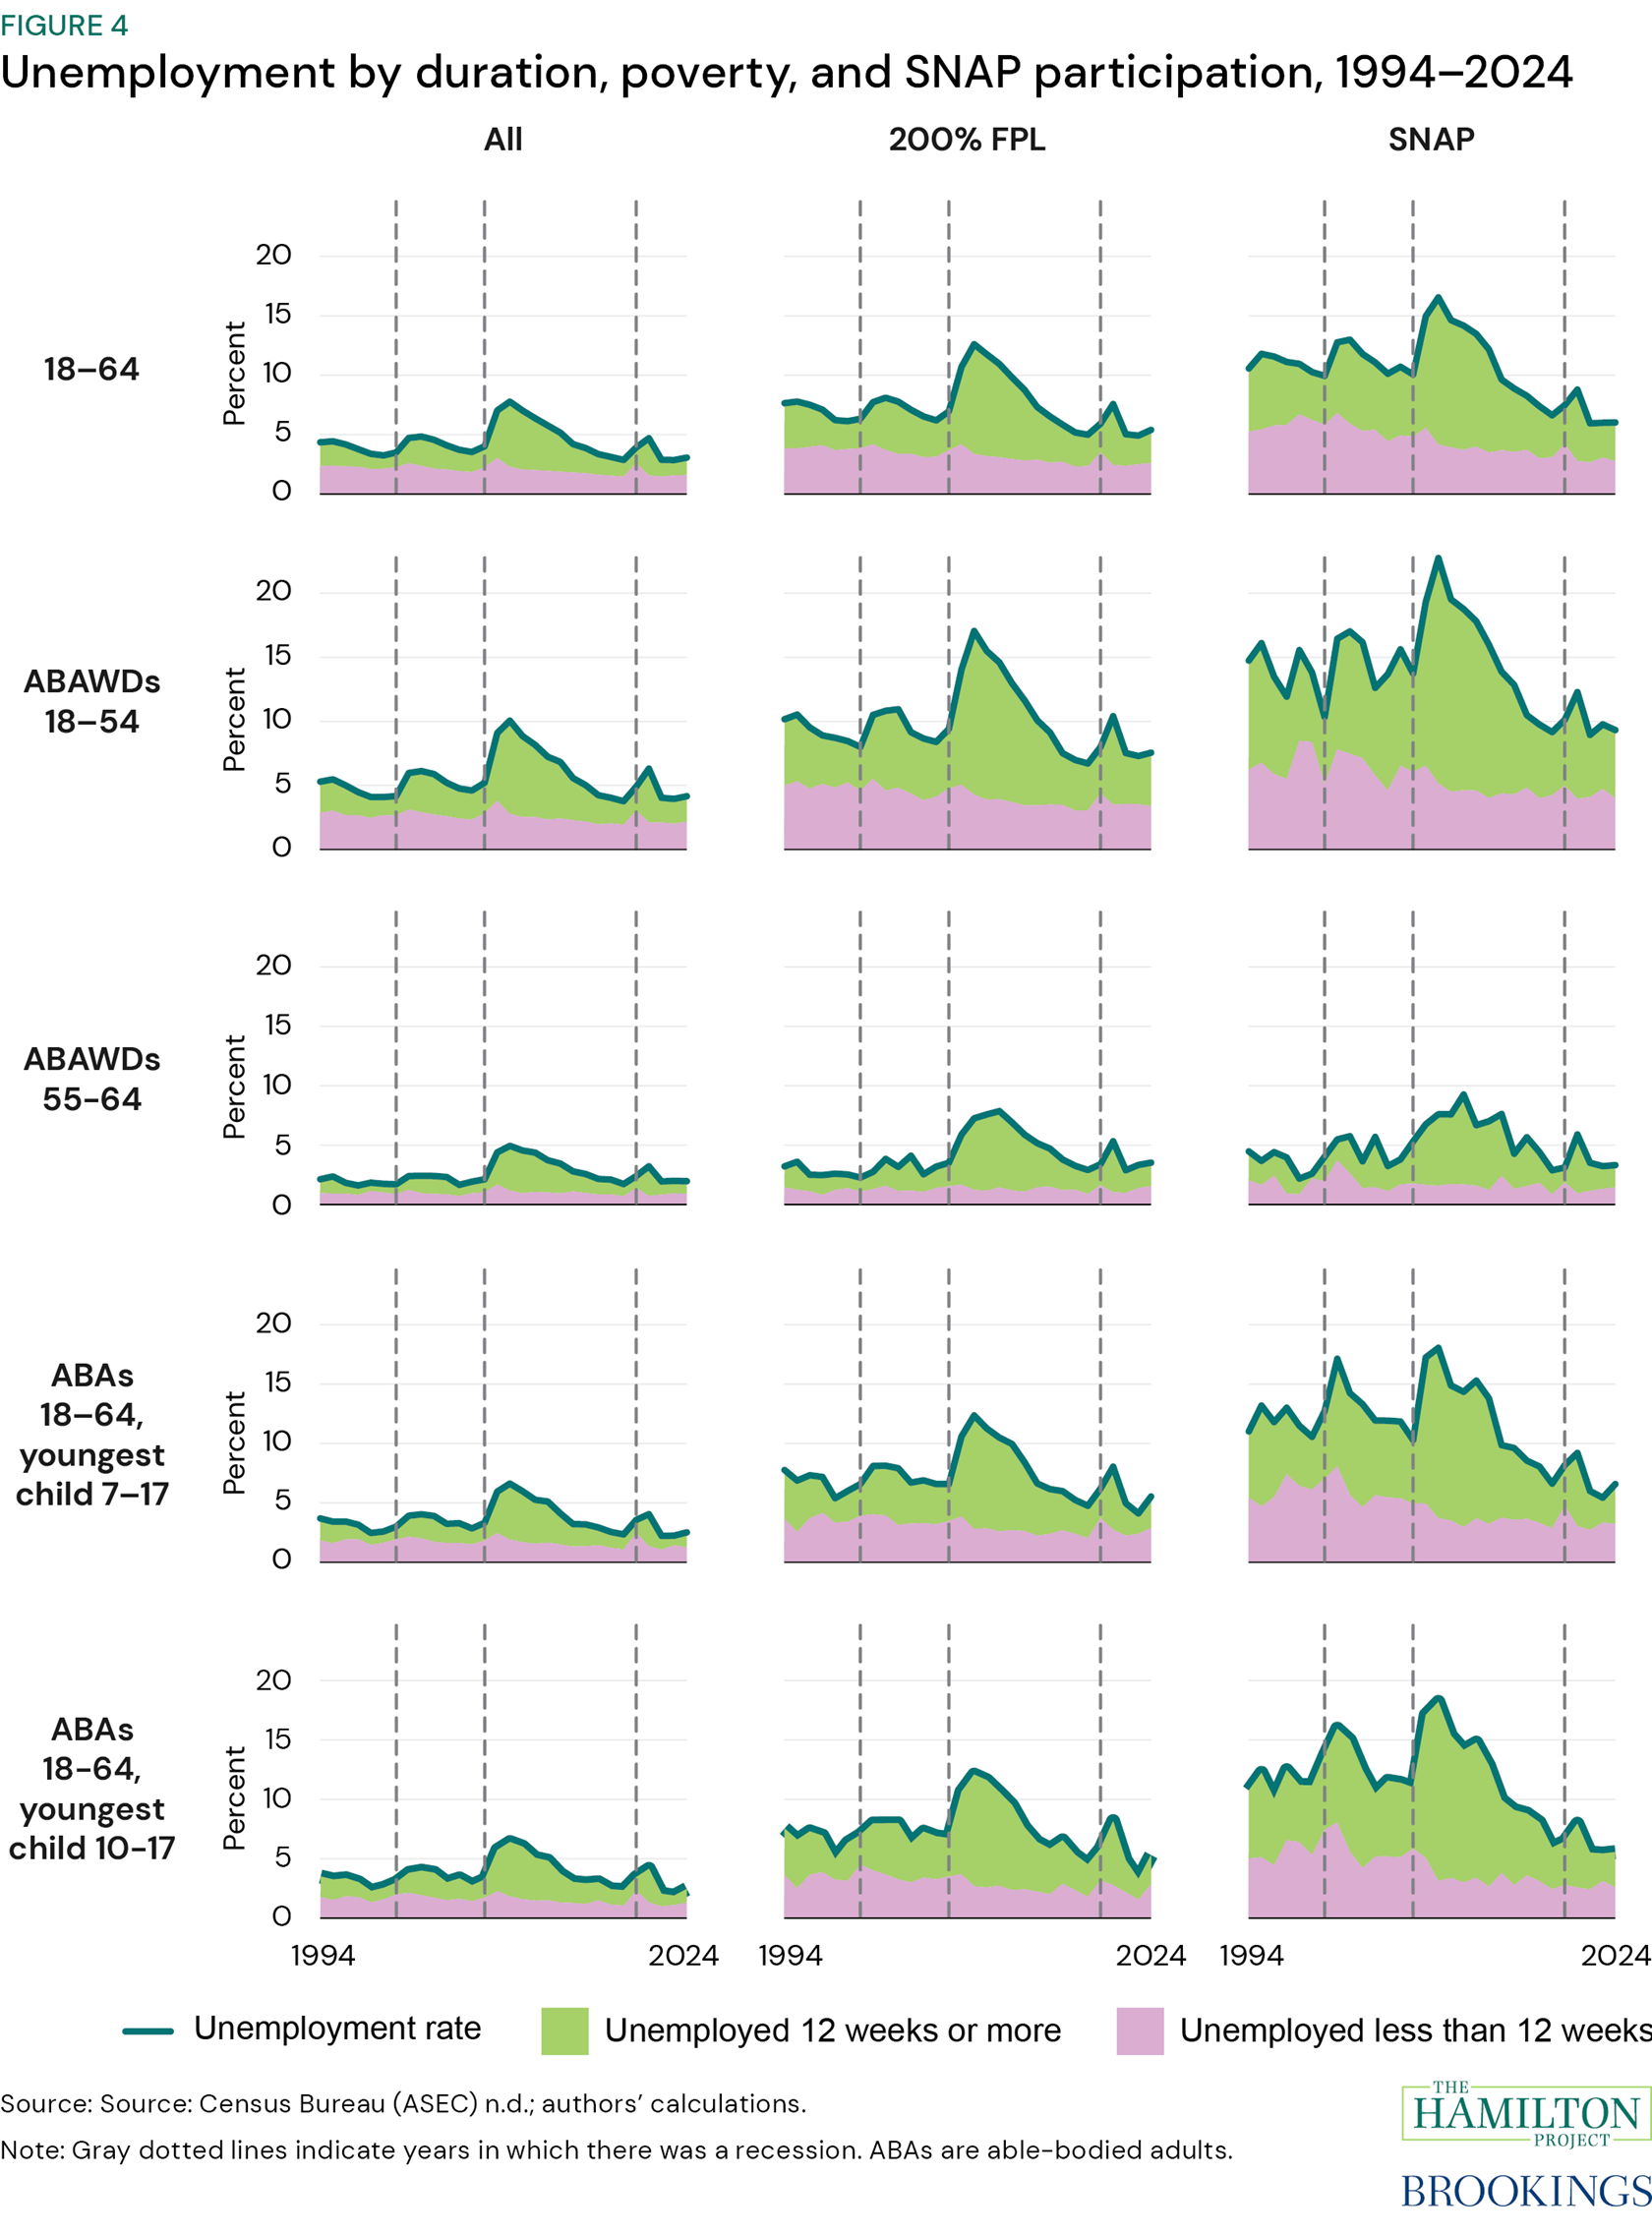
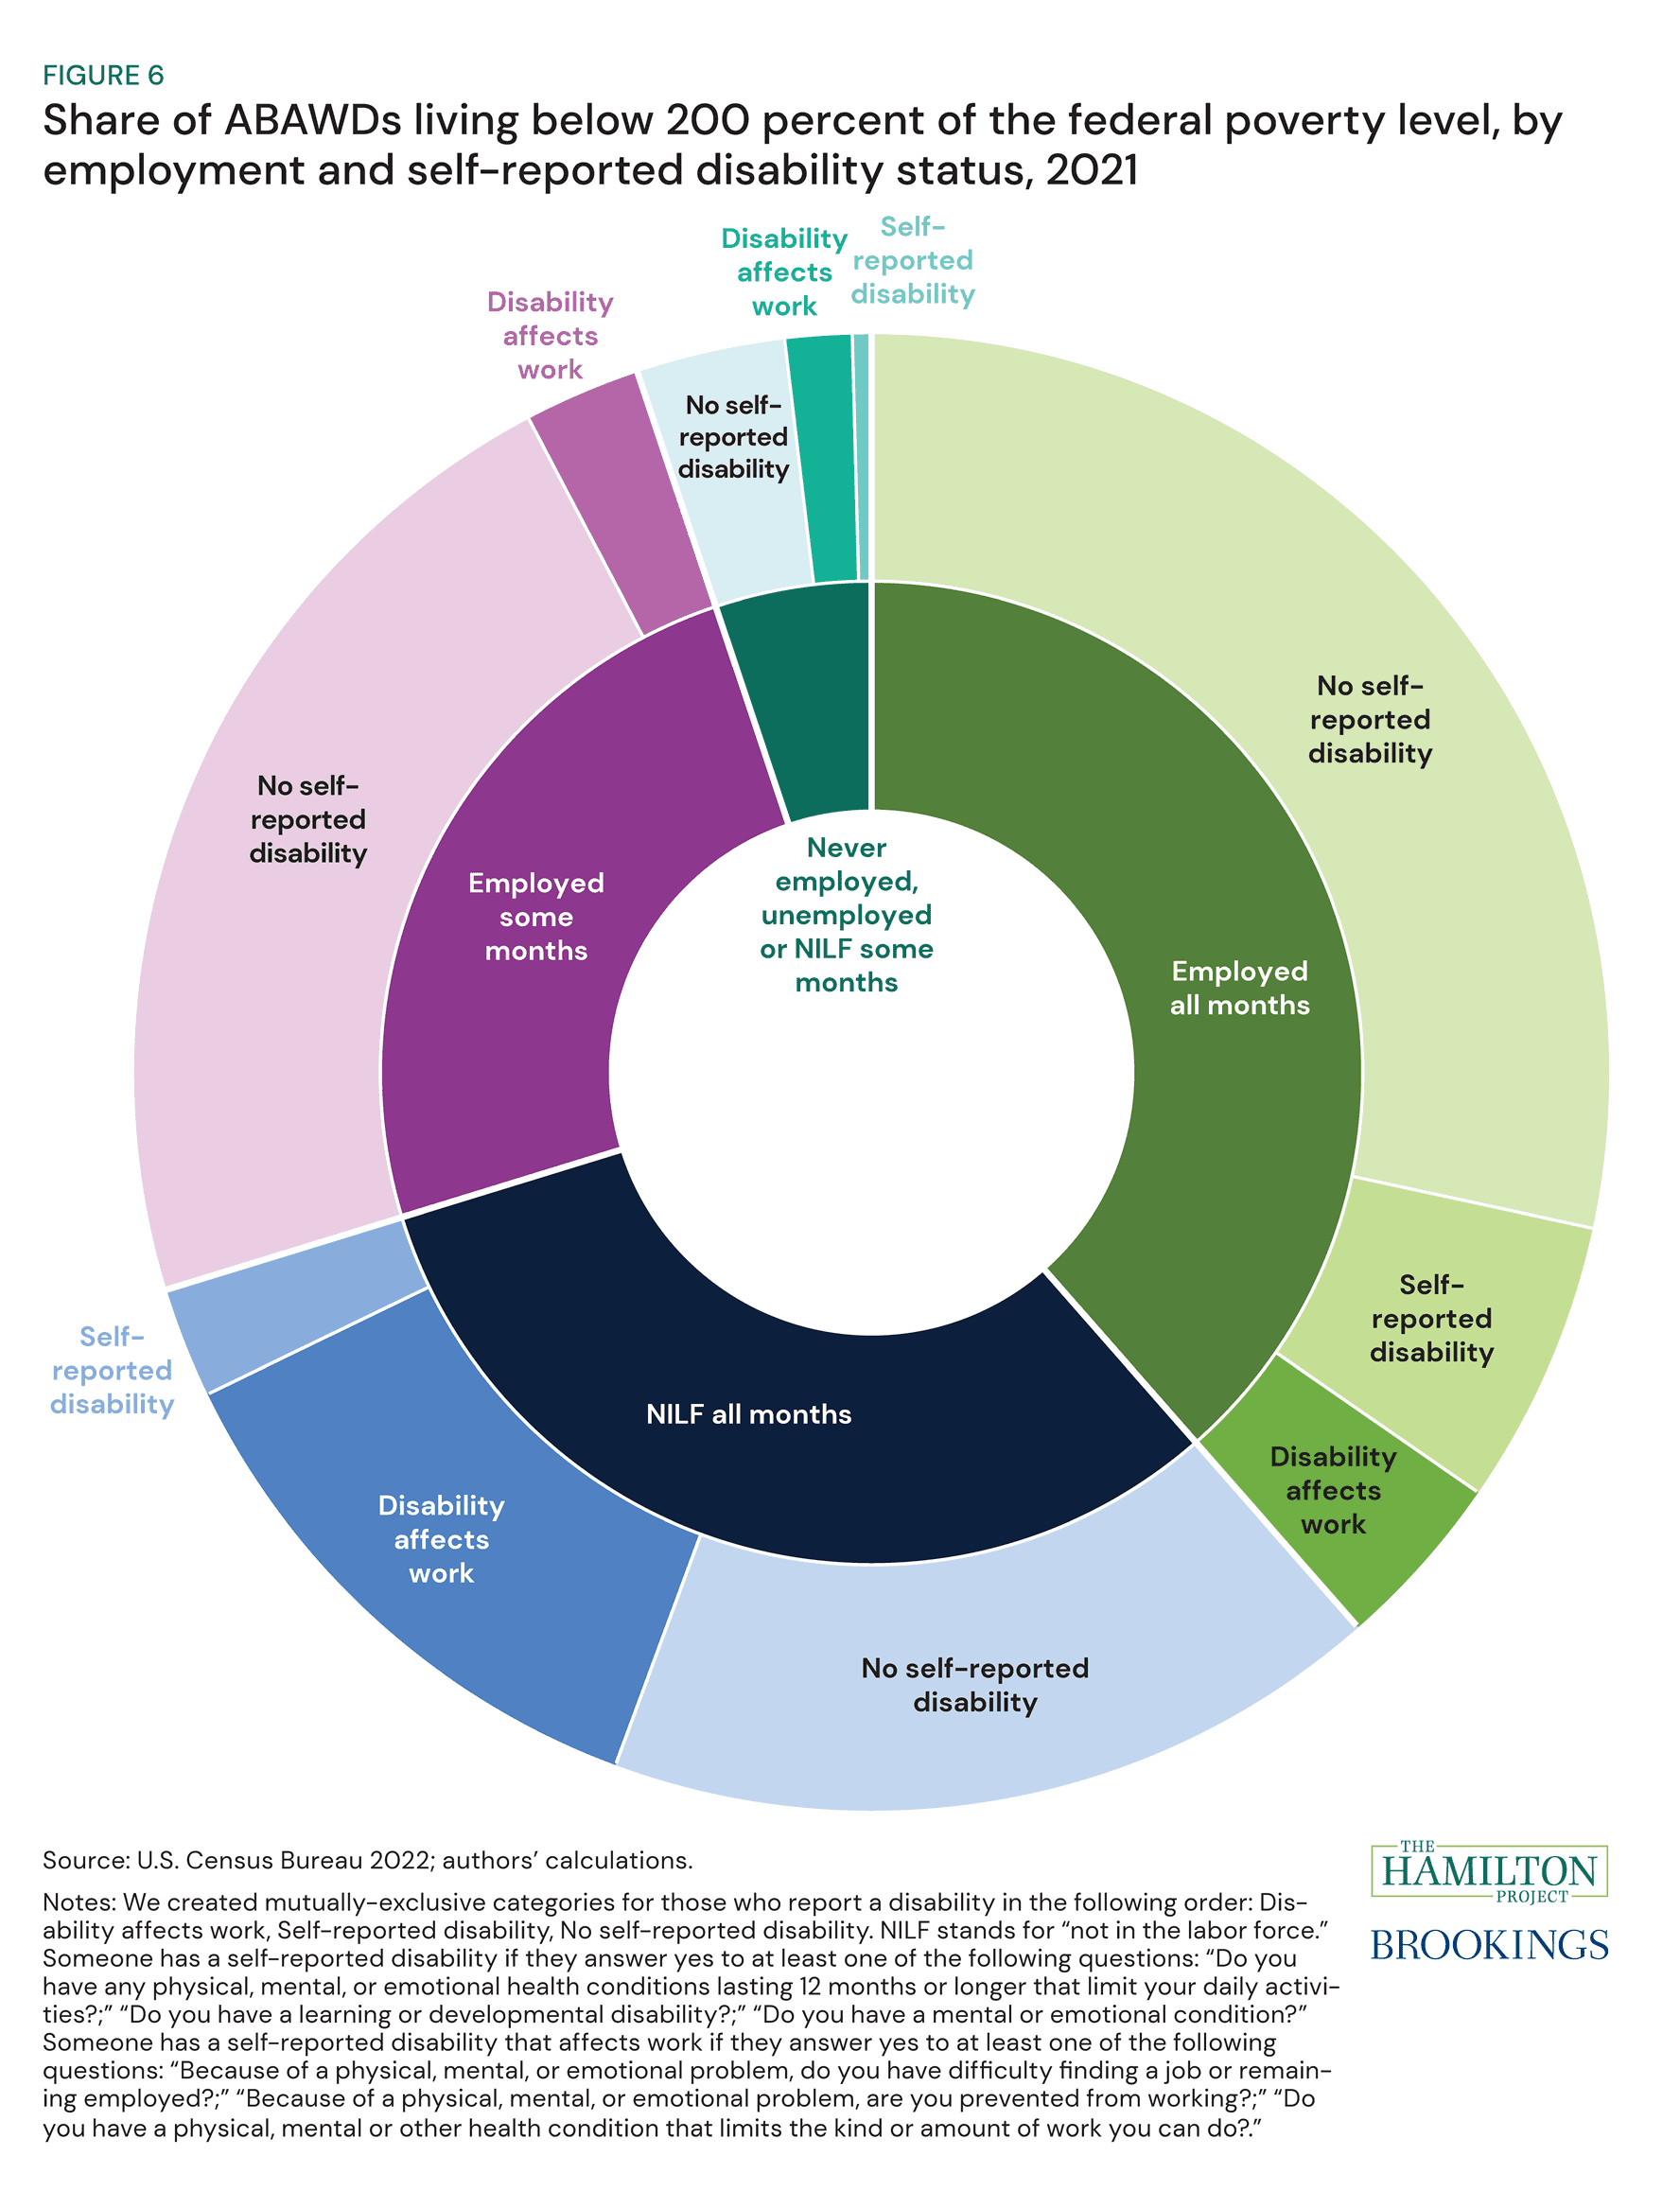
Figure 6: Share of ABAWDs living below 200 percent of the federal poverty level, by employment and self-reported disability status, 2021, from "The safety net should work for working-age adults"

"The safety net should work for working-age adults"

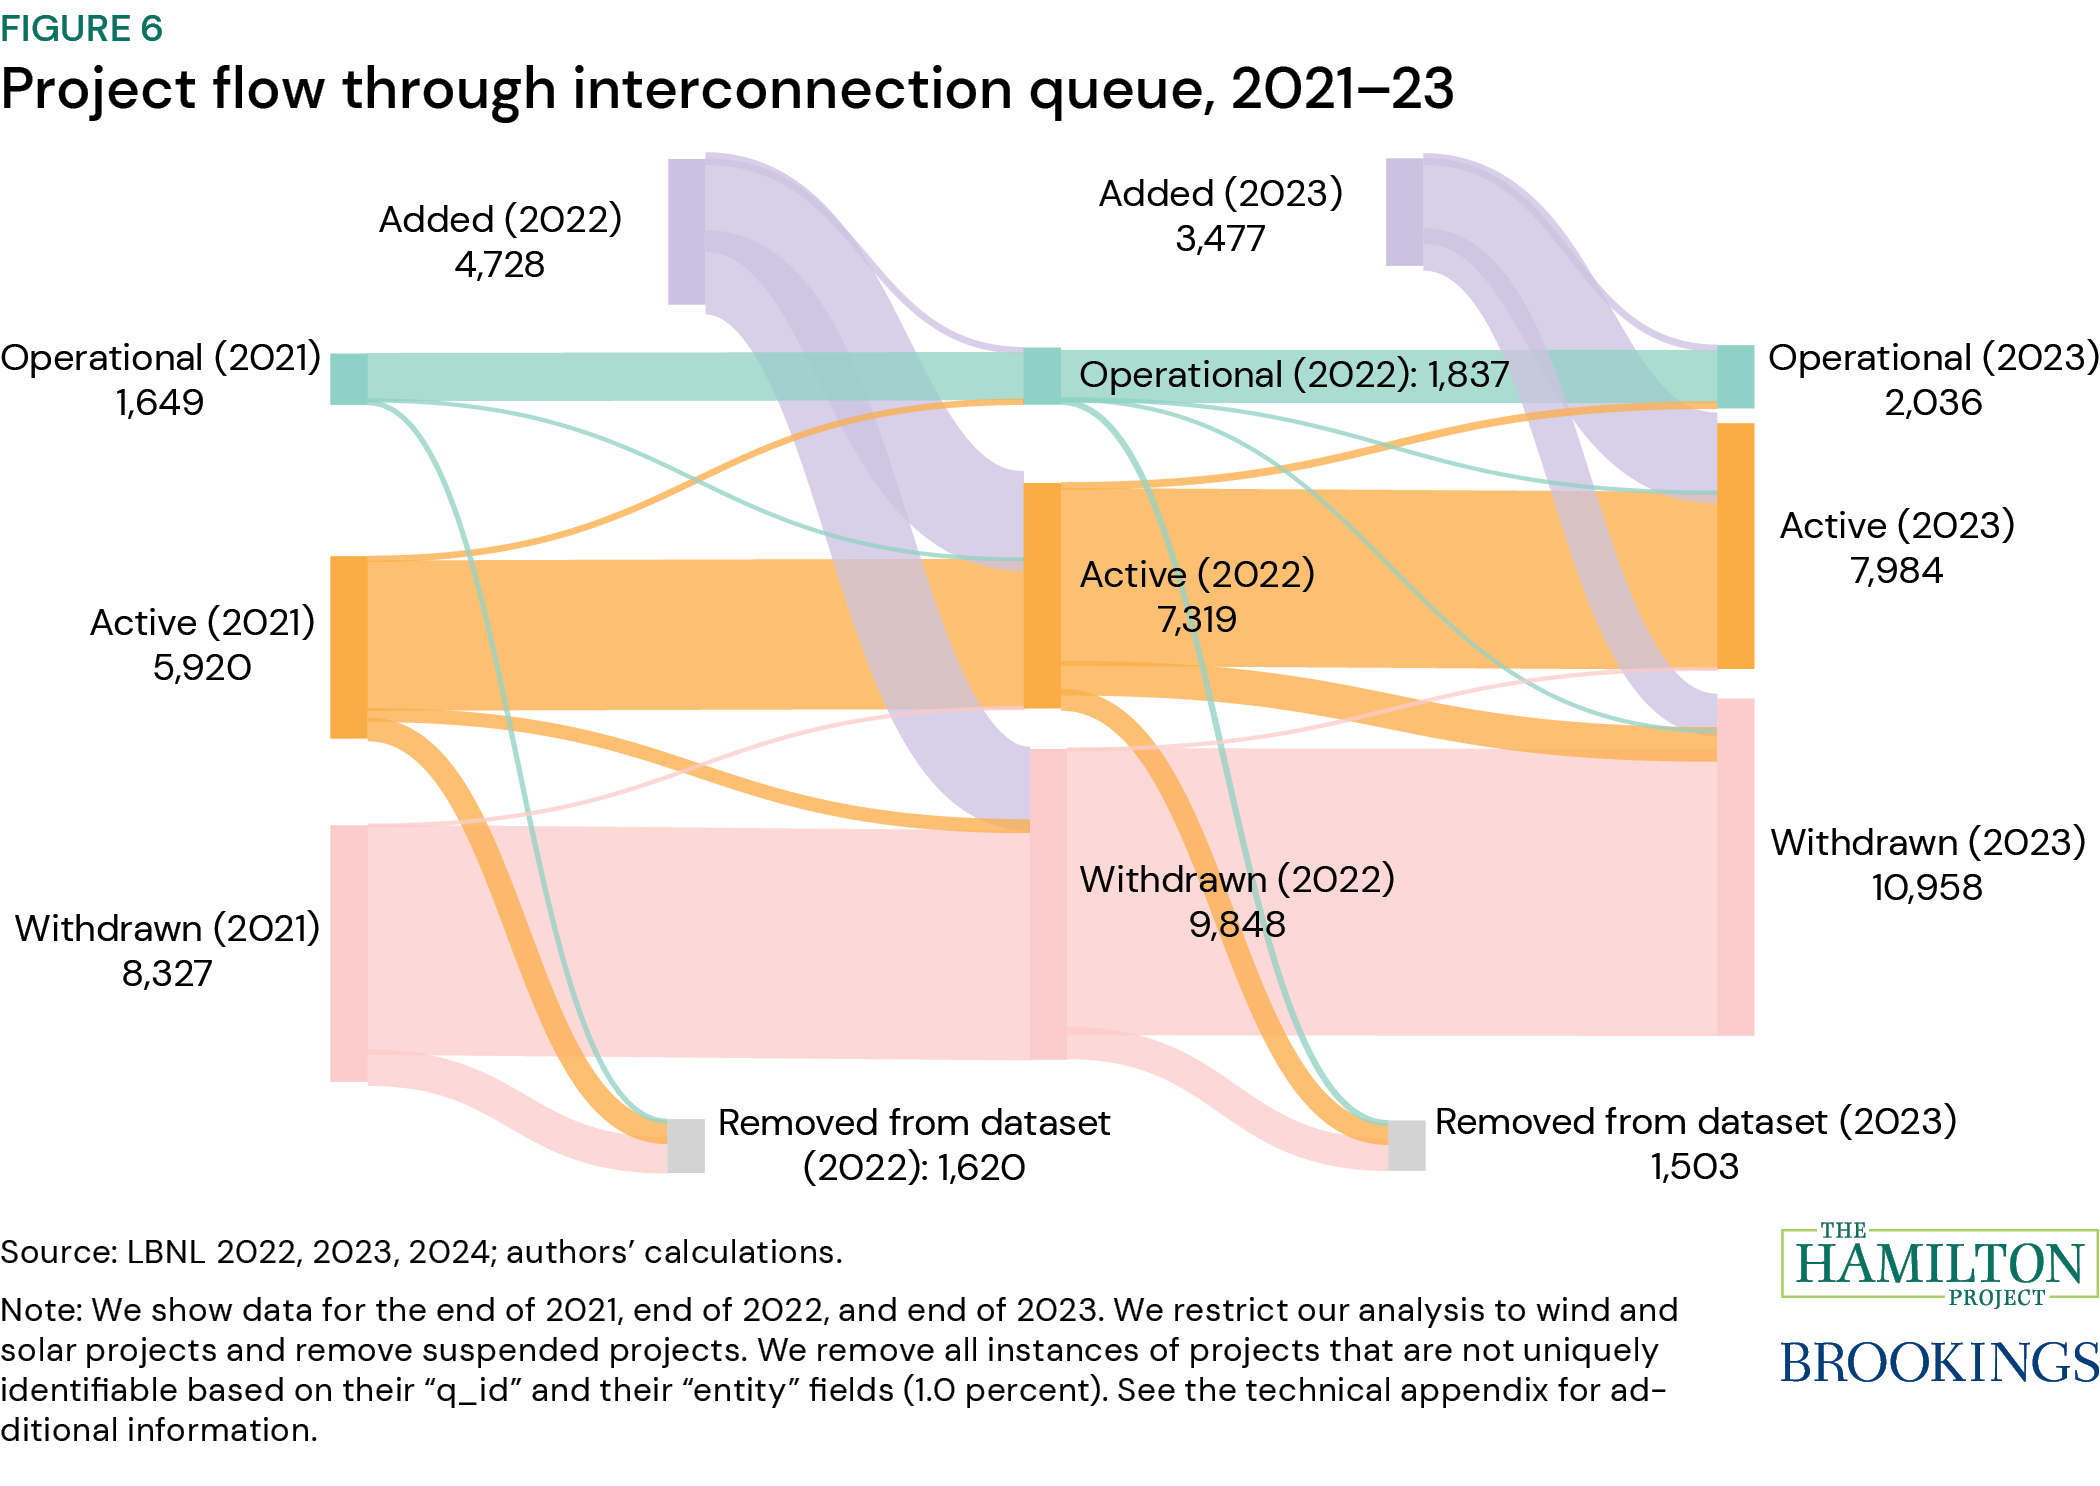
Figure 6: Project flow through interconnection queue, 2021 to 2023, from "Eight facts about permitting and the clean energy transition"

"Eight facts about permitting and the clean energy transition"

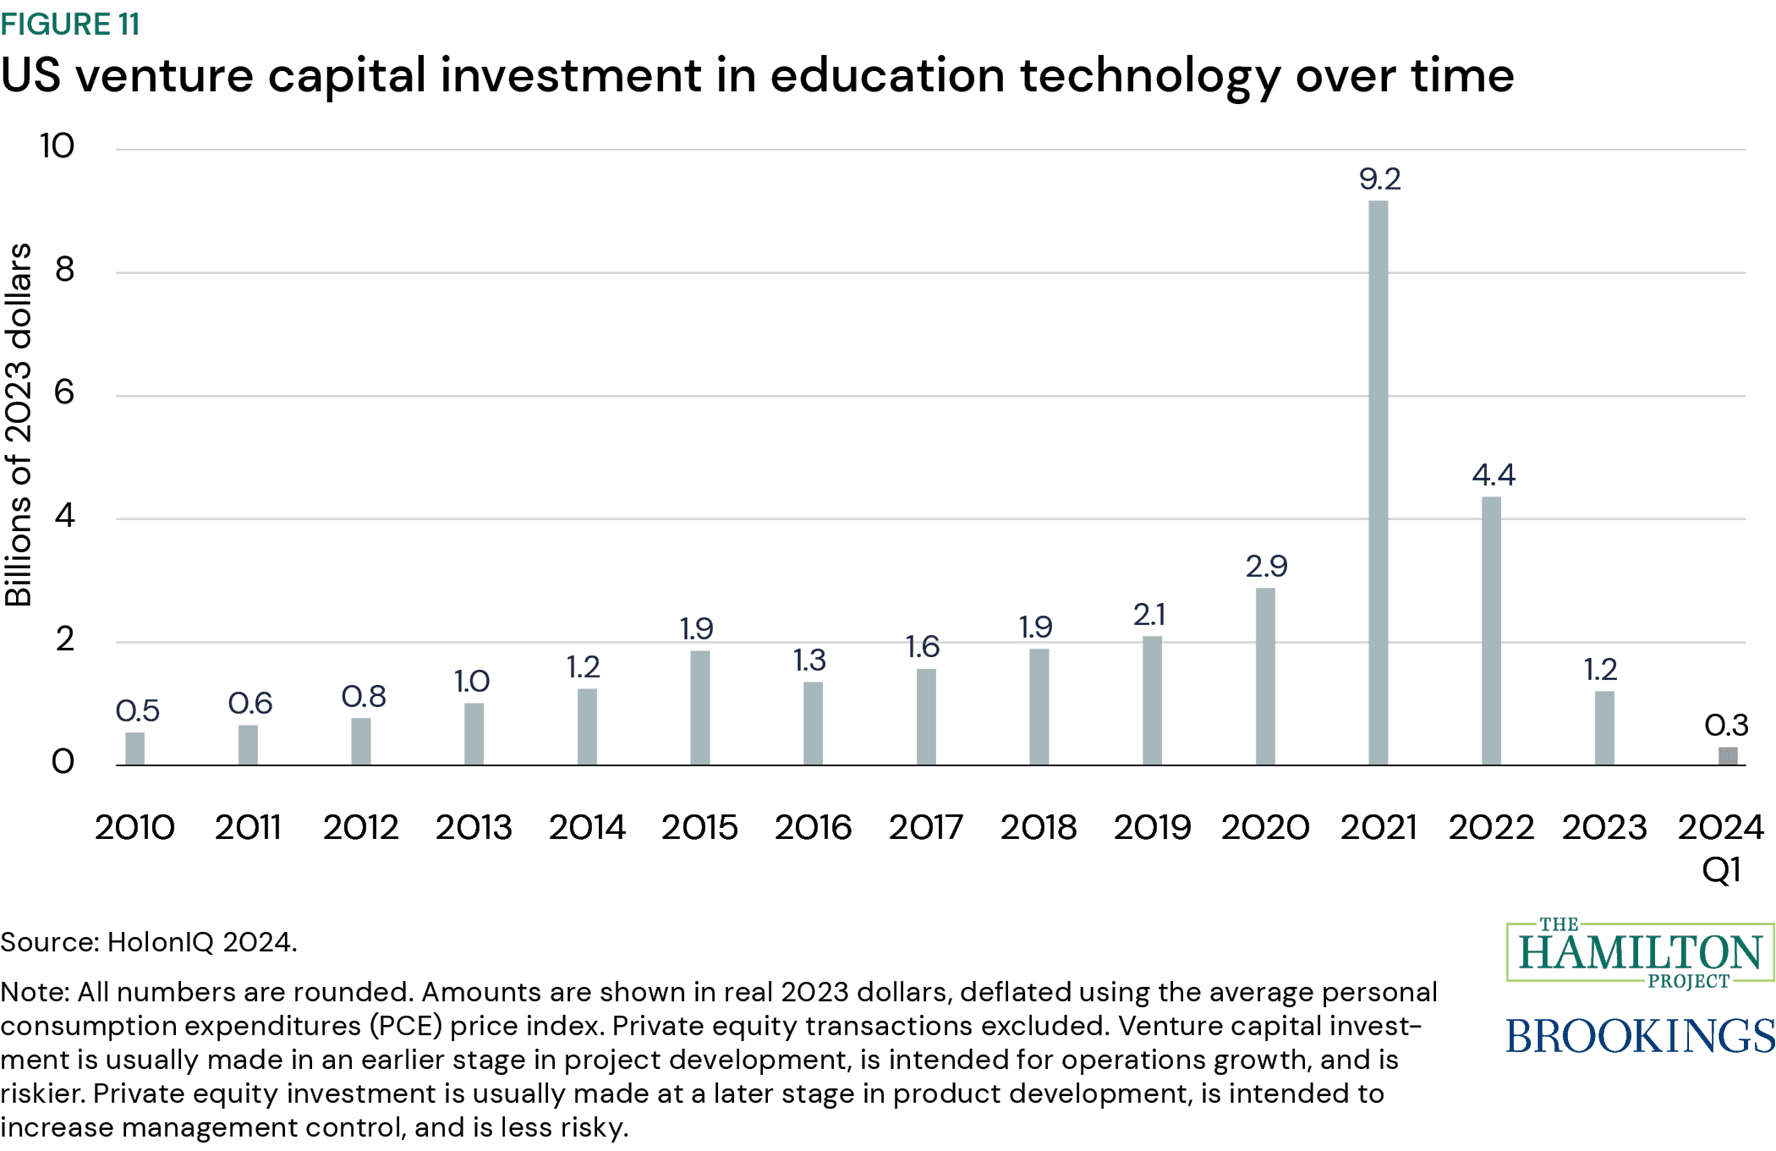
Figure 11: US venture capital investment in education technology over time, from "Twelve facts about the economics of education"

"Twelve facts about the economics of education"

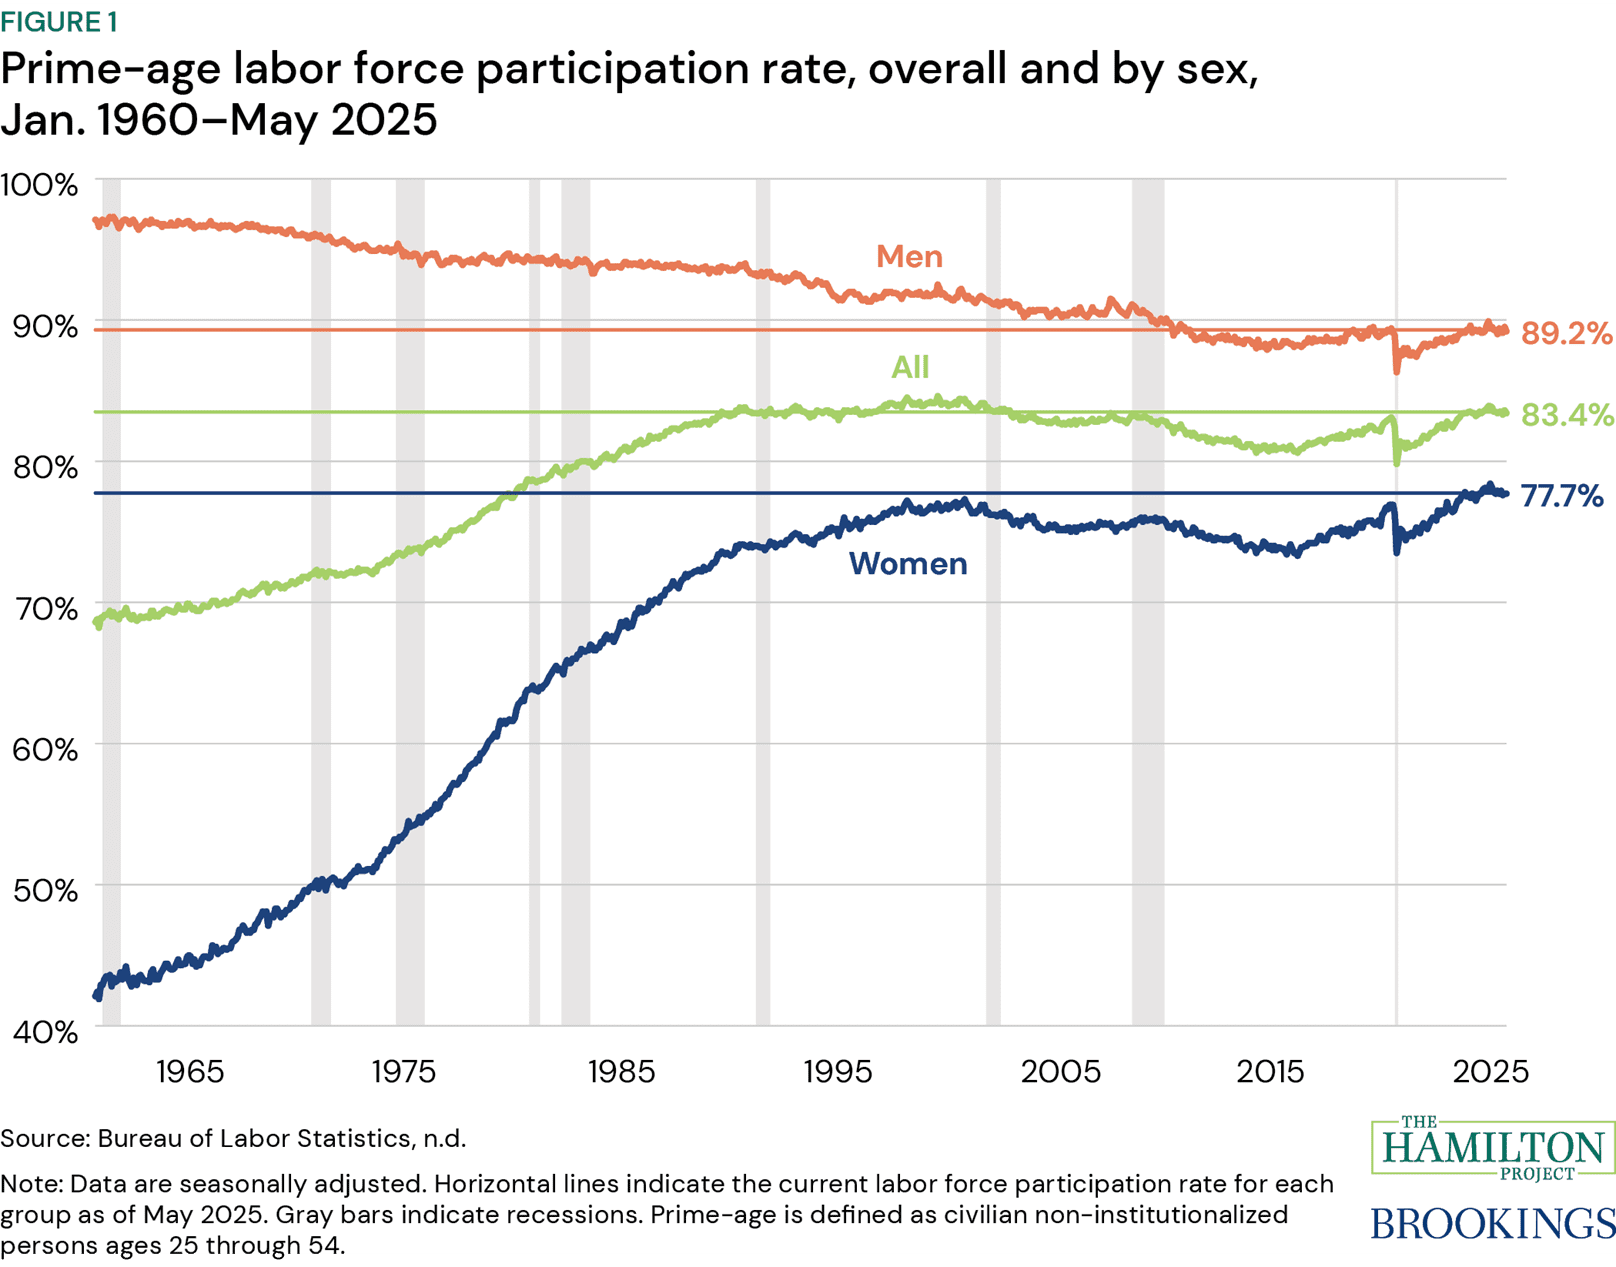
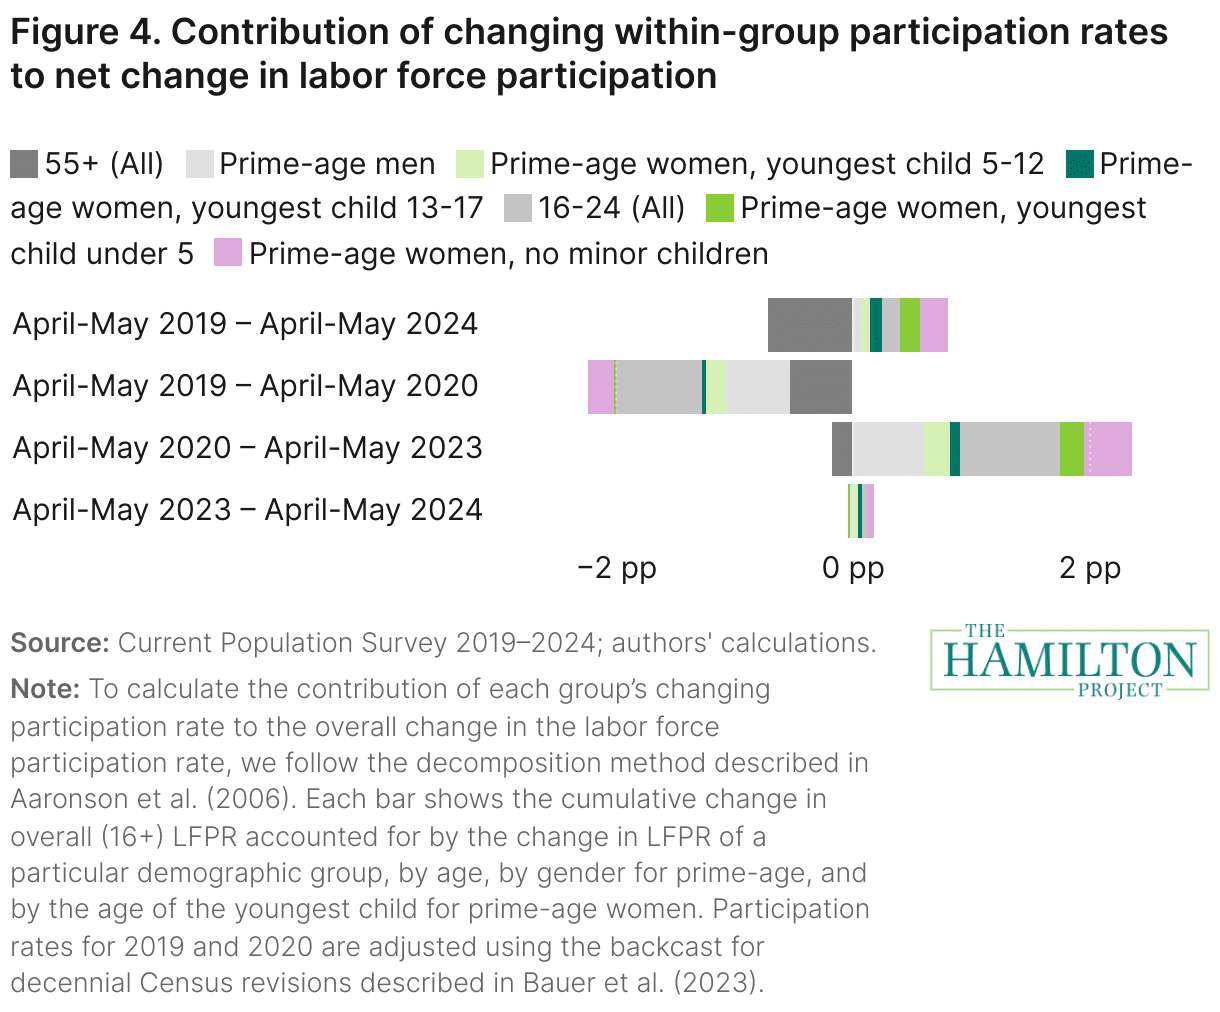
Figure 4: Contribution of changing within-group participation rates to net change in labor force participation, from "Prime-age women are still driving the labor market recovery"

"Prime-age women are still driving the labor market recovery"

Featured Figures

Explore data from our publications

Contact Us

THP Newsletter

Stay up to date with The Hamilton Project by signing up to receive the newsletter.

This field is for validation purposes and should be left unchanged.

Copyright 2025 The Brookings Institution. Terms and Conditions. Build by Social Driver.

  • Topics
    • Economic Security & Inequality
    • Education
    • Effective Government
    • Employment & Wages
    • Energy & Climate
    • Health Care
    • Healthy Economy
    • Housing & Infrastructure
    • Immigration
    • Recessions
    • Social Insurance
    • Tax Policy & Budget
    • Technology & Innovation
  • Publications
  • Data
  • Events
  • About
    • Mission and Vision
    • Advisory Council
    • Staff
    • Careers
    • Contact Us
  • Search
  • Newsletter Signup
  • News and Commentary
  • Brookings
Close Modal
Close Modal
close modal icon
This website uses cookies to offer you a better experience. By continuing on the site, you agree to the use of cookies.Agree