There are various ways to evaluate recent trends in real pay (i.e., nominal pay adjusted for inflation), including using different measures of pay, measures of inflation, and reference periods. These factors can lead to conflicting conclusions about the trends in real pay in the United States. In October 2023, we published a detailed analysis breaking down these differences.
The interactive below shows you the annualized percent change in real pay from a base fourth quarter of your choice to the most recent quarter with available data. For each time period of your choice, this interactive will show you the change in real pay using four different pay measures and two different inflation measures. You can hover over the legend or the bars themselves to see percent changes in pay. The title of each figure will show the time period over which the change is calculated.
Select base period:
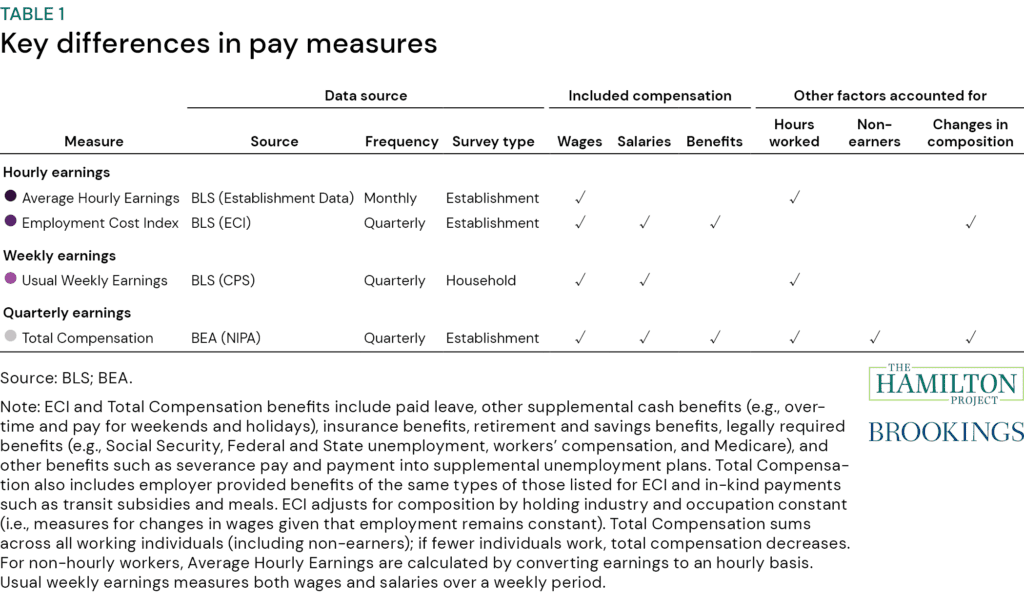
There are various metrics of pay for work (cash and, using some metrics, benefits) before taxes and government transfers. This interactive will show changes in pay using the following measures: Average Hourly Earnings, the Employment Cost Index (ECI), Median Usual Weekly Earnings, and Total Compensation (compensation reported in the National Income and Product Accounts). These metrics have key differences, such as what types of pay they include and whether they account for factors like the number of hours people work or changes in the composition of the labor market. Some commonly used measures can be hard to interpret because, for example, they ignore the loss of pay for those who are no longer working or they are affected by whether high– or low-wage workers work more or less. See table 1 for a brief overview of these differences.

This interactive will also allow you to understand changes in pay using two different inflation measures: the Consumer Price Index (CPI) and the Personal Consumption Expenditures (PCE) index. As we explain in our prior analysis, adjusting for inflation to compute real pay is essential to understanding how purchasing power has changed. However, deflating by CPI or PCE may point to different conclusions. As we explain, CPI better reflects the salient out-of-pocket costs of consumer spending. The PCE index, on the other hand, better reflects the total costs of consumer spending, including more expenses that are not directly incurred by households.
The choice of reference period matters significantly, particularly given the volatility in the economy in the past several years. This interactive will allow you to understand how pay has changed relative to a variety of reference periods before and during the pandemic.
See our prior analysis to better understand why these various factors matter for real pay, to see how pay changed across the distribution, and to see changes in these measures relative to longer-term trends.
Q1 2024—Has pay in recent months kept up with inflation?
This analysis will be updated as new data come out. It was last updated on May 2, 2024.
The interactive above shows the annualized percent change in real pay from the fourth quarter of each year from 2019 to 2023 through the first quarter of 2024 (e.g., choosing “Q4 2019” in the dropdown will produce the annualized percent change in real pay from Q4 2019–Q1 2024). This interactive will update each quarter as new data are released.
We find that all four measures of typical and aggregate pay, adjusted by PCE, have grown since 2019. When deflating using CPI, we find smaller increases across three of the four measures and a decline in one measure. In other words, nominal pay by these measures has done relatively well in keeping up with overall costs of living since 2019, measured by PCE. Nominal pay has done somewhat less well in keeping up with increases in the costs of goods and services that are much more salient to consumers, measured by CPI. This pattern is consistent across time periods, with pay deflated by CPI experiencing smaller increases—or instead decreases—relative to pay deflated using PCE.
Further, using PCE inflation, there have been gains in real pay across measures relative to the fourth quarter of 2021. Since the fourth quarter of 2022, deflating by either inflation measure shows gains in real pay. Finally, since the fourth quarter of 2023, real pay grew as measured by Average Hourly Earnings, the Employment Cost Index (ECI), and Total Compensation as reported in the National Income and Product Accounts. Real pay as measured by Median Weekly Earnings fell sharply, reversing an almost equally sharp increase in the previous quarter.
Total Compensation consistently reports the biggest increases in pay across quarters. As we explain, this measure accounts for aggregate pay across all individuals accounting for changes in employment (i.e., changes in pay resulting from changing numbers of workers or hours worked). Average Hourly Earnings and Median Weekly Earnings, on the other hand, are sensitive to changes in composition. Therefore, over certain time periods, particularly periods where either lower- or higher-wage industries and occupations are increasing as a share of the overall labor market, results are more mixed when using these measures. For example, in 2020, pay increased for the average or median worker, in part because those who remained employed at the time were higher-wage workers. Read our prior analysis for more details on the differences between various pay and inflation measures and how they impact changes in real pay.
Acknowledgments
The authors are grateful to Lauren Bauer and Marie Wilken for providing helpful comments and to Chloe East for her excellent work on the prior analysis which served as a foundation for this interactive.


