
The health-care sector is in many ways the most consequential part of the United States economy. It is a fundamental part of people’s lives, supporting their health and well-being. Moreover, it matters because of its economic size and budgetary implications. The health-care sector now employs 11 percent of American workers (Bureau of Labor Statistics [BLS] 1980–2019b and authors’ calculations) and accounts for 24 percent of government spending (Centers for Medicare & Medicaid Services [CMS] 1987–2018; Bureau of Economic Analysis 1987–2018; authors’ calculations).[1] Health insurance is the largest component (26 percent) of nonwage compensation (BLS 2019b) and health care is one of the largest categories of consumer spending (8.1 percent of consumer expenditures; BLS 2019a).
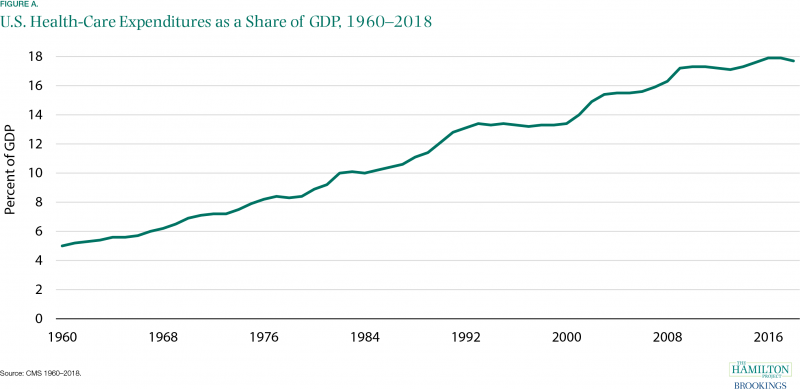
A well-functioning health-care sector is therefore a prerequisite for a well-functioning economy. Unfortunately, the problems with U.S. health care are substantial. The United States spends more than other countries without obtaining better health outcomes (Papanicolas, Woskie, and Jha 2018). Health care is growing as a share of the economy and government budgets in ways that appear unsustainable (CMS 1960–2018; Organisation for Economic Co-operation and Development [OECD] 2015). This growth has slowed at times; health spending as a share of GDP was roughly flat in much of the 1990s, and growth has also slowed to some extent in recent years. But even if expenditures as a share of GDP plateaued at their current level, they would still represent a massive expenditure of resources. Sixty years ago, health care was 5 percent of the U.S. economy, as can be seen in figure A; at 17.7 percent in 2018, it was more than three times that.
This growth represents a range of factors, from new health-care treatments and services to better coverage, higher utilization, and rising prices. Some of these changes are desirable: As a country gets richer, spending a higher share of income on health may be optimal (Hall and Jones 2007).[2] Countries with a higher level of output per capita tend to have a higher level of health expenditures per capita (Sawyer and Cox 2018). In addition, as the population ages, health deteriorates and health-care spending naturally rises. Finally, if productivity advancements are more rapid in tradable goods like agriculture or manufacturing than in services like health care or education, the latter will tend to rise in relative price and as a share of GDP.[3]
But some of the increase in health-care costs is undesirable (Cutler 2018). Rent-seeking, monopoly power, and other flaws in health-care markets sometimes result in unnecessary care or in elevated health-care prices. In several of the facts that follow, we describe these factors and how they are shaping health care.
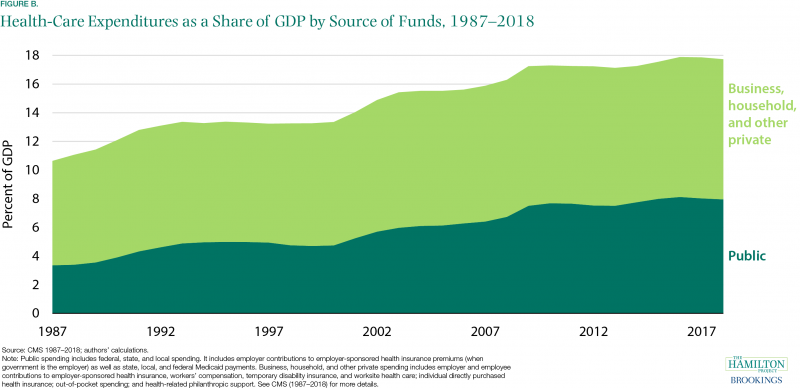
Spending by private and public payers have both increased. The United States has a health-care system that largely consists of private providers and private insurance, but as health care has become a larger part of the economy, a higher share of health-care funding has been provided by government (figure B). As of 2018, 34 percent of Americans received their health care via government insurance or direct public provision (Berchick, Barnett, and Upton 2019).
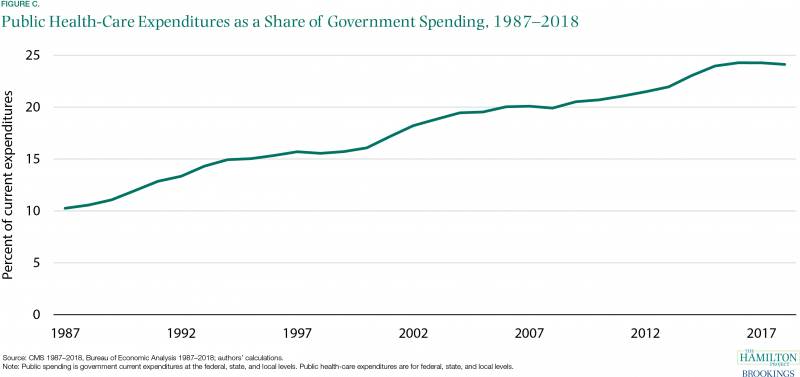
 As shown in figure C, health care has doubled as a share of total government expenditures in the last three decades, from 11.9 percent in 1990 to 24.1 percent in 2018. This increase comes from the rising shares of the population enrolled in Medicare, Medicaid, state Children's Health Insurance Programs, and veterans’ health benefits. Policy changes like the introduction of the Medicare prescription drug benefit (Part D) in 2006 and a major expansion of Medicaid eligibility in 2014 played important roles. At the same time, spending on discretionary programs like education and research and development have decreased as a share of GDP (Congressional Budget Office 2020). If health expenditures continue to increase as a share of government spending, the increase will eventually necessitate either tax increases or reduced spending on other important government functions like public safety, infrastructure, research and development, and education.
Of course, health costs are also borne by the private sector. Firms and households in the United States spent 10 percent of GDP on health care in 2018. Despite widespread coverage—as of 2018, 91.5 percent of Americans had either private or government health insurance for all or part of the year (Berchick, Barnett, and Upton 2019)—many people still face large and variable out-of-pocket health-care costs. In 2017, more than 1 in 50 Americans who interact with the health-care system have out-of-pocket costs in excess of $5,000, and 1 in 200 have costs over $10,000.[4] At the other end of the distribution, roughly one in seven have no out-of-pocket costs at all in a given year (figure D).[5]
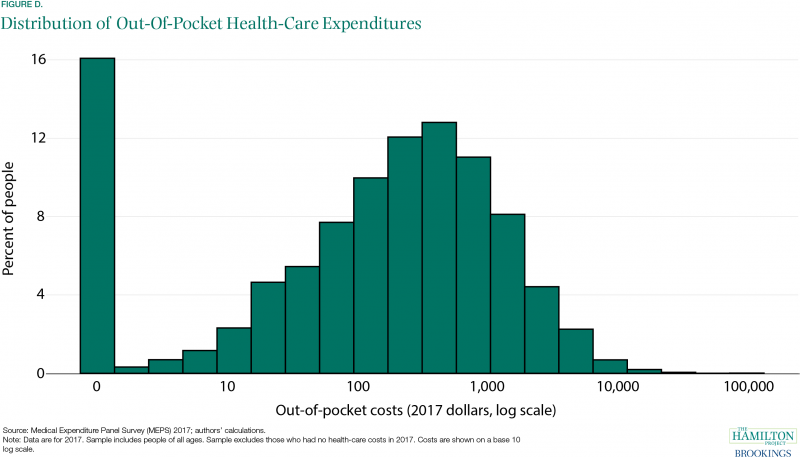
The upper end of the distribution of out-of-pocket costs dwarfs the liquid resources of many U.S. households, meaning that many people faced with a negative health shock may also find themselves in financial trouble. Negative health shocks tend to be associated with loss of income, thereby compounding the problem (Garcia-Gómez et al. 2013). Unexpected health costs can generate bankruptcies and ongoing financial hardship (Gross and Notowidigdo 2011).[6]
In this document, we provide 12 facts about the economics of U.S. health-care, focusing largely on the private-payer system. We highlight the surge in health-care expenditures and their current high level. We note the wide variation of expenditures across individuals—something that necessitates insurance. We document that the United States pays higher prices than most countries and that these prices vary widely across and within places. We show that a lack of competition and high administrative costs are especially important contributors to high expenditures, indicating the need for reforms to reduce costs in the United States. To keep the focus on these issues, we do not discuss questions of coverage or of how coverage is provided (publicly or via the market), but instead address the questions of why expenditures, costs, and prices are so high.
This analysis aims to promote The Hamilton Project’s mission to support broadly shared economic growth. Removing excess costs from the health-care system is both an economic imperative and a complement to policy efforts to improve health-care access and outcomes. In the following facts we provide context for understanding the landscape of policy options for reducing costs in the health-care system.
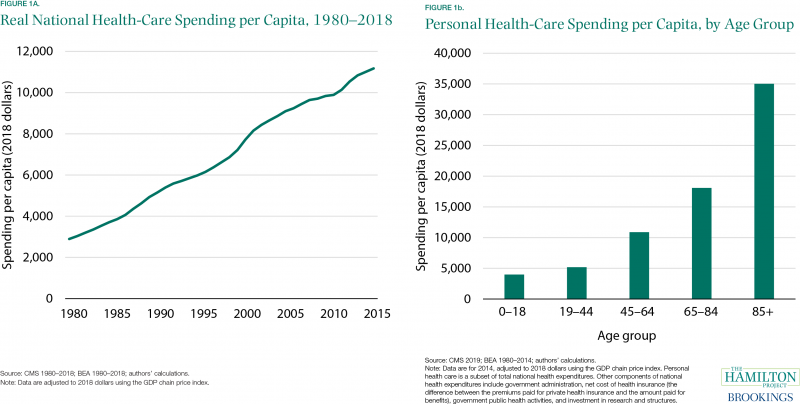
Fact 1: U.S. per capita health-care spending nearly quadrupled from 1980 to 2018.
Spending on U.S. health care has grown steadily, rising from $2,900 per person in 1980 to $11,200 per person in 2018 (measured in 2018 dollars)—a 290 percent increase (figure 1a). That growth has slowed at times, as in the mid- to late 1990s and early 2010s, but since 1980 it amounts to annualized growth in real per capita spending of 3.6 percent. From 2005 to 2018, growth has been slower (2.0 percent per year).
A small part of the reason for this growth is the aging of the U.S. population. As shown in figure 1b, the United States spends $18,100 on personal health care for an average person 65 to 84 years old and $35,000 on an average person 85 or older, while only spending $4,000 on an average person 18 or younger.[7] As the share of those 65 and older has risen, health-care spending per capita has increased accordingly. But this aging-related increase is only a small portion of the overall rise in spending: if the pattern of spending by age had remained constant at 2014 levels, the aging that took place from 1980 to 2014 would have led to a 34 percent rise in per capita spending—far below the 250 percent total increase over that same period.[8] In addition, as average age has increased, underlying health conditions like obesity have gotten worse over time, necessitating increased health-care expenditures (Paez, Zhao, and Hwang 2009; Cawley and Meyerhoefer 2012).
Some of the increase simply reflects the growing spending that takes place as per capita income grows, and some comes from innovations that bring new health-care services and products. However, the phenomenon called Baumol’s cost disease describes how sectors with relatively low productivity growth (like health care) tend to experience rising costs (Baumol and Bowen 1965; Baumol 2012). But understanding why health care has had little productivity growth relative to the rest of the economy is important (Sheiner and Malinovskaya 2016). As we explore in subsequent facts, problems with health-care markets have contributed to rapidly rising costs in recent decades.
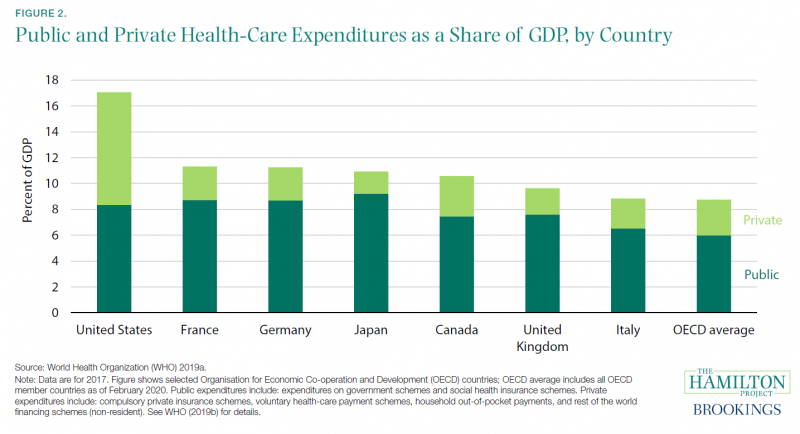
Fact 2: U.S. health-care spending is almost twice as high as the OECD average.
The United States spends much more on health care as a share of the economy (17.1 percent of GDP in 2017, using data from the World Health Organization [WHO][9]) than other large advanced economies like Germany (11.2 percent) and the United Kingdom (9.6 percent). Public spending by the United States (8.3 percent of GDP) is roughly similar to public spending by other countries; it is only when private spending is added that the United States far exceeds peer nations (see figure 2). However, public health insurance in the United States covers only 34 percent of the population, much less than the universal coverage in countries like Canada and the United Kingdom (Berchick, Barnett, and Upton 2019; OECD 2020b), indicating that it costs far more to provide coverage in the U.S. system than around the world.
Figure 2 distinguishes spending on the basis of the ultimate payer, such that government payments to private providers are counted as public spending. Almost all U.S. health care is privately provided, and 51 percent of spending is paid for by families, nonprofits, and businesses. This is in contrast to those countries that also rely largely on private providers but have the government as the payer (e.g., Canada) and those countries that rely both on public health-care providers and public funding (e.g., the United Kingdom). Note that the countries shown in figure 2 are high-income, advanced nations with near-universal health coverage, meaning that the gap in spending is not primarily explained by differences in coverage rates or income levels, but rather by differences in health-care institutions and policy.
What do Americans get for their additional health-care spending? In the United States, life expectancy at birth is the lowest of the countries in figure 2; maternal and infant mortality are the highest (Papanicolas, Woskie, and Jha 2018).[10] Certainly, other non-health-care factors contribute to these outcomes, but poor U.S. performance stands in striking contrast to its high spending on health care (Garber and Skinner 2008).
Fact 3: Most health-care spending is on hospitals and professional services.
U.S. health-care spending is high and has increased dramatically in recent decades. But what does the United States purchase with all this spending?
Roughly a third of all health-care spending goes to hospital care (figure 3), making clear that the functioning of the U.S. hospital system is crucially important when health-care expenditures are considered. Professional services make up roughly a quarter of spending. (Professional services are those provided by physicians and nonphysicians outside of a hospital setting, including dental services.) The combination of long-term care, nursing care facilities, and home health care account for 13 percent of total health expenditures. Prescription drugs are next at 9 percent, and net health insurance costs (i.e., premiums earned less benefits paid) account for 7 percent of total spending.
Insurance covers these different expenditures to varying degrees. Consequently, out-of-pocket spending looks somewhat different than overall spending: the largest shares of out-of-pocket spending go to professional services (38 percent of total out-of-pocket spending) and prescription drugs (13 percent) (CMS 2018 and authors’ calculations).[11] Because prescription drugs are an ongoing expense for many, and given the immediate and direct health impact that often results from a lack of access, the costs of prescription drugs can dominate health-care cost discussions. However, for individuals (and especially for the system as a whole), the expense of professional services is much larger.
Much health spending consists of labor costs, rather than capital investment. One study of physicians’ offices, hospitals, and outpatient care found that labor compensation accounted for 49.8 percent of 2012 health-care revenues (Glied, Ma, and Solis-Roman 2016). Lowering these labor costs requires some combination of increased labor supply, (e.g., more health-care professionals), fewer restrictions on what nonphysicians are permitted to do (Adams and Markowitz 2018), and reductions in unnecessary services.

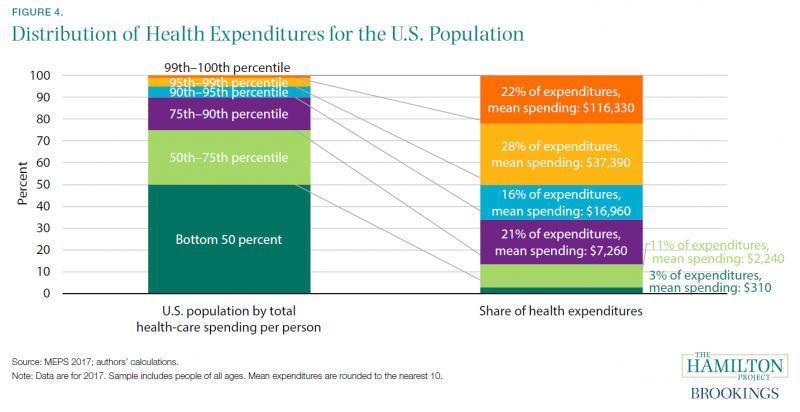
Fact 4: Five percent of Americans accounted for half of all U.S. health-care spending in 2017.
Health-care spending in any given year is distributed very unequally. The half of the population using the least health care accounts for only 3 percent of total (not just out-of-pocket) expenditures (excluding long-term care and some other components of spending),[12] while the top 1 percent accounts for 22 percent (figure 4).
One reason for this is that health misfortunes can strike at random, causing one-year expenditures to spike. In any given year the distribution can be very unequal, but only some of those with the highest spending will continue to have high spending in subsequent years (Cohen and Yu 2012). The bottom half of health-care users are disproportionately young and consequently less likely to need expensive health care (but apt to need it later in life). Many people will incur high end-of-life expenditures—such costs accounted for 13 percent of personal health-care costs in 2011 (Aldridge and Kelley 2015)—but in any given year most people do not incur these costs. Also, at 13 percent, end-of-life care is important but not a dominant part of U.S. health-care costs.[13]
When individuals incur high costs, insurance is usually necessary to prevent extreme financial hardship. The top 1 percent have mean health-care expenditures of over $100,000, and the next 4 percent have an average of $37,000—expenses that are well beyond ability to pay for many families. At the same time, the existence of insurance means that patients bear less financial responsibility for the cost of their care and have less incentive to control costs. In other cases—such as emergencies—patients are often unable to compare costs or weigh prices. Both of these features mean that normal downward pressures on prices may not operate in the standard way in a health-care market.
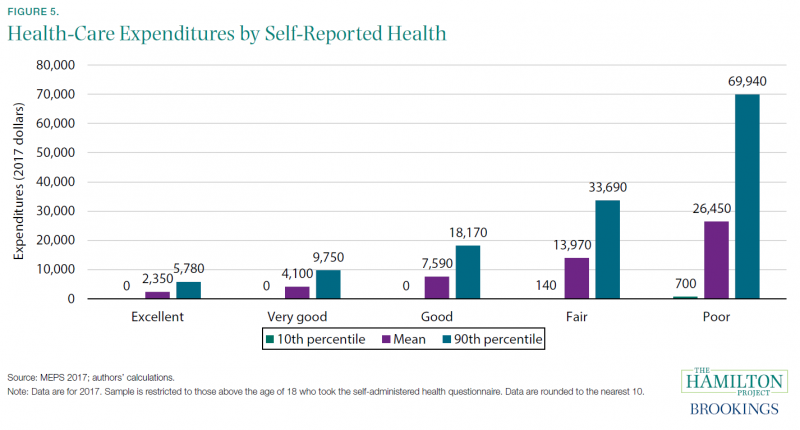
Fact 5: Expenditures are high and variable for those with the poorest health.
Self-reported health is a well-established summary measure of a person’s health that reliably correlates with objective health measures like laboratory biomarkers (Schanzenbach et al. 2016). We use it in figure 5 to explore how the level and variation in health-care expenditures (total, rather than out-of-pocket) differ across people of varying health conditions.
People enjoying good health are, unsurprisingly, not a major driver of health-care expenditures. Among those who report excellent health, even those at the 90th percentile of expenditures incur only $5,780 in annual spending, not far above the average of $2,350 for that group. On the other end of the spectrum, people who report being in poor health have average health-care expenditures of $26,450.
More striking is the dramatically higher range of expenditure levels for those in poor health. People at the 90th percentile of expenditures (for those in poor health) have nearly $70,000 spent on their behalf. Conversely, the 10th percentile of those in poor health have just $700 in expenditures, or 100 times less than the 90th percentile.
The group of people who report poor health as well as low health-care expenditures may have health problems that are not resolvable through expensive medical services, but they may also be medically underserved, whether because of a lack of insurance or other reasons (Cunningham 2018). Regardless, health status alone may not always be a good guide to expected expenditures in a given year.
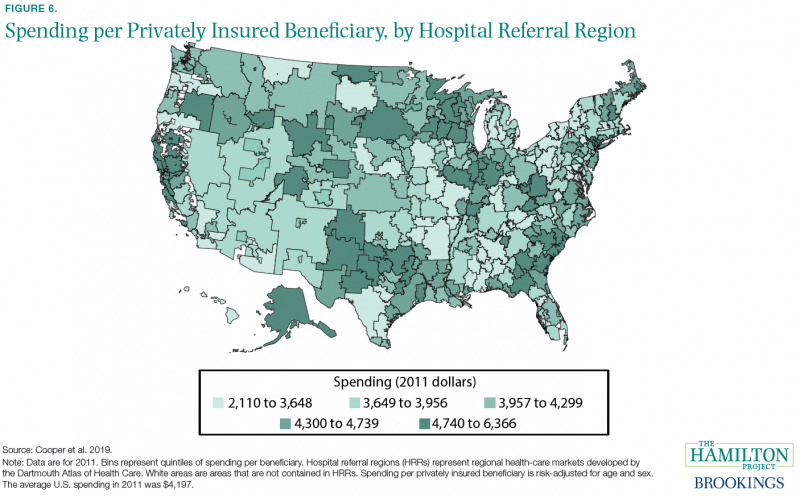
Fact 6: Health-care spending per privately insured person is three times higher in some parts of the country than in others.
Some places in the United States have considerably higher health-care spending than others. This is not primarily a matter of elderly people being disproportionately represented in certain areas. Figure 6 shows spending per privately insured beneficiary after adjusting for differences across places in age and sex (Cooper et al. 2019). The upper Midwest, much of the east coast, and northern California are all notable as places with especially high spending.
In a comparison of so-called hospital referral regions (i.e., regional health care markets), spending per privately insured beneficiary is about three times higher in the highest-spending region ($6,366 in Anchorage, Alaska) than in the lowest-spending region ($2,110 in Honolulu, Hawaii). Roughly half of the overall variation is associated with differences in prices across regions, with the other half due to differences in the quantity of health care consumed. Surprisingly, a significant amount of the national variation in prices occurs within hospitals (Cooper et al. 2019).
Medicare spending is somewhat different: prices are set administratively rather than through decentralized negotiations between payers and providers. Most of the geographic variation in Medicare spending is accounted for by differences in health-care utilization across places—especially in post-acute care—rather than by prices (Cooper et al. 2019). Further, about half of the variation in utilization is driven by demand-side factors like health and preferences, but differences in supply across places are also important (Finkelstein, Gentzkow, and Williams 2016).
Is this spending variation evidence of a problem that policy should address? The answer (and the policy response, if one is called for) depends on whether spending is especially high in some places because of insufficient competition and related market failures (Cooper et al. 2019), differences in physician behavior (Cutler et al. 2019), a larger share of people with expensive health conditions (Rosenthal 2012), or a higher cost of living and other factors not directly related to the functioning of health markets.
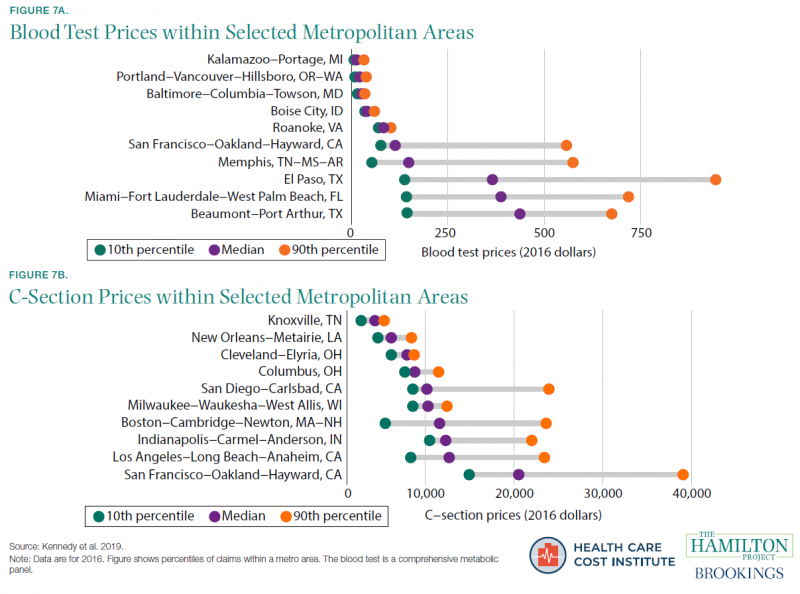
Fact 7: In many cities, health-care prices vary widely for the same service.
In a well-functioning competitive market, prices for the same service will not vary widely within a given place: consumers will avoid a business that charges much higher prices than its competitors. However, many health-care markets dramatically violate this expectation. Figure 7 focuses on health-care price variation within selected metro areas, showing that some metropolitan statistical areas feature much more price variation than others. For example, estimates from the Health Care Cost Institute show that the price for a blood test ranges from $22 (10th percentile) to $37 (90th percentile) in Baltimore, Maryland, but in El Paso, Texas, the same range is $144 to $952. For a C-section delivery, prices vary widely both across and within markets: the 10th to 90th percentile range is 9.3 times larger in the San Francisco, California, metro area than in the Knoxville, Tennessee, metropolitan area.
Some variation in prices is due to differences in quality and amenities: one medical practice might take more time with patients, have nicer facilities, or employ more experienced medical teams, allowing it to charge correspondingly higher prices. But much of the variation is likely related to market imperfections that limit the ability and incentive for patients to shop for the lowest price (Chernew, Dafny, and Pany 2020; Tu and Lauer 2009; Mehrotra et al. 2017).
A Hamilton Project proposal by Michael Chernew, Leemore Dafny, and Maximilian Pany (2020) would address this type of health-care price dispersion with regulatory interventions directed at the most egregious price growth.
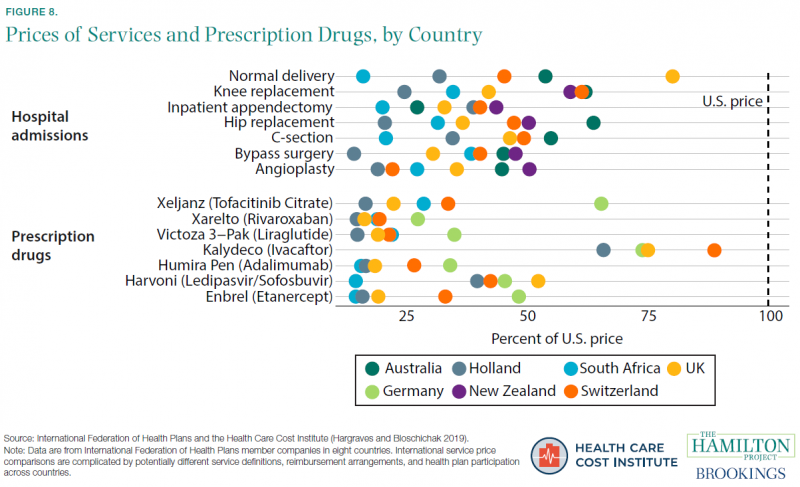
Fact 8: The United States pays more for health-care services than other advanced economies.
The United States has dramatically higher health-care prices than other advanced economies. This is the case for surgical procedures, diagnostic tests, prescription drugs, and almost any other type of health-care service. Figure 8 shows seven other countries’ prices, as a percentage of the U.S. price, for selected health-care services (Hargraves and Bloschichak 2019). For example, a Humira Pen costs between 16 percent (South Africa) and 35 percent (Germany) of the U.S. average price.
Relatively high U.S. prices are not just about higher prescription drug prices (the bottom panel of figure 8) and the implicit subsidies that the United States provides to the rest of the world (much of which imposes price controls on prescription drugs) by paying the fixed costs of drug research and development (Wagner and McCarthy 2004). The United States also has higher prices for outpatient procedures like colonoscopies, MRIs, and cardiac catheterization, and hospital procedures like C-sections and bypass surgeries (Hargraves and Bloschichak 2019). For example, a hip replacement surgery costs between 21 percent (Holland) and 64 percent (Australia) of the average price in the United States.[14] These patterns are consistent with research showing that high U.S. prices are an important part of high U.S. spending on health care (Papanicolas, Woskie, and Jha 2018).[15]
High prices indicate underlying concerns that are different than those indicated by high use of health care. In particular, prices so far above those in other countries can reflect rents (i.e., payments to the health-care system beyond what is necessary for a normal rate of profit). These rents are driven by market imperfections including provider market power and the difficulty that health-care patients and other payers have in assessing prices and quality (Chernew, Dafny, and Pany 2020). In addition, excess administrative costs (see fact 10) and generally higher wages for highly educated workers in the United States contribute to relatively high U.S. prices.
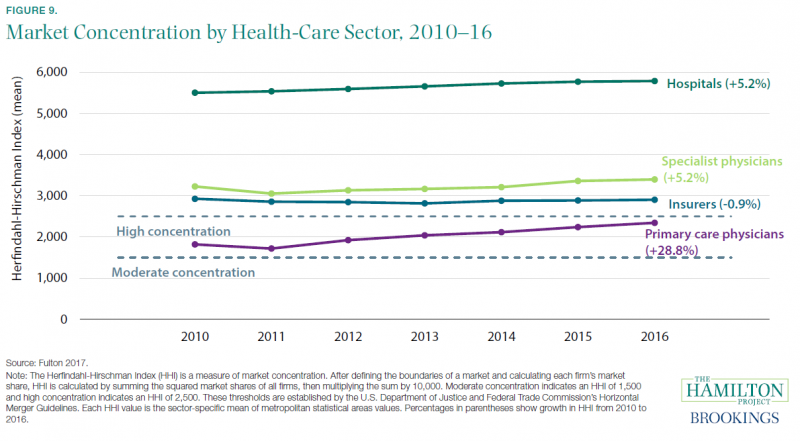
Fact 9: Market concentration is high for specialist physicians, insurers, and especially hospitals.
One reason for high prices and high health-care costs is that competition is unusually weak in the health-care system. Consolidation of medical providers, barriers to market entry, and the closing of some hospitals have led to high and rising market concentration, which allows providers to set higher prices without losing patients.
Figure 9 describes this situation in terms of a commonly used concentration metric called the Herfindahl-Hirschman Index (HHI). This index captures the degree to which market share is concentrated in a few organizations, and it is an important assessment tool for antitrust policy. Under the Department of Justice/Federal Trade Commission Merger Guidelines, an HHI of 1,500 indicates a moderately concerning concentration level, and an HHI of 2,500 indicates high concentration. As shown in the figure, insurers, specialist physicians, and hospitals are all above this latter threshold, with hospital concentration especially high (with an HHI of 5,790 in 2016). Primary care physicians are between the moderate and high concentration levels, but they have experienced a rapid increase in HHI as private practices have been acquired (Capps, Dranove, and Ody 2017; Capps, Dranove, and Ody 2018; Fulton 2017).
Figure 9 shows mean HHI across metropolitan areas, rather than the national level. It therefore does not increase when a hospital in New York merges with a hospital in California, for example. While this is appropriate for understanding the range of choices available to a patient, it does not capture the deleterious effects of consolidations across geographic areas (Dafny, Ho, and Lee 2019; Lewis and Pflum 2017). As explained in Gaynor (2020), hospitals that consolidate across areas gain leverage in negotiations with insurers, who prefer to offer large employers a health plan that includes many provider options throughout the United States.
Reversing consolidation that has already occurred is likely to be difficult. But policymakers can take steps to prevent additional consolidation—and promote competition in other ways—as described in a Hamilton Project proposal by Martin Gaynor (2020).
Fact 10: U.S. health-care administrative costs are the highest of all advanced economies.
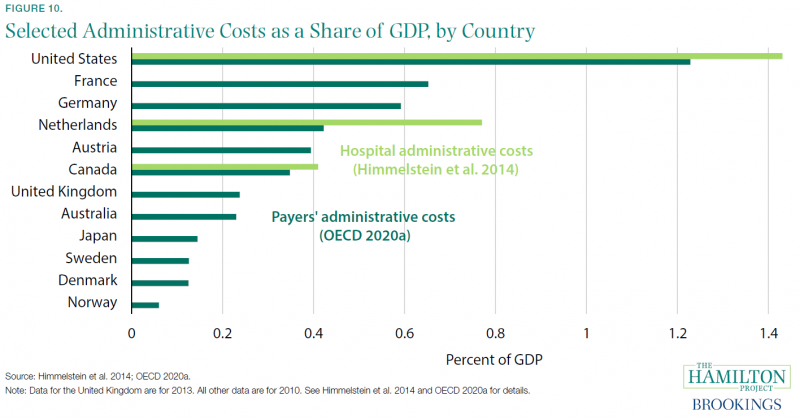
Administrative health-care costs are higher as a share of GDP in the United States than in other countries. These administrative (i.e., nonclinical) costs take several forms: claims processing and payment, prior authorization and eligibility determinations, and quality measurement, among others. While a certain amount of this administrative expense is inevitable and necessary for a well-functioning system, public or private, the excess of U.S. costs over those of other advanced economies is part of the explanation for high U.S. health-care costs overall (Cutler and Ly 2011).
Figure 10 shows two different estimates of administrative costs in the health-care systems of the United States and several other countries. The OECD estimates include only payers’ costs to administer health benefits and coverage, while the estimates by Himmelstein and coauthors include only administrative costs to hospitals (OECD 2020a; Himmelstein et al. 2014).[16] The differences between the United States and other countries are notable. The United States spent 1.4 percent of GDP on hospital administrative costs in 2010, compared with 0.8 percent in the Netherlands and just 0.4 percent in Canada. On the payers’ side the United States is also an outlier, spending 1.2 percent of GDP on payers’ administrative costs, compared with just 0.2 percent in the United Kingdom.
One reason for administrative costs is to reduce non-administrative costs related to excess use of health-care services. For example, prior-authorization requirements can reduce costs and limit use of the most expensive drug options (Soumerai 2004). However, these requirements impose costs on patients and providers that must be taken into account, and in some cases they may simply reflect a battle over who pays for necessary procedures.
Administrative costs cannot and should not be completely eliminated, even in a public system like the United Kingdom’s, but they can be affected by policies and practices. In a Hamilton Project proposal, David Cutler (2020) describes reforms that would reduce administrative costs without impairing important functions of the health-care system.
Fact 11: U.S. physician labor supply is tightly restricted.
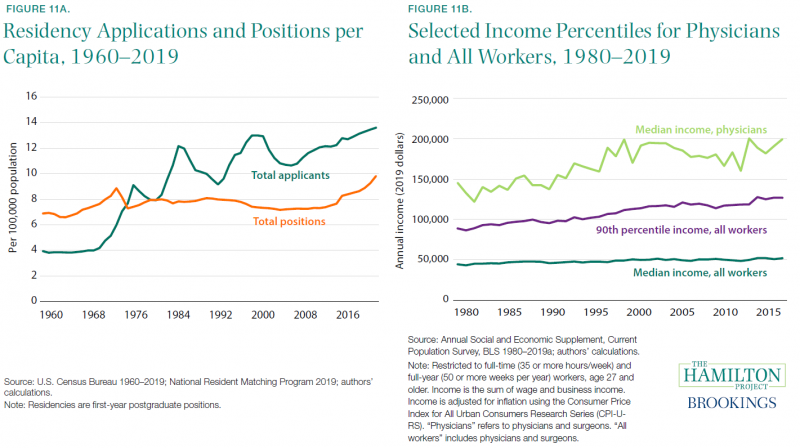
Health-care providers have become a larger share of the labor force, rising from 5.0 percent of employment in 1980 to 8.5 percent in 2019 (BLS 1980–2019b and authors’ calculations).[17] However, labor supply has been limited in important ways. In figure 11a, we show the rate of medical residency positions per 100,000 U.S. residents that were available over the last 60 years. These positions are a necessary part of physician training, required just after medical school. Historically the federal government has heavily subsidized a certain number of residency positions (Heisler et al. 2018); hospitals have been reluctant to provide many residencies without subsidy.
From 1960 through 2010, per capita medical residency positions increased only slightly, rising from 6.9 to 7.4 per 100,000 people. A more rapid increase occurred since 2010 as a number of osteopathic programs entered the data, bringing the rate to 9.8 in 2019 (about 32,000 total positions), but still below the application rate.[18] The flat rate—contrasted with rising expenditures and health-care needs for an aging and richer population—suggests that limited supply has been a problem.
In health-care occupations generally, training requirements have steadily risen. In 2000, for example, physical therapists were required to have either a four-year degree or a master’s degree in every state. By 2015, 43 states required that they obtain a doctorate degree to be legally permitted to practice (Cai and Kleiner 2016).[19]
Limited labor supply contributes to high wages, which in turn contribute to high health-care prices in the United States.[20] As shown in figure 11b, the median annual income of U.S. physicians is $199,500, well above the 90th percentile of overall income ($126,900). In 1980 the typical physician earned 3.27 times the median wage for all workers, compared with 3.84 times today. Growth in physicians’ salaries has coincided with the general rise in inequality at the top of the earnings distribution. In comparison with other advanced economies, U.S. physicians earn considerably higher salaries than their counterparts (Kane et al. 2019; Peterson and Burton 2007).
Fact 12: Surprise billing is associated with high health-care costs.
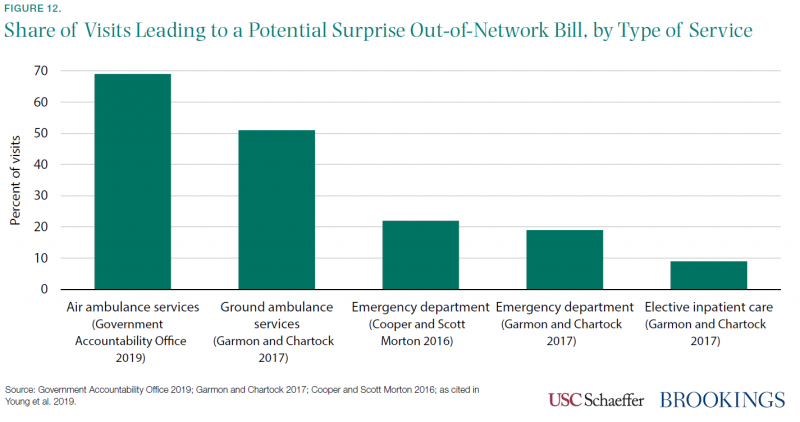
In a well-functioning market, consumers are able to observe price and quality differences between different options. Health-care markets often fail to meet this standard. One striking way in which they fail is a practice called “surprise billing,” when insured patients find out (after receiving health-care services at an in-network facility) that a provider (e.g., a surgeon in the emergency department or the anesthesiologist administering an epidural during childbirth) was outside of their insurance network and is consequently much more expensive than they had anticipated. This raises costs to consumers and also allows providers to charge higher prices than those that were negotiated by insurers, raising overall costs.
Figure 12 shows that surprise billing is very common when patients use ambulance services (51–69 percent) or the emergency department visits (19–22 percent), and somewhat common even when receiving elective hospital care (9 percent).[21] Surprise billing in emergencies presents special problems: patients and their families have little or no ability to compare prices and choose the best option even if they are aware of the prices they face.
Moreover, health insurance cannot function as insurance if patients often incur extraordinarily large (and unexpected) bills when the need for expensive medical procedures arises, nor can insurers bargain down prices on behalf of their beneficiaries. Surprise billing is indeed associated with substantially higher medical bills. According to USC-Brookings Schaeffer Initiative for Health Policy calculations, the medical providers who often have the ability to engage in surprise billing—practitioners in anesthesiology, emergency medicine, diagnostic radiology, and pathology, for example—tend to charge large multiples of Medicare allowed amounts. Mean charges for emergency medicine are 5.4 times higher than Medicare rates, for example, compared with a 2.2 multiple for primary care (Adler et al. 2019), which is more likely to be in-network and have prices negotiated by an insurance plan.
[1] The share of health-care employment refers to the share employed by the health-care industry.
[2] However, see Acemoglu, Finkelstein, and Notowidigdo (2013) for a contrasting view. They find that the income elasticity of health care is likely below one.
[3] This dynamic is referred to as Baumol’s cost disease and reflects the need for service-sector wages to keep pace with rising wages in the sectors with high productivity growth.
[4] These calculations use the Medical Expenditure Panel Survey (MEPS), which excludes long-term care and other components of health-care spending that are included in the national health care expenditure accounts (NHEA) data from Centers for Medicare and Medicaid Services (CMS) used elsewhere in this document. These excluded expenditures could be distributed unevenly across the population and can therefore affect the patterns shown in figures based on MEPS data. For more on a comparison of the types of spending covered in the MEPS and spending covered in the NHEA, which is used in other figures in this document, see Bernard et al. (2012).
[5] High-deductible plans have sometimes been suggested as a way to increase the sensitivity of patients to health-care prices. However, these plans seem to lead patients to reduce their spending indiscriminately, cutting valuable and less-valuable care alike (Brot-Goldberg et al. 2017).
[6] However, it is important not to overemphasize the role of health expenses in generating bankruptcies; recent research suggests that hospitalizations of uninsured adults generate only about 6 percent of bankruptcies for that group (Dobkin et al. 2018).
[7] Data are for 2014, the most recent year for which spending data by age are available from CMS, and are adjusted to 2018 dollars using the GDP chain price index. These per capita costs are for personal health-care spending, which is a subset of the total spending presented in figure 1a and excludes government administration, net cost of health insurance (the difference between the premiums paid for private health insurance and the amount paid for benefits), government public health activities, and investment in research and structures.
[8] This calculation focuses on the 1980 to 2014 period, rather than 1980 to 2018, due to limited data on spending by age.
[9] This estimate for the United States is slightly lower than that shown in figure A, which is based on data from CMS.
[10] This comparison excludes Italy, which is not included in Papanicolas, Woskie, and Jha (2018).
[11] In the MEPS, which excludes long-term care and other components of health-care spending that are included in the national health care expenditure accounts data from CMS, both out-of-pocket and total spending on prescriptions are roughly 25 percent of total out-of-pocket spending and total expenditures, respectively.
[12] The MEPS excludes long-term care and other components of health-care spending that are included in the national health care expenditure accounts data from CMS used elsewhere in this document. These excluded expenditures are likely distributed unevenly across the population and can therefore affect the patterns shown in figures based on MEPS data. For more on a comparison of the types of spending covered in the MEPS and spending covered in the NHEA, which is used in other figures in this document, see Bernard et al. (2012).
[13] It is not always clear in advance that such care is end-of-life—in other words, the hope is that patients will recover as a result of the care. As such, the amount spent knowingly at the end of life is even lower (Einav et al. 2018).
[14] It is not surprising that the United States has higher prices than poorer countries. The Balassa-Samuelson effect notes that high-income countries have higher prices for non-traded goods and services (like health care) than low-income countries (Balassa 1964; Samuelson 1964). But the Balassa-Samuelson effect does not predict much variation among high-income countries, and yet the United States is clearly at the upper end of the price distribution for health care.
[15] Other studies of international price differences have sometimes found the United States to be less of an outlier, but still high. For example, one survey found that U.S. hospital service prices are only 30 percent higher than the OECD average and just slightly above those of countries like Canada and Austria (Lorenzoni and Koechlin 2017).
[16] Neither of these estimates includes administrative costs to providers. Thus, these calculations embody a different accounting of administrative costs than is cited in Cutler (2020), and the estimated fractions of health-care expenditures are substantially lower.
[17] Health-care providers’ share of the labor force refers to health-care occupations.
[18] As described by the American Medical Association, “The number of available first-year (PGY-1) positions rose to 32,194, an increase of 1,962 (6.5 percent) over the prior year. That increase in opportunity reflects the growth in the number of osteopathic programs joining the Main Residency Match as a result of the ongoing transition to a single accreditation system for graduate medical education (GME) programs” (Murphy 2019).
[19] Calculation courtesy of Morris Kleiner.
[20] However, it is less clear what limited health-care labor supply implies for service use, which may diminish when labor supply is restricted.
[21] Surprise billing is also more likely when a health plan has no in-network options at a hospital in a particular provider category. In a study of Texas hospitals, between 21 percent and 56 percent of in-network hospitals had no in-network emergency physicians, depending on the health plan (Hall et al. 2016, citing Center for Public Policy Priorities 2014).