
Since early 2020, there have been extraordinary disruptions across all sectors of the economy. This set of nine economic facts about the service sector in the United States illustrates recent trends in spending, employment, and inflation as the country continues to rebalance. We find that the effects of the pandemic linger: only in recent months has activity in the service sector recovered to pre-pandemic levels. Nonetheless, activity is still well below where it was expected to be in the absence of the pandemic, and further recovery is expected.
Recent changes in real services and goods spending have been extraordinary (figure A). With the onset of the pandemic, real spending on services shrunk by 20 percent between February and April 2020. Spending partly bounced back in the third quarter, with consumption of services in September just 8 percent below pre-pandemic levels. Since the fourth quarter of 2020, spending on services has grown 1.7 percent each quarter, on average. Nonetheless, a simple extrapolation of the pre-pandemic trend in services spending shows that it is still well below trend. In contrast, spending on consumer goods soared after a brief contraction. Since June 2020, real spending on goods has been well above trend—as high as 15 percent in March 2021, relative to the trend from 2018 to 2019. More recently, spending on goods has come down—to 6 percent above trend in July 2022—as consumers have rebalanced the composition of spending closer to historical patterns. The combination of rising spending on services, spurred by pent-up demand and strong household finances, and firms facing challenges in increasing hiring has meant upward pressure on wages and prices.
Today, four out of five American workers in the private sector are employed in the service economy, doing everything from delivering care in hospitals and nursing homes to making and serving food to ensuring products make it from ports to store shelves and into consumers’ hands. Since 2020, changes in employment in the services and goods sectors (figure B) have moved more similarly than have changes in spending in these sectors. Early in 2020, employment in the services sector fell 17 percent, while employment in the goods sector fell only modestly less, by 12 percent. And employment has only just recovered to pre-pandemic levels in recent months. To be sure, the decline in services employment was far larger than in the goods sector, but that mostly reflected that the service sector has grown to be much larger. Goods sector employment peaked at 25 million in 1979. In that year, service-sector employment was already higher at 49 million; since then, it has grown to be 109 million.
After withstanding a seismic and unprecedented shock in early 2020, spending and employment in the service sector has continued to recover, and further recovery is expected. It took until the spring of 2022 for the service sector to recover to pre-pandemic levels in both real spending and employment. In addition, the onset and aftermath of the COVID-19 pandemic has highlighted disparities in jobs throughout the service sector: some face-to-face service workers faced poor working conditions in jobs with little room for advancement, while other workers in certain professional services were afforded new flexibility, like working remotely. Trends in employment growth may follow; as we show in these facts, employment in leisure and hospitality has lagged other sectors, including professional services.
For decades the service sector has driven the economy and the recent rebound in the service sector continues to drive economic growth. What role is there for policy in sustaining this growth? The Hamilton Project has published a policy proposal by Dani Rodrik (Harvard University) that lays out how a modern industrial policy framework should create more “good jobs” by improving productivity and labor income growth for service-sector workers (Rodrik 2022). Is there a role for industrial policy to help create a more resilient, productive economy? And can this industrial policy focus not only on manufacturing but also on the service sector and service-sector workers? The proposal argues that the answer to both questions is yes.
This set of economic facts about the service sector in the United States explores how the service-sector recovery has differed from prior business cycles (fact 1 and fact 2); how spending, employment, wages, and the nature of work in different industries within the service sector are changing (fact 3, fact 4, fact 5, fact 6, and fact 7); and the trajectory of inflation (fact 8 and fact 9).
Fact 1: Recovery in the demand for services has lagged behind recent business cycles.
The immediate period following a business cycle peak has historically been marked by initial weakness in goods spending, while services spending typically has been little affected. In other words, the recent hallmark of a recession was that consumers delayed purchases of goods and particularly purchases of durable goods. This pattern is evident following the peaks in 1981, 1990, and 2008 as shown in figure 1, although less evident in the 2001 recession.
The composition of spending during the COVID-19 recession has been quite different relative to other periods. In the 14 months leading into the pandemic, annualized growth in real spending was 1.9 percent for services and 4.4 percent for goods, roughly consistent with prior business cycles. In 2020, after brief, sharp declines in both types of spending, goods spending soared while services spending remained well below its pre-pandemic peak. Goods spending peaked at 20 percent above its pre-pandemic level in March 2021. And, a year-and-a-half into the recovery, real consumption of goods has slowed down. In prior cycles, this is when goods consumption started to pick up.
Pandemic-related health risks significantly dampened demand for face-to-face services, leading to a more than 20 percent decline in real services spending by April 2020. Since early 2021, real spending on services has slowly recovered, and as of July 2022 is above its pre-pandemic level. However, it remains roughly 3 percent below its pre-existing trend; moreover because of the surge in goods spending, the share of total spending on services is 4 percentage points below its average in the decade before the pandemic.
Fact 2. Leisure and hospitality, transportation, and health services saw the largest declines in demand.
Service industries were most affected by the pullback in spending in early 2020: consumers interact face-to-face with many businesses in the service sector and health risks limited many of those interactions. What sectors drove the overall decline in real consumption of services during the COVID-19 recession described in fact 1? In April 2020, recreation, food and accommodation, transportation, and health care contributed the most to the initial 20 percent decline in the real consumption of services (figure 2).
Spending on food and accommodation reached its pre-pandemic level in September 2021, with the recovery being driven by restaurants. Real spending on food services had exceeded pre-pandemic levels by 5 percent by July 2022, the same month that spending on accommodations only first ticked above its pre-pandemic level. Spending on health-care services has not yet recovered, though it is approaching pre-pandemic levels. While surprising in the midst of a pandemic, many consumers had postponed preventative care and elective procedures.
Spending on recreation and transportation services also reflect early pullbacks in spending on in-person activities, initially falling by nearly 60 percent and 50 percent, respectively. Spending steadily increased in these categories over 2021 but then plateaued in the first half of 2022. In July 2022 real spending on recreation and transportation services were each roughly 10 percent below their pre-pandemic levels.
Fact 3. Small businesses in most industries reported that issues with hiring workers eclipsed other problems.
Figure 3 shows significant variation in the kinds of problems small businesses in different sectors have reported in the Census Bureau’s Small Business Pulse Survey. Over the past few years, small businesses have reported that they have been affected at times by labor shortages as well as supply chain and logistic issues. However, the ability to hire all the workers they wanted has remained the most commonly reported issue for a majority of sectors through April 2022.
Since August 2021, food service businesses have consistently reported the most difficulties in hiring workers with 50 to 70 percent of businesses sayings it’s a problem. In other sectors, including manufacturing and health care, roughly 40 percent reported trouble hiring. A July 2022 survey from the National Federation of Independent Businesses (NFIB) found that about 50 percent of small business owners reported difficulties in filling job openings, roughly 20 percentage points above the historical average (Dunkelberg and Wade 2022). Firms’ difficulty hiring workers is likely to slow down the recovery of service-sector businesses, which are relatively labor intensive.
Many small businesses also reported difficulties with the availability of supplies or inputs. This was particularly true for small businesses in manufacturing, construction, and retail, with roughly 50 percent of businesses in each industry reporting trouble with supplies and inputs in the Pulse Survey. In addition, significant shares of manufacturing firms experienced both production delays and delays in delivering products to customers. Inheriting some of those production delays, wholesale distributors also showed issues with delayed deliveries. It does not appear those issues have waned in recent months. The July NFIB report found that roughly 30 percent of businesses reported that supply-chain disruptions had significantly affected their businesses, nearly identical to the national average in the Pulse Survey in April.

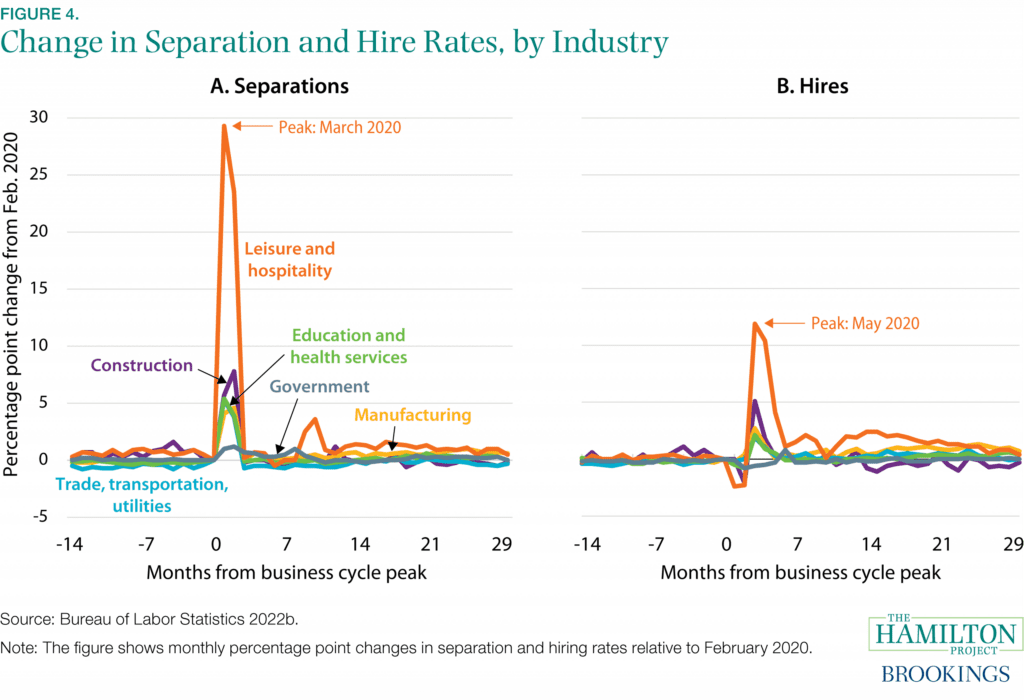
Fact 4. Separations and hires remain elevated in leisure and hospitality.
March and April 2020 saw record-high job separations across all service industries, particularly in leisure and hospitality. This was followed by a hiring spike in May and June of 2020. Since the first few months of the pandemic, separations and hires in most sectors higher than but closer to their pre-pandemic levels, with a few notable exceptions: leisure and hospitality, in which separations and hires both remain elevated, manufacturing (elevated hiring) and construction (depressed hiring).
Over the course of the pandemic, employment churn—the combination of separations and hiring—has been highest in industries that are more likely to require in-person work (Stevenson 2021). In leisure and hospitality, the net result of both high quit rates and high hiring rates has been a significant employment shortfall: employment was still 1.2 million below its pre-pandemic level in August 2022. That is far and away the largest shortfall in any industry. As demand for those services continues to recover, job openings remain significantly elevated. After reaching nearly 2 million in December 2021, leisure and hospitality openings have moderated only slightly, to around 1.5 million openings since April of this year.
Other face-to-face industries that have been significantly affected are education (public and private) and health care. In the private sector, the combined industries of education and health care saw a jump in separations in March and April 2020 of more than 5 percentage points over their pre-pandemic separations rate. The rate of hiring in private education and health services has been elevated since the summer of 2021, yet in August 2022, employment in those industries remained just shy of their combined pre-pandemic level and well below prior trend. In addition, as figure 4 shows, employers in the health care and education sectors reported significant difficulty in hiring.
In the government sector, the increase in separations was smaller but much more persistent, lasting through fall of 2020, largely because of drawn-out separations in state and local education employment. The rate of hires for those in government has been noisy but generally elevated since 2021. Nonetheless, in August 2022 employment in the government sector remained nearly 3 percent below its February 2020 level, with roughly half of that shortfall accounted for by local government educational services.
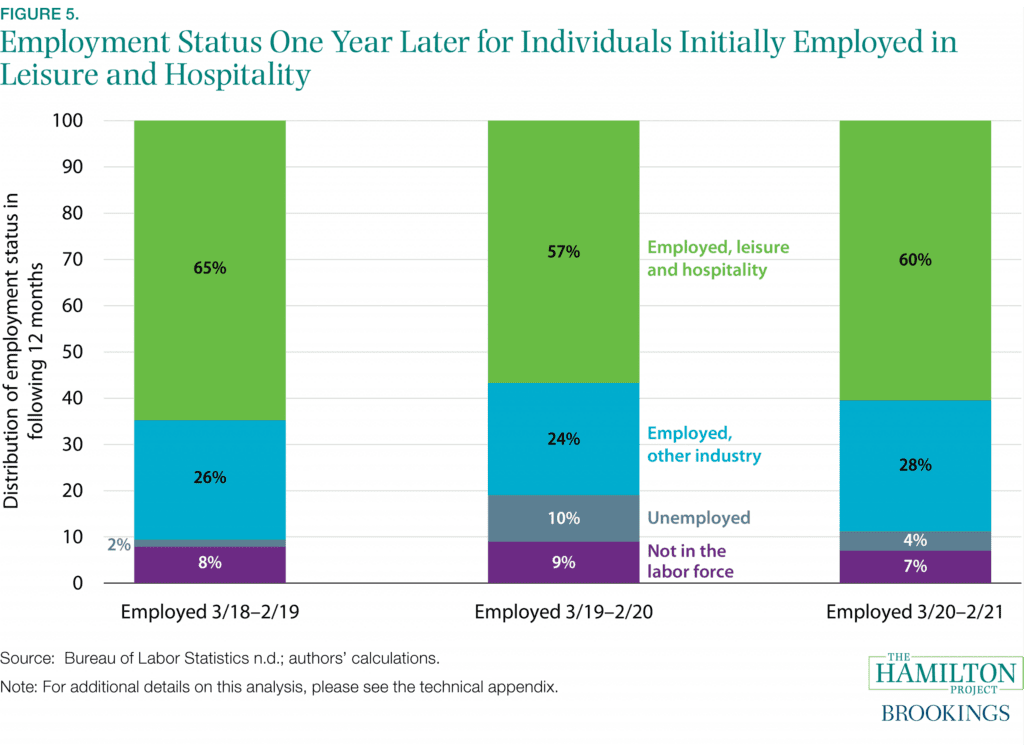
Fact 5. The majority of individuals employed in leisure and hospitality in the year before the pandemic were still employed in that sector one year later.
Panel data from the Current Population Survey show that for those employed in leisure and hospitality from March 2018 to February 2019, from March 2019 to February 2020 (the 12 months before the pandemic), or from March 2020 to February 2021, the majority remained employed in that sector in the following year. The survey allows researchers to track some people over 16-month periods. Among those respondents who can be observed over the entire period, 57 percent of those who reported being employed in leisure and hospitality the year before the pandemic were employed in leisure and hospitality the following year, 24 percent were employed in another industry, 10 percent were unemployed, and 9 percent were no longer in the labor force (shown in middle bar of figure 5).
A comparison of that period shown in the middle bar, which shows changes from the year before the pandemic to the year after its onset, to other periods is instructive. Relative to the two-year period before the pandemic (the first bar) and the two-year period after its onset (the last bar), the rate that leisure and hospitality workers became unemployed was elevated. However, other trends were remarkably close across periods. Even more surprising, among people who were employed in the second year of the observation period, the share leaving the leisure and hospitality industry are remarkably similar. The consistency is surprising given that the 2020–21 period was marked by increased health risks and other difficulties of working in the leisure and hospitality industry as well as the strong demand among employers in other sectors.
Another survey, of long-tenured displaced workers, shows that through January 2022, labor market outcomes were less positive for those who had been employed in the leisure and hospitality industry at the same employer for three or more years (BLS 2022c). Those long-tenured workers are generally older and have other less typical characteristics in an industry marked by significant churn. Among them, 64 percent were reemployed, 13 percent were unemployed, and 22 percent had left the labor market.
Fact 6. In 2022, the largest wage gains occurred in leisure and hospitality.
From 2014 to 2019 and in 2020, real wage growth in every industry was, on average, positive. From 2020 to 2021, real wage growth was slightly positive for service-sector workers overall, driven by positive real wage growth in leisure and hospitality, retail, and “other services;” at the same time, it was negative over this period in the goods sector. Extending the period through the most recent data in 2022Q2, real wage growth since 2020 has been negative, on average, for private workers across sectors (purple bars in figure 6). Since mid-2021, rising inflation has undercut the gains in real wages over the first year of the pandemic.
Two industries show positive real wage gains from 2020 to 2022Q2: leisure and hospitality (1.3 percent at an annualized rate) and retail trade (0.6 percent). However, those gains are smaller than in the 2014–19 period: 1.8 percent and 1.6 percent, respectively, for those sectors.
Surprisingly, the patten of real wage gains appears to have only a modest relationship with which industries are having hiring difficulties or which industries have elevated hiring. On the one hand, leisure and hospitality does indeed show that elevated hiring and difficulties in hiring have been associated with higher wages. Perhaps the relatively low level of difficulty in hiring among retail firms is a result of strong wage gains. On the other hand, manufacturers also have elevated hiring and difficulties in hiring, and yet real wage gains have been sharpy negative. In addition, health-care firms also report difficulties in hiring and show negative real wage gains.

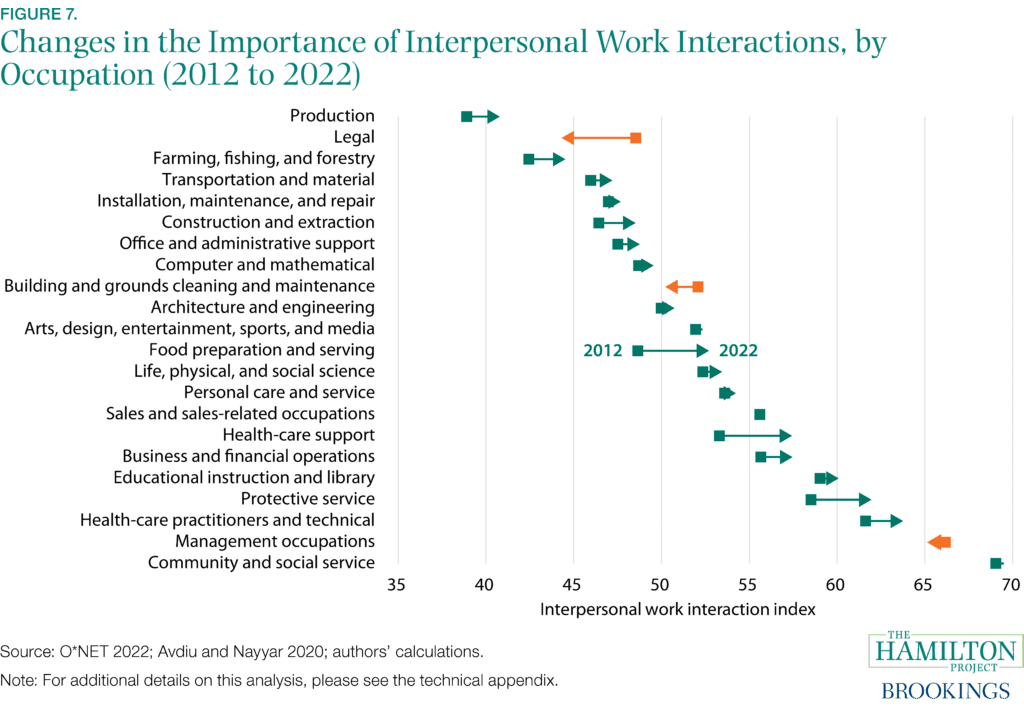
Fact 7. In most occupations, the importance of interpersonal interactions has grown.
O*NET survey data show that over the past 10 years, the prominence of job tasks that include interpersonal interactions has increased for nearly all occupations. These tasks include assisting or caring for others, resolving conflicts and negotiating with others, and training and teaching others. Indeed, prior research has found that, relative to 1980, service and social tasks in jobs associated with soft or noncognitive skills have increased dramatically and critical thinking skills have increased while routine and math tasks have fallen or plateaued (Autor, Levy, and Murnane 2003; Acemoglu and Autor 2011; Deming 2015; Schanzenbach et al. 2016; Atalay et al. 2018; Hershbein and Kahn 2018).
Although the increases in the importance of interpersonal interactions were not limited to occupations generally associated with the service sector, service-sector occupations saw the largest increases. For example, figure 7 shows the two occupations that saw particularly large increases in the importance of such activities were health-care support and food preparation and serving. Increasing importance of interpersonal interactions is likely to continue: Deloitte reports that by 2030, soft skilled-intensive occupations will account for two-thirds of jobs, putting such skills further in demand (Deloitte 2019; Cengage 2019). According to Microsoft’s 2021 Work Trends Index, interpersonal interactions increase productivity and lead to more innovation through strategic thinking, collaborating with others, and proposing new ideas (Microsoft 2021).
How will the prominence of interpersonal tasks interact with the increasing prevalence and preference for remote work, spurred by the pandemic? The relationship between home-based work and the importance of interpersonal tasks extends beyond face-to-face interactions, with this relationship varying considerably across occupations (Avdiu and Nayyar 2020). Developing interpersonal relationships with clients, customers, and colleagues may look different in a world in which work tasks demand interpersonal interactions but more service-sector jobs are remote.
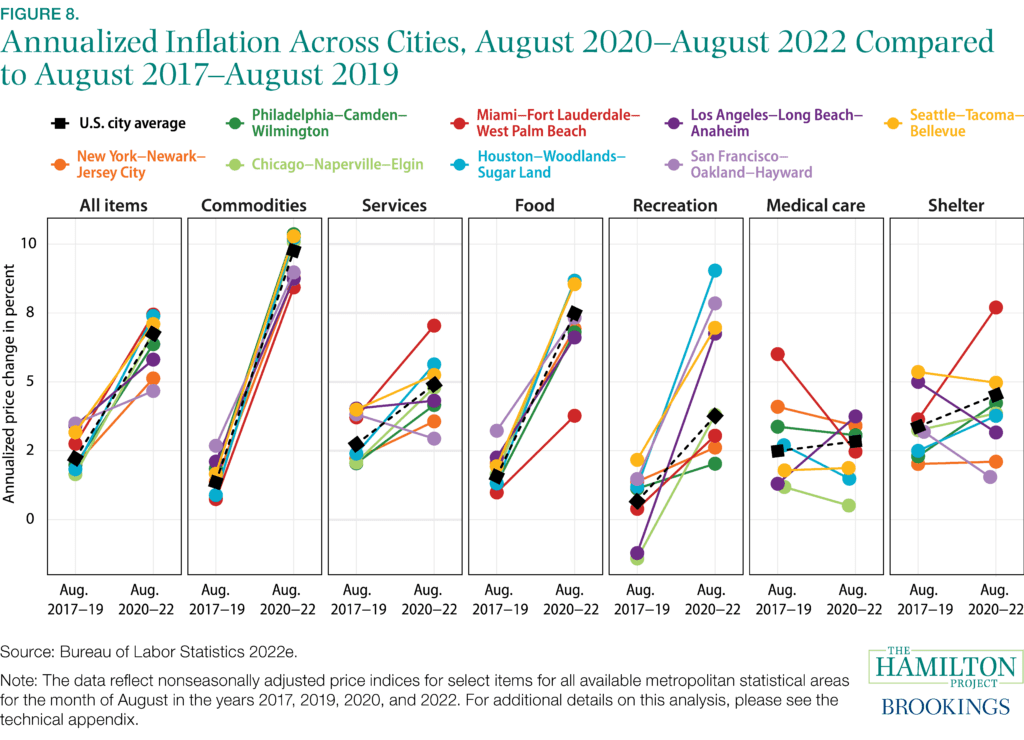
Fact 8. The trajectory of inflation differs by sector and location.
During the pandemic, as consumer spending shifted away from services and towards goods and the sector was plagued by supply constraints, goods inflation jumped in cities throughout the country (Stone 2022). As shown in the second panel of figure 8, the annualized rate of inflation for commodities (goods) spiked between the August 2017–August 2019 and August 2020–August 2022 periods. Across seven select (and generally representative) metropolitan areas, the increases ranged from 7 to 9 percentage points; on average across US cities, the rate rose by more than 8 percentage points, from 1.4 percent to 9.8 percent.
Services inflation also rose on average, but the third panel shows that the increases were smaller than in commodities and showed more variation across places. In fact, services inflation fell in San Francisco and was roughly unchanged in Los Angeles, likely driven by reductions in shelter inflation as shown in the seventh panel. (However, fact 9 suggests that the Consumer Price Index (CPI) inflation measure of shelter is slow to pick up price increases and a pickup in shelter inflation may be on the horizon in cities that have so far seen little inflation in this area.) Six other metropolitan areas saw increases in services inflation ranging from 1.3 percentage points in Seattle to 3.3 percentage points in the Miami area.
On average across US cities, food services inflation jumped 5.9 percentage points, with prices rising more for food consumed at home than prices at restaurants and other outside businesses. However, the increases varied considerably across cities, from a low of 2.8 percentage points in Miami to 7.4 percentage points in Houston. In recreation, increases in inflation ranged between 0.9 and 8.0 percentage points. Medical services inflation remained stable or declined modestly except in Los Angeles, Philadelphia, and Seattle.
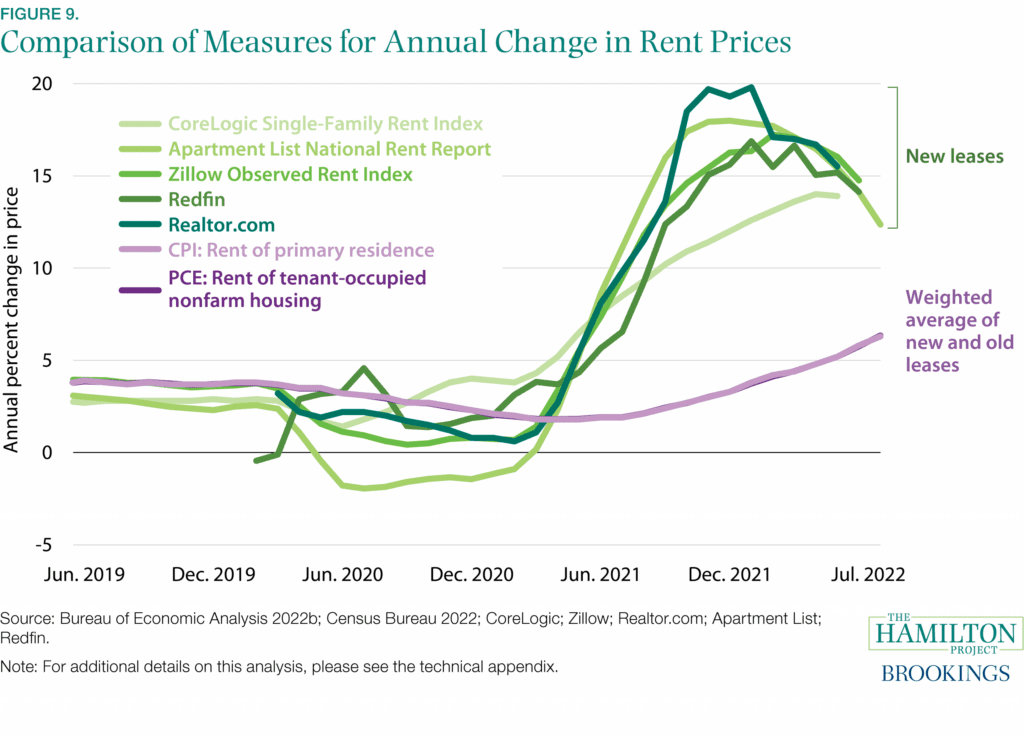
Fact 9. New leases are driving housing services inflation.
According to multiple measures of rental prices, inflation in the housing market was depressed at the start of the pandemic but has since risen above pre-pandemic levels (figure 9). Inflation measures from the CPI and the Personal Consumption Expenditures Price Index (PCE), which reflect changes in rent costs for the average tenant, fell from a roughly 3.5 percent annualized rate in 2019 to lows of around 2 percent in mid-2021. However, growth has rebounded since then: as of summer 2022, the 12-month change in both measures exceeded 5 percent. Because leases are typically set for a year, rapid acceleration in rents for new leases affects average rents only as the new leases are incorporated. Thus, changes in CPI and PCE housing inflation generally lag other measures that show price changes only for new leases (Ambrose, Coulson, and Yoshida 2020).
Even for more timely measures capturing new leases, most indices show that the 12-month change in prices of new leases was falling during the first year of the pandemic. Rates then skyrocketed in 2021, well before the CPI and PCE measures began to increase. Although these new-lease rental inflation measures have come down somewhat in recent months, they remain well above the CPI and PCE measures. Because housing costs are a large portion of spending on services as measured in both the CPI and the PCE inflation measures, rising rents—and house prices—are already putting significant upward pressure on overall inflation. Of the 8.5 percent annual increase in CPI inflation and the 6.3 percent increase in PCE inflation in July 2022, housing cost inflation contributed roughly 2 percentage points and 1 percentage point, respectively (with differences due to methodology and weighting). The measures shown here suggest that those contributions will become larger over the coming months as more recent new leases are incorporated.
To be sure, not all cities have experienced swings in rental inflation to the same degree. Notably, New York City rental prices fell 22 percent between November 2019 and November 2020, but then surged 33 percent over the 12 months ending December 2021, according to Apartment List. In contrast, Kansas City, MO, rental prices rose 1 percent between November 2019 and November 2020, and increased 9 percent between December 2020 and December 2021.
View the full report, including the technical appendix and references.