The passage of historic climate legislation in the past year—both the Infrastructure Investment and Jobs Act (IIJA) and the Inflation Reduction Act (IRA)—could lead to a revolution in clean energy generation in the United States. These federal resources have the potential to accelerate a broad energy transition; but, that transition will only be successful if we grapple with technical challenges and infrastructure issues inherent to the current energy system.
This set of facts elevates key energy system characteristics, especially within electricity production, that will be consequential to the clean energy transition in the near term and merit policymaker attention. Electricity production is not only the focus of recent legislation but also where evolving technologies will deliver the most rapid change, and where—because of the system’s highly regulated nature—that change is likely to encounter the greatest limitations. During this rapid evolution, the electricity system must reliably meet the fundamental challenge that electricity generation and consumption must be equal at all times to keep the grid in balance.
The anticipated pace and scale of building energy infrastructure over the next two decades is much greater than anything the US experienced since at least the 1970s, when modern planning and administrative processes for domestic energy infrastructure began to proliferate. We highlight key concerns regarding today’s technologies and processes that policymakers will need to monitor and address as the energy infrastructure build-out gathers momentum.
One significant challenge is that new ways of generating energy interact with infrastructure and regulatory approaches created for an era when demand for power was growing rapidly and the best way to meet that demand was through constructing very large fossil-fired power plants. The relationships between new ways of generating energy, the current and future pace of change, and legacy infrastructure create conflict and challenges. As the US seeks to increase capacity, the differing characteristics of utility-scale, community-sized, and customer-sited clean energy options need to be taken into account. Furthermore, characteristics of clean energy generation itself—such as different kinds of economies of scale in production and more seasonal variation in generation—need to be considered as the US seeks to increase capacity.
We argue that an overarching reality and the great challenge of the next decade of US climate policymaking will be for lawmakers and regulators to remove existing barriers to clean energy infrastructure deployment. More money for investment and innovation is necessary but will not be enough. Fully realizing the promise of the clean energy transition for US economic growth, jobs, and prosperity will require developing solutions that remove the choke points created by the existing infrastructure and regulatory systems and deploying both new clean energy generation and the systems required to connect these new energy sources to electricity consumers.
Fact 1: For the past 20 years, electricity consumption has been flat.
Total electricity consumed has been roughly flat for the past 20 years after the “electrification” of America, introducing electricity to all homes and businesses, was largely complete. As shown in figure 1, total electricity consumption in the residential and commercial sectors outstripped consumption in the industrial sector. Roughly stable residential electricity consumption has occurred even as technology usage in homes has increased, homes have gotten larger, and the population has grown. That is because growth in demand for electricity services has been offset by substantial increases in energy efficiency (EIA n.d.b). Take the example of the advent of LED lightbulbs: A modern 14-watt LED bulb produces around as much illumination of equivalent quality as a 100-watt incandescent bulb (EIA n.d.c.).
In contrast to those recent trends, demand is projected to increase over the coming decades due to the electrification of the vehicle fleet, building space and water heating, and industrial processes. However, greater energy efficiency of electric vehicle (EV) motors and heat pumps relative to the fossil-fuel technologies they are replacing is expected to keep growth in electricity consumption to a modest one to two percent per year (EIA n.d.d.).
Flat electricity consumption in recent decades and the projection of only modest future consumption growth complicate the necessary buildout of zero carbon energy generation as well as the changes to the grid and upgraded transmission corridors necessary to transport energy from where it is produced to where it is needed. In general, capital investment in commodity industries does not occur in the absence of growth. The massive buildout of our current grid and fossil fueled power plant fleet occurred at relatively low cost at a time when growth rates of electricity demand ranged from five percent to as high as ten percent. That grid is now showing its age and will require upgrades to existing infrastructure (US Office of Electricity 2022). We must find a way to induce massive reinvestment in the capital-intensive commodity electricity business with low and potentially no growth in sales, while at the same time maintaining prices that low- and moderate-income Americans can afford.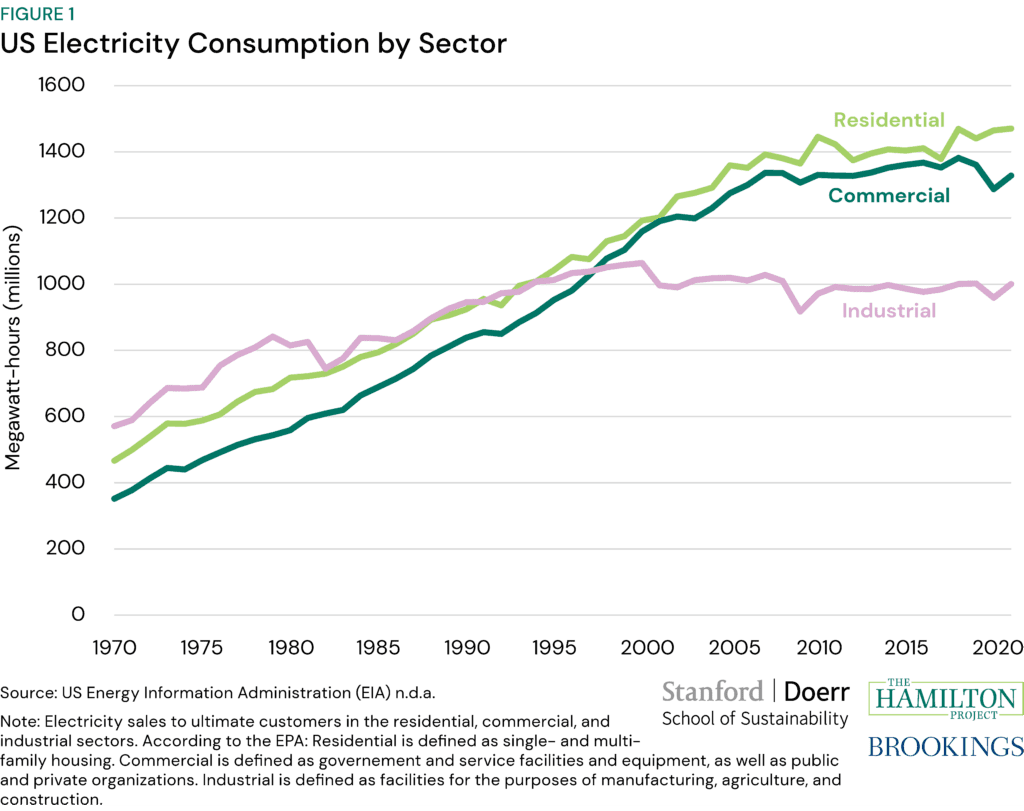
Fact 2. There isn’t one American electricity grid.
The US electricity system is composed of three primary physical systems and various balancing authorities. As shown in figure 2, the three primary physical systems are known as the Western Interconnection (orange), the Eastern Interconnection (green), and the Electricity Reliability Council of Texas (ERCOT, purple; EIA n.d.f.). Each of these three physical grids operates as systems within which electric energy flows freely along paths of least resistance from where it is generated to where it is consumed. There are only limited physical ties between these three systems, with ERCOT opting not to join either the Western or Eastern Interconnection in order to avoid Federal Energy Regulatory Commission (FERC) jurisdiction over its system (FERC 2022).
A complex and highly fragmented economic and contracting structure governs how supply and demand are balanced on timescales from seconds to years within these three physical systems (EIA n.d.f.). Balancing authorities, displayed in the figure as white circles, are tasked by the North American Electric Reliability Corporation (NERC), created after the 2003 blackouts, with maintaining planned flows within and across their borders. In essence, within the physical grids, sub-regions are responsible for maintaining reliability by ensuring that electricity consumption is equal to electricity generation net of imports from and exports to other balancing authorities. Some balancing authorities accomplish this goal via organized wholesale electricity markets while others, generally where utilities are vertically integrated, choose to use non-market mechanisms.
The consequences of this balkanized structure to clean electricity policy are numerous. First, moving energy between systems can be challenging if not impossible. Electrons can’t flow where there aren’t physical connections. Second, even moving energy between balancing authorities within the same system is typically accomplished via high-transaction-cost processes that are far less flexible than adjustments within an individual balancing authority. Frankly, these energy transfers happen at the speed of lawyers, not the speed of light. Third, planning of new transmission assets that cross balancing authority boundaries is complex and often requires multiple approvals that often result in costly, and even sometimes contradictory regulatory requirements. Multiple veto points in a long permitting process routinely delay or even kill proposed interregional transmission projects. Daily and seasonal variation in electricity generation from renewable sources (see Facts 7 and 8) increase the importance of overcoming these barriers in order to reliably balance electricity generation and consumption as renewables continue to increase their shares of the energy mix (see Fact 4).
Fact 3. The U.S. is a net exporter of fossil fuels.
The United States has evolved rapidly from being a large net importer of energy just 20 years ago to being a net exporter since 2019 (figure 3). This dramatic turnaround was created by rapid innovation in oil and gas extraction and the construction of significant liquified natural gas (LNG) export capacity over the past decade (EIA n.d.h.). Despite its role as a key exporter to global oil and gas markets, continued dependence of the US on fossil fuels leaves the nation’s economy vulnerable to global shocks in supply or demand that drive large changes in the price of these globally traded commodities. Supply decisions made by the Organization of the Petroleum Exporting Countries (OPEC+), can ease—or tighten up—the global oil market, triggering large swings in prices.
Natural gas markets have become more global over the past decade with increases in capacity to liquify and transport natural gas. Moving forward, we expect the growth of the LNG market to continue to drive the global convergence of prices, shrinking the discount in natural gas prices paid in the US relative to prices paid in other markets (EIA n.d.i.).
The lesson from the last 15 years of rapid change in global oil and natural gas markets is that while abundant domestic supplies increase our energy security to some extent, true economic resilience to energy shocks comes from lessening our dependence on fossil fuels, prices of which are set in global markets. Over the next decade, we expect to see continued growth in exports of fossil fuels from the United States as our own domestic consumption is gradually displaced by zero carbon alternatives.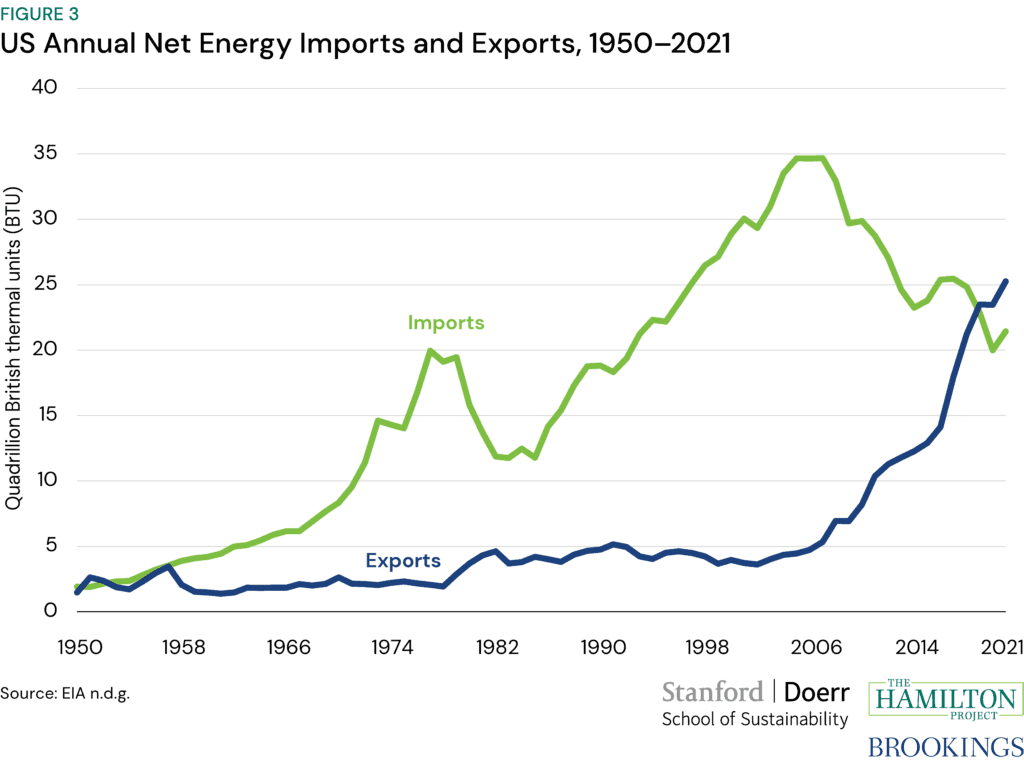
Fact 4. The composition of electricity sources is rapidly changing.
From 2011 to 2022, the composition of electricity sources has changed significantly (figure 4). Net generation from coal fell 52 percent while other sources of energy grew in importance. In particular, the portion of net generation coming from natural gas grew from 25 to 40 percent, becoming the largest US source of electricity. While renewables still made up a smaller share of net generation than coal and natural gas in 2022, the portion of net generation coming from wind, hydropower, utility-scale solar, and other renewables grew by 72 percent between 2011 and 2022 compared to a 61 percent increase in the share from natural gas. Further, total electricity from renewable sources constituted a larger share of net generation in 2022 than either coal or nuclear. Among renewables, wind held the largest share in 2022, at 10 percent. While solar comprised a relatively small share in 2022, three percent; this is orders of magnitude larger than its share in 2011 (EIA n.d.j.).
Substitution within the fossil fuel category to natural gas can in part be attributed to breakthroughs in unconventional natural gas production in the United States, which decreased the price of natural gas relative to coal (Kolstad 2017). Another aspect of the market-driven substitution from coal to natural gas is the converting of coal-fired power plants to burn other fuels, primarily natural gas: more than 121 plants since 2011 (EIA n.d.k.). Furthermore, unconverted coal-fired plants have been increasingly taken offline as older coal units, already less efficient than alternatives, have been required to upgrade their pollution controls to keep operating (EIA n.d.k.).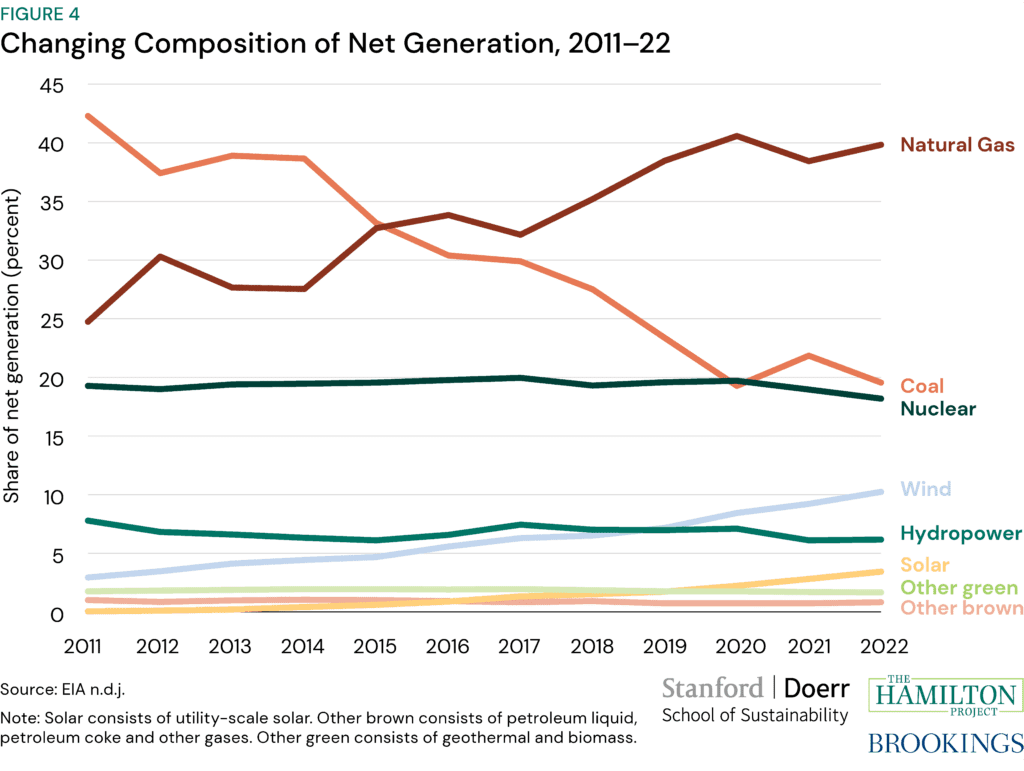
Fact 5. Electricity sources have different models to create economies of scale.
Relative to solar generators of electricity, coal and natural gas facilities generally have larger generation capacity. Figure 5 shows operating projects in the US that use natural gas (brown) and solar (green); the size of each location-centered marker corresponds to the facility’s generation capacity (nameplate capacity). Renewable sources of energy—especially solar energy—generate the bulk of their overall output through a large number of smaller, cheaper units instead of fewer but bigger and more expensive fossil fuel-based plants. The average nameplate capacity of operating solar plants in 2021 was 12 megawatts compared to 115 megawatts for natural gas and 402 megawatts for coal (EIA n.d.e.). Because of this, an energy system fueled increasingly by solar energy has different economies of scale, driven more by the economics of panel production, than one powered by fossil energy, where economies of scale are driven by the size of individual generators.
As shown in Fact 6, there continues to be a rapid increase in the number of solar projects being built across the US. Solar is, on a levelized cost (meaning apples-to-apples) basis, the cheapest source of new energy today and is likely to play a central role in the buildout of a zero-carbon grid. It is cost-effective to have more solar generation because the production costs are lower: although costs can vary substantially based on a variety of factors, the average cost to produce one megawatt-hour of utility-scale solar energy ranges between $28 and $41 compared to between $45 and $74 and between $65 and $152 for the equivalent amount of energy from natural gas and coal, respectively (Lazard 2021). As a result, new construction of solar far outpaces new natural gas plants and there is no new coal under construction in the United States (EIA n.d.e). The growth of solar will need precise planning to fully exploit the benefits of its lower cost while accommodating its intermittency. The map shows concentrations of solar along the coasts and in some higher density intracoastal areas.
The low cost of renewable energy sources like solar energy coupled with the rapid increase in the number of renewable energy generators means that the economies of scale in electricity generation are changing, creating opportunities and—as many of the other facts show—challenges.
Fact 6. In solar, other regions are catching up to the west.
The pace of solar construction has accelerated over the past 15 years. There were 2,000 megawatts of solar energy in 2011 compared to 62,000 megawatts of solar energy in 2021. The rapid expansion of solar generation is due to an increase both in the number of solar projects and the average capacity of new solar projects. There were around 420 solar projects built through 2011, compared to nearly 2,000 in the five-year period from 2012 to 2016 and nearly 3000 in the five-year period from 2017 to 2021. At the same time, across the US, the average capacity of solar projects built through 2011 was four megawatts, compared to 11 megawatts in the five-year period from 2012 to 2016 and 14 megawatts in the five-year period from 2017 to 2021 (EIA n.d.e.). The pace of building has increased as capacity per plant has expanded, and construction costs have shrunk (EIA n.d.l.).
As shown in figure 6, some regions that had only a modest amount of solar capacity through 2016 saw significant increase in generation over the next five years, narrowing the regional dispersion in investment in solar generation. In 2016, the Southeast region had 4,000 megawatts of solar power; by 2021 that increased to over 18,000, surpassing California, Texas and the rest of the Far West and Southwest regions (EIA n.d.e.). In some but not all states, rooftop solar, not included in this figure, has also contributed significantly to the growth of solar capacity over this time interval.
The rapid pace in solar project construction has created challenges in some regions because the energy grid and the regulatory process that governs it was designed for a small number of large projects. The Plains, for example, had more than eight times the pace of building in 2017-2021 than in the prior five-year period (and indeed the first solar generator in this region was built in 2013; EIA n.d.e.). The result is that projects in the region are struggling to connect to the energy grid: the Midcontinent Independent System Operator’s (MISO) interconnection queue, comprised of various small projects requesting to connect to the grid in the Midwest, is growing beyond the grid’s capacity to allow new projects without network upgrades and is thus slow to bring online the new solar energy generation (Lydersen 2020). Nonetheless, the increase in building and the relative increase in the maximum possible capacity per generator has meant a significant increase in overall solar energy generation.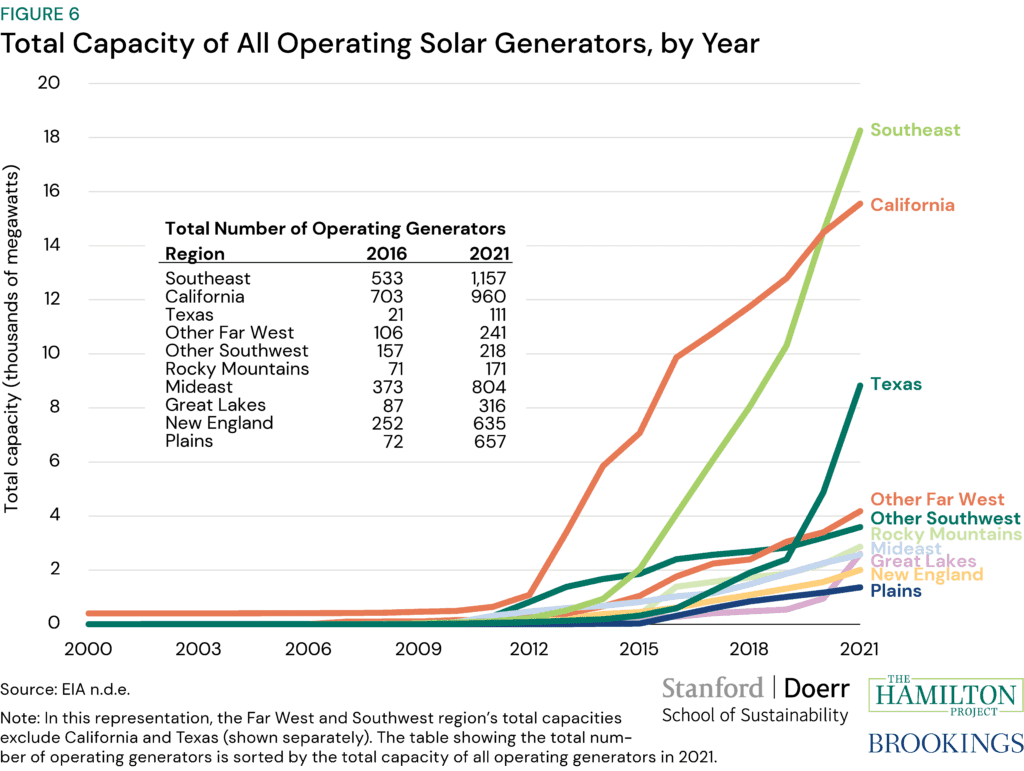
Fact 7. The more green electricity generation is in the mix, the more seasonal the production will be.
All electricity supply fluctuates seasonally. Figure 7 shows, for each energy source, the change in electricity generation each month in 2022 relative to January of that year. Some of this seasonal variation can be attributed to changes in demand throughout the year. In particular, seasonal changes in natural gas and coal production (brown and orange lines) track changes in overall electricity consumption (purple line). Solar generation, in contrast, varies due to changes in solar insolation, and experiences by far the highest seasonal variation with solar generators producing larger quantities of energy in the summer months and lower levels in the winter months (top green line). To a lesser degree, wind and hydro resources also experience seasonal fluctuations based on changes in natural supply. In 2022, across the US, over 22 million megawatt-hours of solar electricity were produced in July, 92 percent more than the 11 million produced in January. Natural gas, by comparison, produced 40 percent more in July relative to January, largely driven by increased demand for electricity for air conditioning.
As renewables continue to comprise a larger part of the electricity makeup, the seasonal variation in energy generation will also increase. This creates a challenge for matching the seasonal pattern of electricity demand. Moreover, the scope of the challenge will grow as buildings and transportation electrify over the next several decades. Building energy demand is particularly challenging in colder, high latitude climates because of the combination of lower seasonal solar output and peak demands for heating and lighting. That creates challenges for electricity grids that must plan for peak demands in order to avoid blackouts, which threaten public safety as well as the health of the economy.
Solutions to those challenges fall into three categories: first, dispatchable zero-carbon energy sources that can cost-effectively meet peak needs when solar energy is in short supply; second, more efficient storage of solar production from summer and fall months into the winter; and third, better transmission connections between regions with diverse portfolios of renewable resources whose production is uncorrelated. The reality is that all three solutions will likely be required. A high priority for accelerating a clean energy transition are technology-neutral policies and scalable technology solutions that solve for this seasonal use case. While technologies are nascent, recent developments and early deployments of new technologies along with renewed focus on inter-regional transmission suggest reasons for optimism.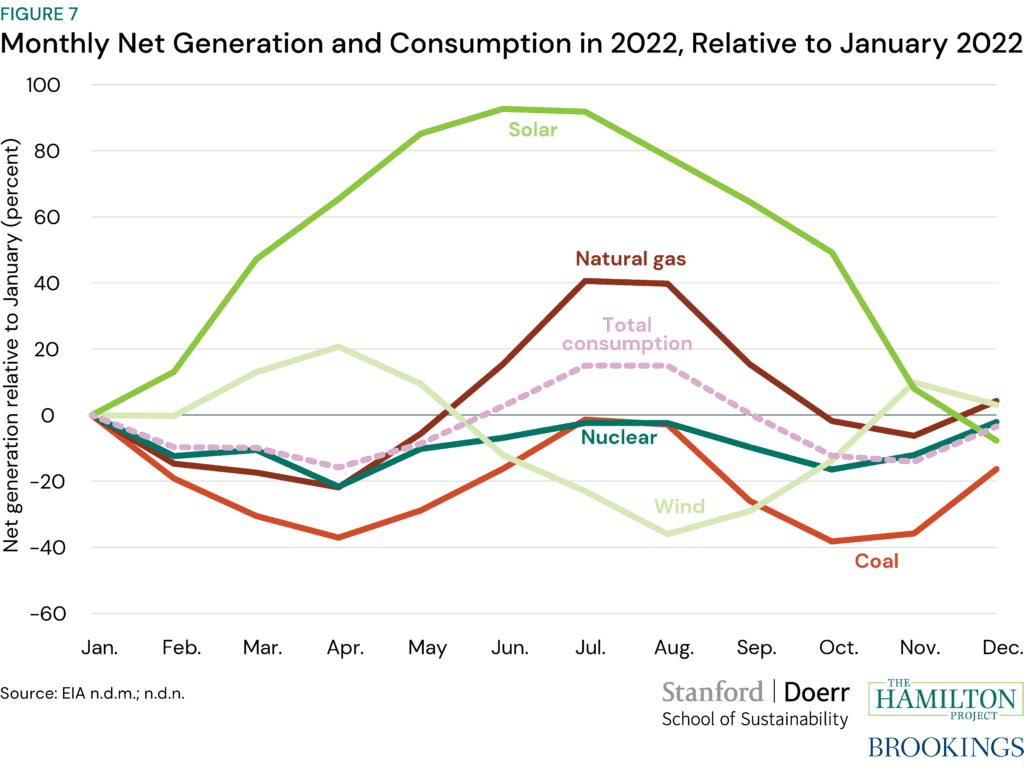
Fact 8. Solar power generates daily supply and demand misatches that other resources must address.
Over the course of a single day, there is dramatic variation in the supply of renewable sources of electricity, particularly solar energy. Figure 8 shows total electricity output, renewable output, and energy storage over the course of the average day in June 2022 in California. Some of the variation in total electricity output tracks demand for electricity: total output is at its lowest overnight and then higher throughout the daytime, peaking at around 6pm. Variation in renewable electricity output, however, is much starker, and tracks sunlight hours rather than consumer demand; on an average day in June 2022, renewable output began to ramp up around 6am and maximum output occurred at peak sunlight hours, between 12 and 4pm.
Electricity storage is helping bridge the gap in supply and demand when electricity can be stored during peak hours of production for use at times with lower energy generation. This is reflected in the figure: storage (primarily batteries) can charge when renewable output is highest (negative storage output) and that energy can be used when renewable output is lower but demand is high (positive storage output).
However, the scale of deployed storage, while rapidly growing, is currently limited, contributing to large variations in electricity prices throughout the day. In general, the daily prices for electricity follow trends in demand and overall output. For example, over the same period shown in the figure, June 2022, prices for electricity were, on average, lowest during the daytime (16¢ per kilowatt-hour around 8am rising to 74¢ before 6pm) and highest at peak demand hours ($1.70 per kilowatt-hour around 8pm; CAISO 2022). In the most extreme cases of this variation, there are days in California where the price dips below $0 midday. As renewables continue to comprise a larger part of the energy system, energy storage is going to play an even more critical role in mitigating intra-day mismatches in supply and demand.
Storage is not the only solution to the challenges created by the growth of solar. Also important are technology and geographic diversity of renewable generation resources. Stronger transmission interconnections between regions can allow different renewable resources to serve demand. In California, for example, wind generation from the great plains could provide energy when local renewable generation cannot match local demand.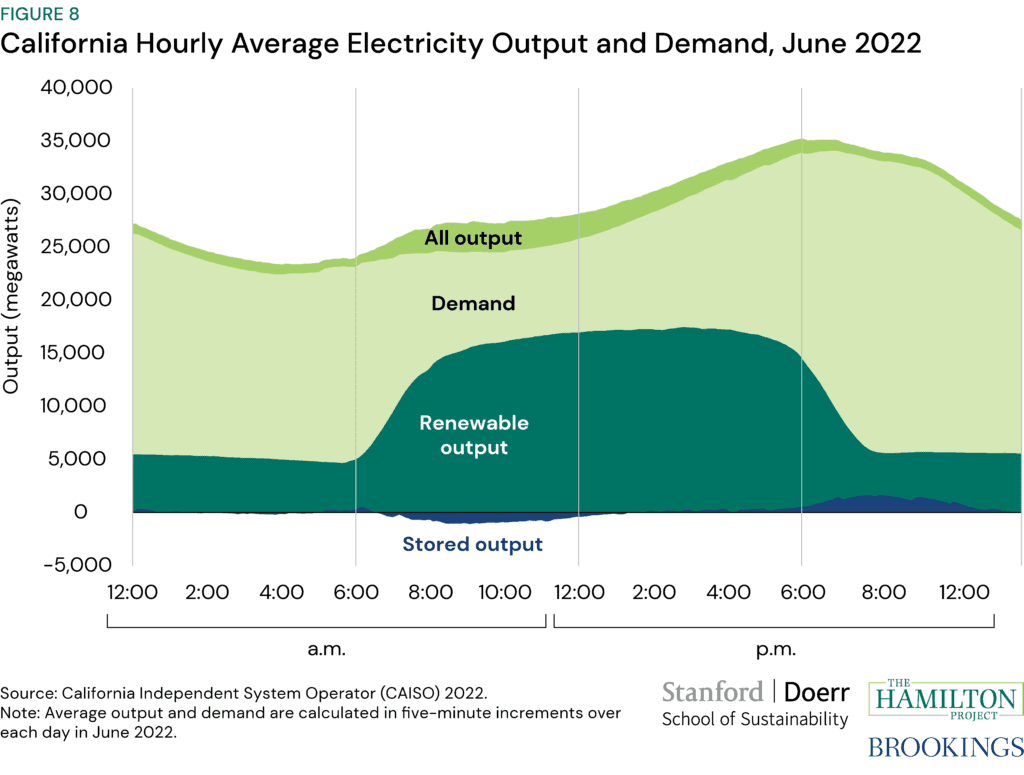
Fact 9. Green vehicles and electricity production require different and diverse raw materials.
Because of the significant mineral content in green energy infrastructure, the supply chain challenges related to renewable energy components and electric vehicle batteries are different relative to fossil fuel energy sources and internal combustion engine-powered cars.
The challenges to sourcing these materials are new and distinct from those of the fossil fuel economy. The long-running geopolitical challenges around international supplies of crude oil are well-known. Vehicles that rely on gasoline imply ongoing supply chain risks if global production of crude oil is interrupted. In contrast, supply chain issues around new technologies are most pronounced when bringing the products to scale and when first built and are much less challenging over the life of the vehicle or technology. In essence, clean energy supply chain issues have more to do with capital investment than they do with operational expense, de-risking new investments once they are put into operation. But these issues are still significant and will require careful attention and management over the coming decade.
Figure 9b shows the differences between the quantity and minerals used in electric versus combustion engine vehicles. A typical electric car uses more than five times more minerals than an internal combustion engine-powered car, which raises issues around where US companies source those minerals. Similarly, relative to energy produced by coal and natural gas, wind and solar energy are also mineral intensive, relying on significant quantities of zinc and silicon (figure 9a). However, innovation is occurring rapidly with regards to production and changes to the clean energy supply chain to make it more resilient, notably by reducing the cobalt content of Lithium-Ion Batteries (Mayyas, Elgqvist, Chung 2016; Fuchs 2022).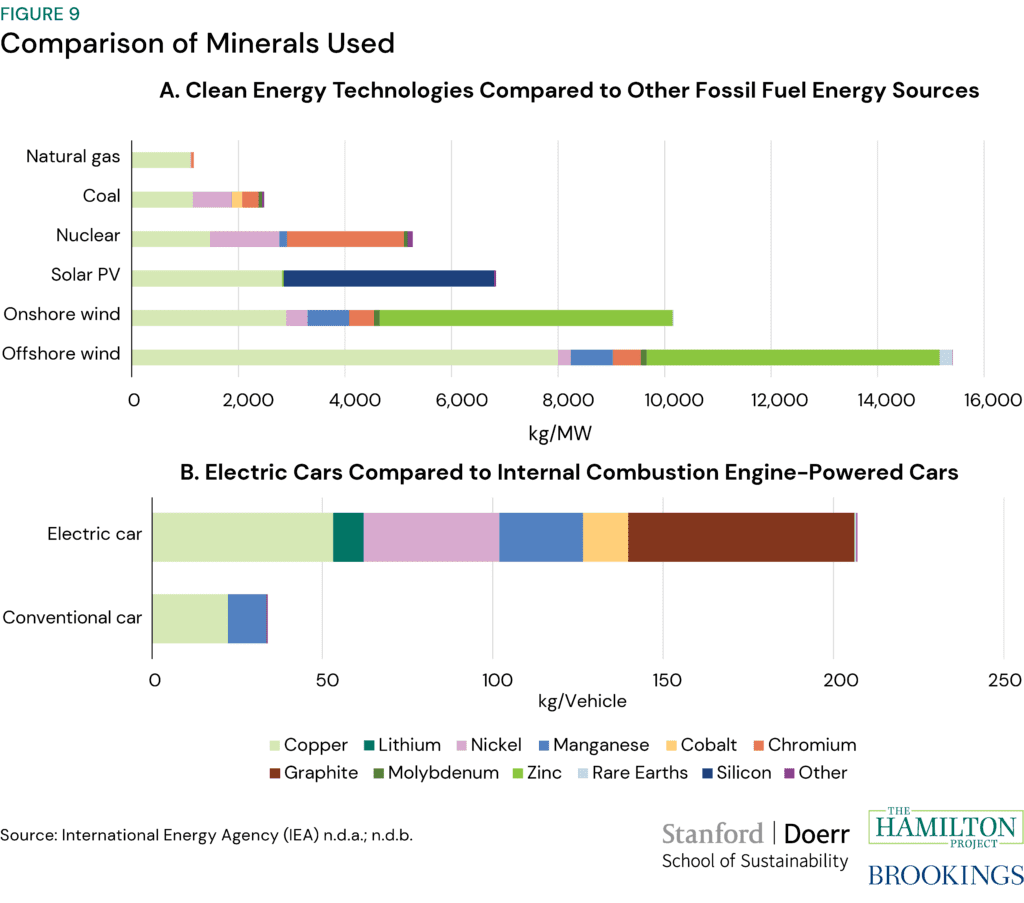
Fact 10. Quickly getting to a zero-carbon electricity system requires a dramatic acceleration in clean energy deployment and transmission construction.
The IRA and IIJA have created a historic opportunity to transform the US electricity system. The provisions in these laws improve incentives to construct new zero carbon electricity resources including wind, solar, fossil-fired electric power with carbon capture and storage and utility-scale energy storage. Wind and solar are the cheapest, least risky, and by far the most widely deployed of this mix. However, to achieve a zero-carbon electricity grid, all of these new resources will not only have to be sited and built—no mean feat—but also be connected to transmission lines that connect areas with high quality wind and solar resources to the electrical grid.
Rapid Energy Policy Evaluation and Analysis Toolkit (REPEAT) has produced estimates of electricity generation under different transmission buildout scenarios following the passage of IIJA and IRA (figure 10). The authors simulate the interaction between incentives under law with varying electric transmission implementation scenarios (REPEAT 2022). This modeling shows that getting to an electricity generation composition dominated by clean energy is impeded if the United States does not also significantly increase the rate of transmission construction beyond recent levels.
In the US, solar and wind resources are abundant but are not uniformly distributed and are not generally located near existing fossil fuel power plants and their associated electric transmission lines. How quickly clean electricity production can increase will depend critically on the United States’ ability to construct major new interregional electric transmission lines. This electric transmission will often have to traverse long distances, and potentially multiple balancing authorities (see Fact 2) to deliver the new clean electricity supply to demand centers.
The removal of both price and non-price barriers to electric transmission deployment is thus essential to fully realizing the potential of recent climate legislation to spur the production of zero carbon electricity resources. In particular, determining what transmission must be upgraded and what has to be built new takes years. In addition, the question of who pays for investments in electric transmission can be a key barrier—especially for longer lines that cross multiple regulatory jurisdictions. Another barrier is getting approval for construction from local jurisdictions that do not stand to gain much from the new infrastructure. Solving these problems by coming up with predictable and workable cost allocation schemes, de-risking the permitting process in a way that balances local and national concerns, and dramatically improving the speed of the whole process may ultimately determine whether the economic incentives created by IIJA and IRA can transform the US electricity sector and through it, US economy-wide greenhouse gas emissions.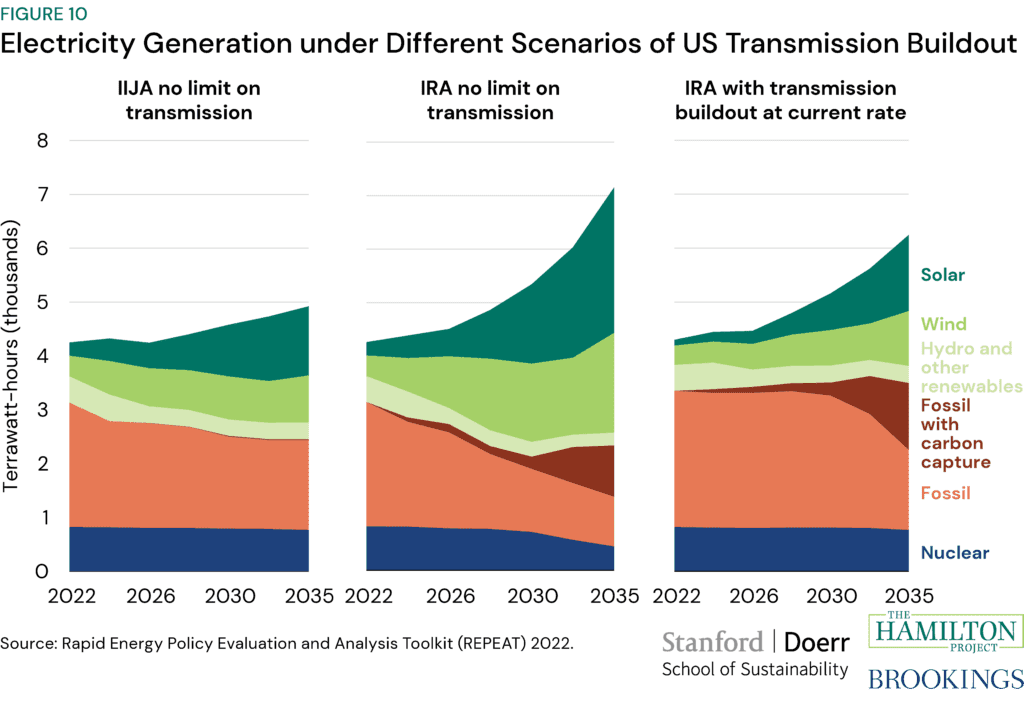
References
California Independent System Operator (CAISO). 2022. “Today’s Outlook.” Folsom, CA
Federal Energy Regulatory Commission (FERC). 2022. Electricity Reliability Council of Texas. Washington DC.
Fischer, Carolyn. 2019. “Market-Based Clean Performance Standards as Building Blocks for Carbon Pricing.” Policy Proposal 2019-13, The Hamilton Project, Brookings Institution, Washington DC.
Fuchs, Erica F.H. 2022. “Building the Analytic Capacity to Support Critical Technology Strategy.” Policy Proposal, The Hamilton Project, Brookings Institution, Washington DC.
Goldstein, Anna, Pierre Azoulay, Joshua Graff Zivin, and Vladimir Bulović. 2017. “Promoting Energy Innovation with Lessons from Drug Development.” Policy Proposal 2017-16, The Hamilton Project, Brookings Institution, Washington DC.
Greenstone, Michael, Cass Sunstein, and Sam Ori. 2017. “The Next Generation of Transportation Policy.” Policy Proposal 2017-02, The Hamilton Project, Brookings Institution, Washington DC.
Hausman, Catherine. 2023. “Principles for Public Investment in Climate-Responsible Energy Innovation.” Policy Proposal, The Hamilton Project, Brookings Institution, Washington DC.
Homeland Infrastructure Foundation Level Database (HIFLD). 2022. “Control Areas.” US Department of Homeland Security.
International Energy Agency (IEA). 2022. n.d.a. “Minerals used in clean energy technologies compared to other power generation sources.” Paris, France.
International Energy Agency (IEA). 2022. n.d.b. “Minerals used in electric cars compared to conventional cars.” Paris, France.
Kolstad, Charles D. 2017. “What Is Killing the US Coal Industry?” Policy Brief, Stanford Institute for Economic Policy Research (SIEPR), Stanford University, Stanford CA.
Lazard. 2021. “Levelized Cost of Energy, Levelized Cost of Storage, and Levelized Cost of Hydrogen 2021.”
Lydersen, Kari. 2020. “Grid congestion a growing barrier for wind, solar developers in MISO territory.” Energy News Network.
Mayyas, Ahmad, Darlene Steward, and Margaret Mann. 2018. “The Case for Recycling: Overview and Challenges in the Material Supply Chain for Automotive Lithium Ion Batteries.” Sustainable Materials and Technologies 19.
Morris, Adele. 2013. “The Many Benefits of a Carbon Tax.” Policy Proposal, The Hamilton Project, Brookings Institution, Washington DC.
North American Electric Reliability Corporation (NERC). 2023. Compliance Registry Matrix. Atlanta, GA.
Popp, David. 2019. “Promoting Innovation for Low-Carbon Technologies.” Policy Proposal 2019-14, The Hamilton Project, Brookings Institution, Washington DC.
Rapid Energy Policy Evaluation and Analysis Toolkit (REPEAT) Project. 2022. Princeton University, Princeton, NJ.
US Energy Information Administration (EIA). 2023. n.d.a. “Annual Energy Outlook.” Table 2.1a. US Department of Energy, Washington DC.
US Energy Information Administration (EIA). 2022. n.d.b. “Electricity consumption in the United States was about 3.9 trillion kilowatthours (kWh) in 2021.” US Department of Energy, Washington DC
US Energy Information Administration (EIA). 2014. n.d.c. “LED light bulbs keep improving in efficiency and quality.” US Department of Energy, Washington DC.
US Energy Information Administration (EIA). 2023. n.d.d. “Annual Energy Outlook.” AEO Narrative. US Department of Energy, Washington DC.
US Energy Information Administration (EIA). n.d.e. “Form EIA-860 detailed data with previous form data (EIA-860A/860B).” US Department of Energy, Washington DC.
US Energy Information Administration (EIA). 2016. n.d.f. “U.S. electric system is made up of interconnections and balancing authorities.” US Department of Energy, Washington DC.
US Energy Information Administration (EIA). 2023. n.d.g. Primary Energy Overview. Table 1.1. US Department of Energy, Washington DC.
US Energy Information Administration (EIA). 2022. n.d.h. “The United States became the world’s largest LNG exporter in the first half of 2022.” US Department of Energy, Washington DC.
US Energy Information Administration (EIA). n.d.i. “Natural gas explained, Liquefied natural gas.” US Department of Energy, Washington DC.
US Energy Information Administration (EIA). n.d.j. “Electricity Data Browser.” Net Generation. US Department of Energy, Washington DC.
US Energy Information Administration (EIA). 2020. n.d.k. “More than 100 coal-fired plants have been replaced or converted to natural gas since 2011.” US Department of Energy, Washington DC.
US Energy Information Administration (EIA). 2021. n.d.l. “Average US Construction Costs for Solar Generation Continued to Fall in 2019.” US Department of Energy, Washington DC.
US Energy Information Administration (EIA). n.d.m. “Electricity Data Browser.” Table 1.1. US Department of Energy, Washington DC.
US Energy Information Administration (EIA). n.d.n. “Electricity Data Browser.” Table 5.1. US Department of Energy, Washington DC.
US Office of Electricity. 2022. “DOE Launches New Initiative From Presidents Biden’s Bipartisan Infrastructure Law to Modernize National Grid.” US Department of Energy, Washington DC.
Williams III, Roberton C. 2019. “How to Change U.S. Climate Policy after There Is a Price on Carbon.” Policy Proposal 2019-15, The Hamilton Project, Brookings Institution, Washington DC.