Introduction
The number of people caught up in the U.S. criminal justice system—under either supervision or adjudication—is unusually high in both historical and international terms. Furthermore, interacting with the criminal justice system is an expensive proposition. While people from all walks of life encounter the criminal justice system, its reliance on bail to encourage return after pretrial release, on fines to punish and provide restitution, and on fees to fund the system implies that an individual’s economic means may determine how burdensome any interaction is. Some people can easily post a $5,000 bail, while others struggle or are unable to do so, resulting in incarceration. A $500 fine could be a nuisance or a devastating financial blow.
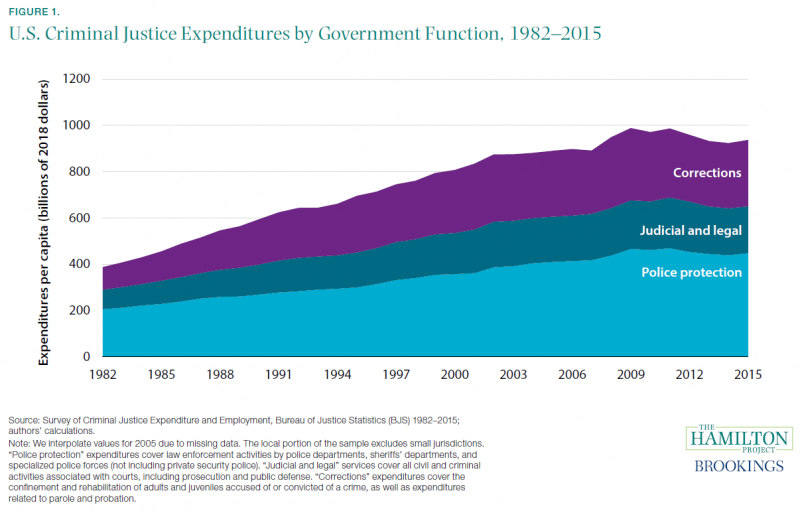
The criminal justice system also incurs high expenses, with correctional, judicial, and law enforcement expenditures combined costing about $900 per capita each year (see fact 1). Rising expenses, alongside other pressures on state and local budgets, have coincided with some jurisdictions relying heavily on courts and law enforcement for new revenues. These funding sources come in a variety of forms: fees and surcharges, fines, and asset forfeiture (see box 1 for more information). [1] One estimate puts fee and fine revenues collected by state and local governments at more than $15 billion per year (U.S. Census Bureau 2012; authors’ calculations). Particularly in the jurisdictions that rely heavily on such collections, researchers have found that law enforcement activities are distorted by the need to raise revenue, affecting the types of crimes that are policed and damaging the relationship between police and communities. In an idealized criminal justice scenario, the court convicts an offender of a crime, the offender “repays their debt to society,” and then they reenter the community. Unfortunately, this is not how the process works for many individuals. Criminal justice debts often follow individuals after adjudication, in many instances bringing them back into the criminal justice system or limiting their employment options. These debts are considerable: in FY2017, outstanding federal criminal justice debt totaled $124 billion (Executive Office for United States Attorneys 2017).
The criminal justice system has also dramatically expanded its use of monetary bail since the late 20th century, which has direct effects on who can avoid pretrial detention, as well as the financial burden experienced by defendants and their families. Through its effects on detention, the imposition of monetary bail tends to increase recidivism and impair subsequent labor market outcomes.
These are important costs in conjunction with the intended benefits of monetary sanctions: compelling appearance in court, deterring and punishing crime, and making restitution to victims. Policy discussions are beginning to acknowledge the economic and social consequences of monetary sanctions, and a growing body of evidence indicates that sanctions could be realigned with their public purposes while minimizing their harmful consequences for those interacting with the justice system. This Hamilton Project document aims to establish facts relevant to that policy discussion and thereby promote broadly shared economic growth and more-effective governance.
Fact 1: Expenditures on police, corrections, and the judiciary have increased over time.
The United States spends large and growing sums on criminal justice. In 1982, real per capita spending on law enforcement was $205; when added to spending of $98 and $84 on corrections and the judicial system, respectively, the United States spent roughly $388 per capita on criminal justice in that year. Since then, all three of those expenditures have grown dramatically, with corrections expenditures growing especially quickly through the end of the 20th century, as shown in figure 1. Corrections spending has grown only 6 percent since 2000, when the incarceration rate leveled off and eventually began to decline, but total criminal justice spending rose 16 percent to its 2015 level of $937 per capita.
Corrections spending—which includes not only incarceration but also parole, probation, and rehabilitation—cost the country fully $92 billion in 2015. Incarceration is particularly expensive, constituting 85.7 percent of corrections spending at the state level (BJS 1982–2015).
These growing expenditures have put pressure on state and local budgets. Unsurprisingly, they coincide with an increasing tendency to use monetary sanctions to fund the criminal justice system (Bannon, Nagrecha, and Diller 2010).
Fact 2: The ratio of sanction revenues to police and judicial expenditures is substantial in many jurisdictions.
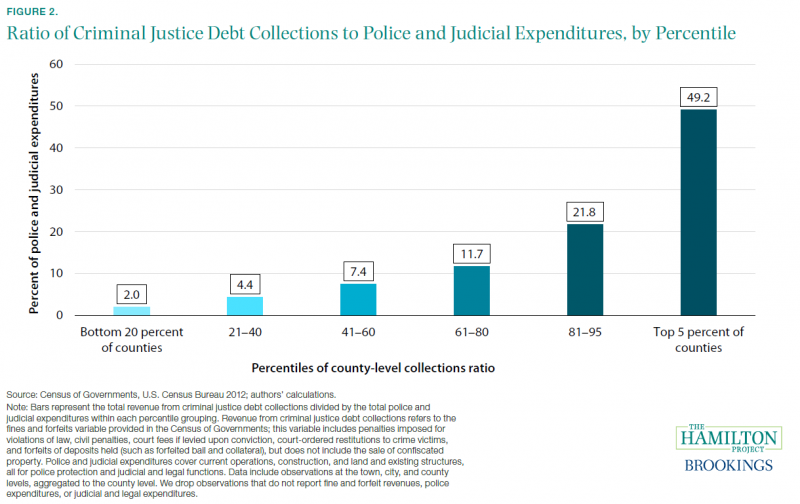
Fines and fees, including local and state collections, amounted to $15.3 billion in 2012 (U.S. Census Bureau 2012; authors’ calculations). In figure 2, we focus on jurisdictions at the county level and below, showing fine and fee revenues as a fraction of total police and judicial expenditures within a county. The typical county collects fine and fee revenues equal to roughly 7 percent of these expenditures; the 20 percent of counties with the smallest shares recoup only 2 percent of their police and judicial expenditures in the form of fines and fees. But there are some counties that are highly dependent on this revenue: the highest quintile collects over a fifth of their expenditures, while the top 5 percent offset about half of their expenditures with fine and fee revenues. [2] The collections calculated in figure 2 include restitution to crime victims, which are not available to fund law enforcement or judicial expenditures. However, figure 2 also excludes important sources of criminal justice revenues like those from the sale of confiscated property or court fees (e.g., booking or supervision fees), which suggests that this is an underestimate of criminal justice revenues. A core problem with such a high share of revenue coming from fines and fees is that it can generate incentives that distort criminal justice policy or behavior. For example, towns with budget problems may increase enforcement of traffic violations, or they may generate and enforce new laws specifically to generate revenue (Makowsky and Stratmann 2009). One study suggests that police departments that focus on revenue generation do so at the expense of their public safety duties, finding that a 1 percent increase in the share of revenues from fees, fines, and forfeitures is associated with a 3.7 percentage point decrease in the violent crime clearance rate (Goldstein, Sances, and You 2018). In a Hamilton Project proposal, Michael Makowsky (2019) describes research that links fines, fees, and other monetary sanctions to law enforcement activities, and proposes reforms that would realign law enforcement with its traditional public safety objectives.
Fact 3: Courts assessed monetary sanctions for two-thirds of prison inmates.
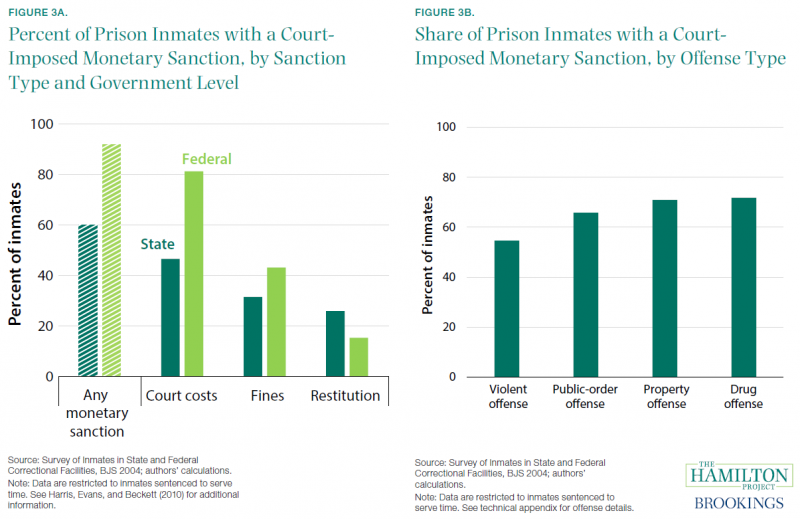
Criminal justice debt typically comprises several types of monetary sanctions that accumulate on top of one another. In addition to fines and court costs, individuals who come into contact with the criminal justice system might also need to pay surcharges, penalties for late payments, and interest (Harris et al. 2017). [3] Criminal justice debt is persistent: a formerly incarcerated man who pays $100 a month toward his debt is likely to have substantial legal debt even after 10 years (Harris, Evans, and Beckett 2010). Fees, fines, and restitution have all become more common over time. From 1991 to 2004, the fraction of inmates with any monetary sanction rose from 25 to 66 percent. This escalation was driven in large measure by the increase in the fraction of inmates subject to fees (“Court costs” in figure 3a), which rose from roughly one in ten inmates to more than half of inmates (Harris, Evans, and Beckett 2010). The incidence of monetary sanctions (though not necessarily the average amounts) is roughly similar for people of varying prearrest income levels (BJS 2004; authors’ calculations). But, as shown in figure 3b, courts are substantially more likely to assess a fee, fine, or restitution requirement for inmates convicted of property and drug offenses than they are for those convicted of violent offenses. [4] Court fees have been an important driver of the increase over time. As criminal administrative costs increased, 48 states have increased civil and/or criminal fees since 2010 (NPR 2014). With the growth of fees has come additional burdens for individuals. For example, 43 states and the District of Columbia allow courts to charge for the use of a public defender, 44 states allow courts to charge supervision fees for probation, and 9 states allow courts to charge fees for English translators and interpreters (Appleman 2016; NPR 2014).
Fact 4: More than half of all individuals with a felony conviction in Alabama owe more than $5,000 each in criminal justice debt.
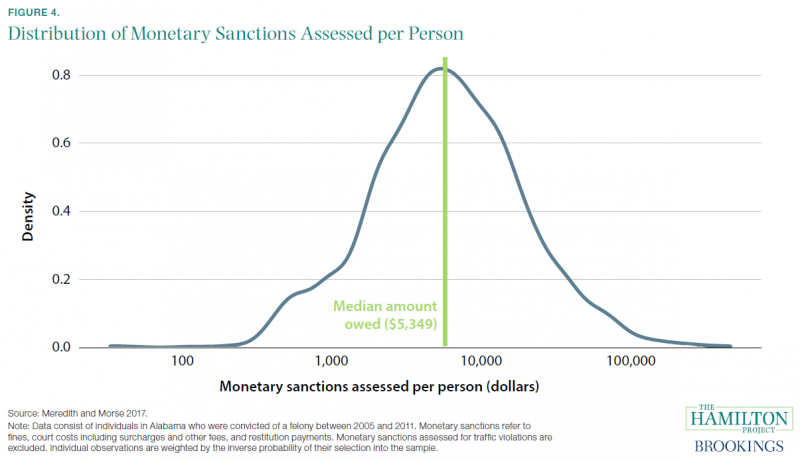
Among those convicted of felonies in Alabama, only a quarter were assessed sanctions lower than $2,500; more than half of inmates were assessed roughly $5,000 or more in sanctions. [5] Given that the typical household has just $4,000 in liquid savings and the poorest quintile of households have less than $1,200 in total financial assets, these figures represent a substantial burden for many households (Liu, Nunn, and Shambaugh 2018). State policies often amplify the economic effects of these burdens. Unpaid criminal justice debt can result in revocation of a driver’s license, which in turn limits labor market opportunities (Salas and Ciolfi 2017) and risks further criminal charges for these individuals—75 percent of whom continue to drive on a suspended license (Marsh 2017). Similarly, occupational licenses—required for employment in many professions from cosmetology to architecture—can be revoked or withheld because of criminal convictions (Avery, Emsellem, and Hernandez 2018) or unpaid debt (Criminal Justice Policy Program 2016). There is also evidence that assessing monetary sanctions on juvenile offenders and their families increases the likelihood of recidivism (Piquero and Jennings 2016). Much of the assessed criminal justice debt is never collected. Of the nearly $430 million in criminal fines and fees imposed by Florida counties in 2018, only 40 percent has been collected; in San Francisco, California, the collection rate for administrative fees has averaged 17 percent in recent years (Financial Justice Project 2018; Florida Court Clerks & Comptrollers 2018). The vast majority of collection offices cite “indigent defendants and high court costs” as reasons for the difficulty of collecting assessments (Murphy 2015). In a Hamilton Project proposal, Beth Colgan (2019) presents the evidence on how the criminal justice system burdens people with fines and fees, describes evidence from experiments on graduated sanctions, and develops proposals to help the courts take into consideration an ability to pay when they impose monetary sanctions.
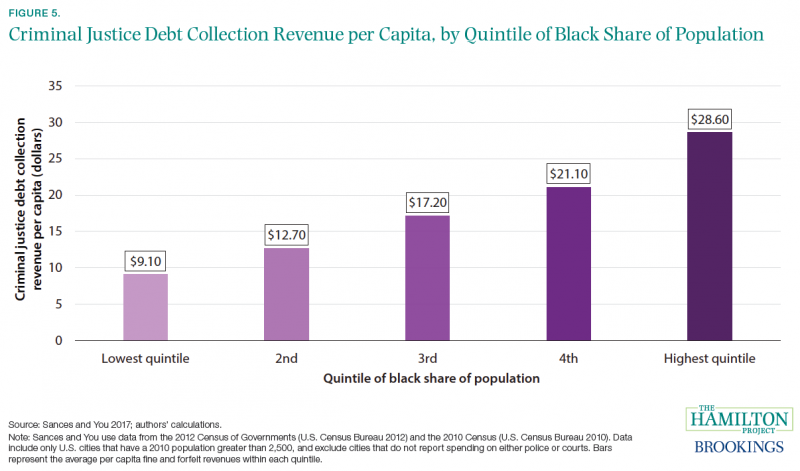
Fact 5: Monetary sanctions are used disproportionately more in cities with a higher share of black Americans.
Criminal justice revenues are not collected uniformly across the country. As explained in fact 2, some jurisdictions make much more use of fees and fines than others. Moreover, the places that tend to collect higher revenues are those with higher shares of black residents. As shown in figure 5, cities in the highest quintile of black share of population collect roughly $29 in criminal justice revenues per resident, whereas cities in the lowest quintile collect only $9. This relationship between criminal justice revenues and the black share of population remains after controlling for a city’s local finances and demographics as well as county-level characteristics: Sances and You (2017) estimate that cities with the largest black share of residents collect between $12 and $19 more per resident than those with the smallest black share of residents. Additionally, one study finds that the arrest rates of black and Hispanic residents for drugs and DUI violations increase during periods of fiscal distress; the authors only observe these results in states where police departments are more easily able to retain revenue from seized property, and they do not find a similar relationship with respect to white arrests (Makowsky, Stratman, and Tabarrok, forthcoming). These disparities are echoed in law enforcement activity; one well-known example is the city of Ferguson, Missouri. In 2015, black residents in Ferguson made up 67 percent of the city’s population but accounted for 85 percent of its vehicle stops, 90 percent of its citations, and 93 percent of its arrests (U.S. Department of Justice 2015). Given the lower average wealth of black households (Hamilton and Darity 2017), these criminal justice penalties can become an excessive burden for many, and as noted in fact 6, can result in reincarceration.
Fact 6: Criminal justice debt is a significant factor in reincarceration.
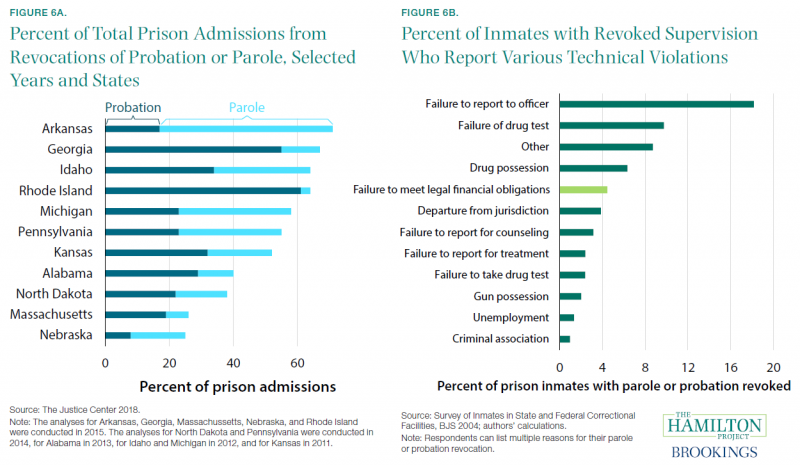
Correctional supervision often continues in the form of probation or parole after any sentence is served. As a condition of continued freedom, the probation and parole systems make a variety of demands on individuals: for example, they may require drug treatment, employment, continuous reporting to an officer, and/or repayment of criminal justice debt. Failure to satisfy any of these conditions can lead to so-called technical violations and a subsequent revocation of parole or probation. In many states, technical violations result in a large fraction of prison admissions. Using estimates from the Justice Center of the Council of State Governments (2018), figure 6a shows the percent of new admissions that result from revocation of parole or probation for selected states. Of the states in the data set, Arkansas has the highest fraction, at 71 percent, while Nebraska has the lowest, at 25 percent. Figure 6b focuses specifically on people who have had their parole or probation revoked, showing the percent of all revocations that are associated with each of several types of technical violation. [6] “Failure to report to officer” and “Failure of drug test” were the most common types of violation, but “Failure to meet criminal justice financial obligations” was also a contributor in more than 4 percent of cases. [7] Overall, 21,000 (1.5 percent) prison inmates in 2004 were incarcerated due to their parole or probation being revoked for a failure to meet financial conditions (BJS 2004; authors’ calculations). [8] A failure to pay is more likely to result in incarceration in a local jail, not state or federal prison: several investigations conducted in different states and localities found that roughly 20 percent of jail incarcerations were for a failure to pay monetary obligations (American Civil Liberties Union of Ohio 2013; Rhode Island Family Life Center 2008; Shapiro 2014a; Smith and Aspinwall 2013). [9] The fact that monetary sanctions from the criminal justice system result in a substantial number of reincarcerations suggests these penalties are generating important costs to society ranging from the most direct (increasing corrections costs) to those that are broader (e.g., interrupting careers and housing, disrupting families, and harming job prospects).
Fact 7: Substantial quantities of assets are seized without a criminal conviction.
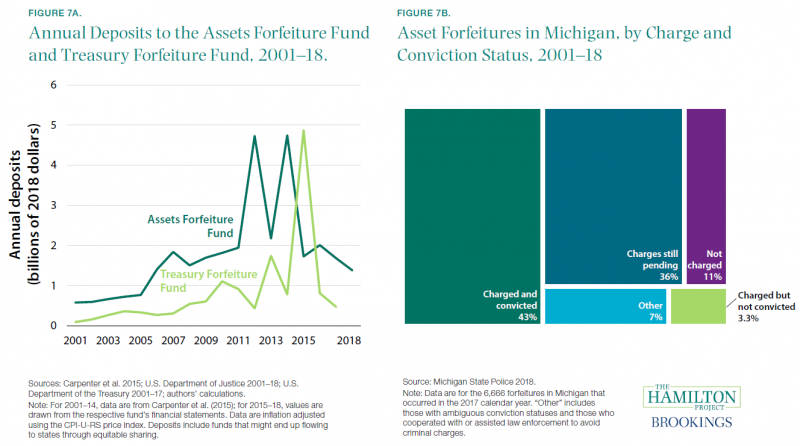
The criminal justice system generates revenues through the seizure of assets that are believed to have been used in connection with a crime, a practice often known as civil asset forfeiture. [10] This practice saw limited use early in U.S. history, but has dramatically expanded since Congress acted in 1984 to create the Department of Justice Assets Forfeiture Fund (Carpenter et al. 2015). [11] Along with the Department of the Treasury Forfeiture Fund (U.S. Department of the Treasury 2018), this Fund has been the recipient of growing deposits over the years (shown in figure 7a). From 2007–17, deposits to the two funds averaged a combined $3.5 billion. Some of these funds are ultimately remitted to states: for the Assets Forfeiture Fund, payments to states (referred to as equitable sharing) were equivalent to 29 percent of total net deposits in 2018, or around $400 million (U.S. Department of Justice 2018). Although inflows to both funds have risen over time, annual deposits can be volatile due to large civil lawsuits (Carpenter et al. 2015). However, most (89 percent) federal cash seizures by the Drug Enforcement Administration (DEA) are valued at less than $100,000. [12] In turn, 77 percent of those seizures were accomplished through a process that does not require either an arrest or a conviction (Office of the Inspector General 2017). These estimates exclude much of state forfeiture activity, which is more difficult to observe. By one estimate, 26 states and the District of Columbia seized $254 million in assets in 2012 (Carpenter et al. 2015). Even at the state level, only a fraction of seizures are accompanied by a criminal conviction. In Michigan data, 43 percent of forfeitures were associated with a conviction, as shown in figure 7b. As described by Michael Makowsky (2019) in a Hamilton Project proposal, civil asset forfeiture affects how law enforcement resources are allocated, which has important economic effects on individuals as well as effects on public safety. [13]
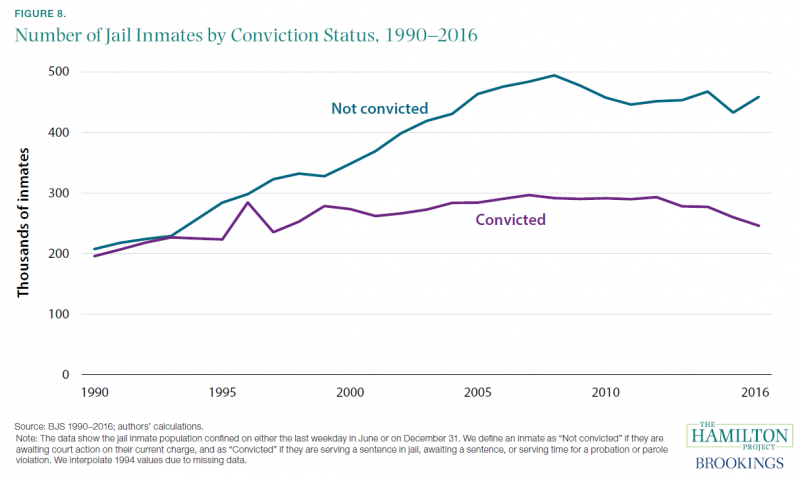
Fact 8: Nearly half a million U.S. inmates on any given day have not been convicted of a crime.
On a typical day in the United States, roughly 460,000 people are incarcerated but have not been convicted of any crime. In an overwhelming majority of cases, even though a judge has deemed those people to be eligible for release, they remain incarcerated because of their inability to pay the required bail (Reaves 2013). Over the past 30 years, there has been an increased reliance on monetary bail, coupled with increases in typical bail requirements (described further in fact 9). Of felony defendants, the fraction required to post bail rose from 53 percent in 1990 to 72 percent in 2009. This increase occurred in every major offense category (Liu, Nunn, and Shambaugh 2018). There has been a coincident decline in the share of defendants released on their own recognizance. A very small share (roughly 4 percent) are held without bail due to safety or flight risks. Pretrial detention—generally due to inability to pay bail—has sizable negative consequences to individuals and to society. Those held before trial are far more likely to plead guilty—in many cases because it would allow them to shorten or end their time in jail—generating a criminal record and sizable negative impacts on employment over time (Dobbie, Goldin, and Yang 2018). In addition, there are direct costs of imprisonment, as well as negative impacts on families and businesses (Liu, Nunn, and Shambaugh 2018). Some jurisdictions have moved to reduce or eliminate the use of monetary bail. One study examines Philadelphia’s No-Cash-Bail reform policy, which led to a 23 percent increase in release on recognizance and an analogous decrease in the fraction of defendants who spent at least one night in jail, and found that less-frequent use of cash bail did not significantly affect failure-to-appear rates or recidivism rates (Ouss and Stevenson 2019). In a Hamilton Project proposal, Will Dobbie and Crystal Yang (2019) explain how the current bail system generates costs to the economy and how reforms of the bail system could improve outcomes for detainees without compromising public safety.
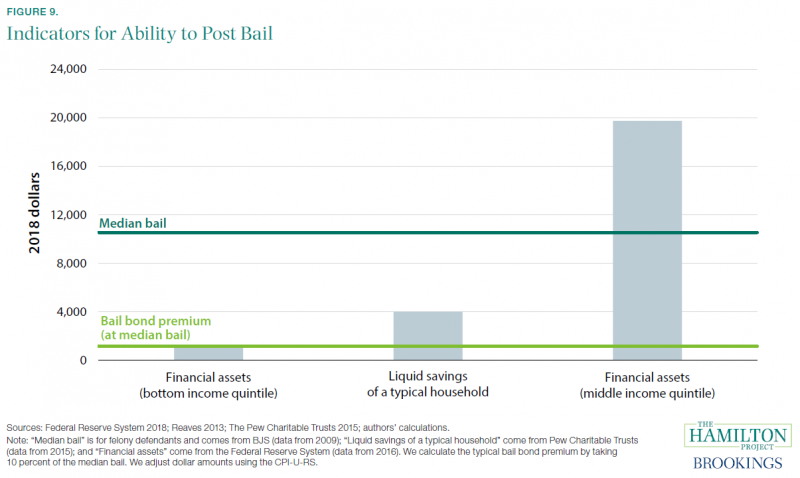
Fact 9: Bail can be prohibitively expensive for the typical household.
Bail is often set very high relative to the resources an arrestee can draw upon, as seen in figure 9. The median bail amount is more than $10,000 for felony defendants (the dark green line). While a typical household has roughly $20,000 in financial assets, much of this is not liquid, and it may be expensive to turn those assets into cash quickly. The median bail amount dwarfs the liquid savings of a typical household (middle column), meaning that many people would almost certainly have to borrow or use a commercial bail bonds firm to gain release from jail. Given the typical 10 percent premium charged by the commercial bond industry, this implies a cost of roughly $1,200 to the typical felony defendant (the light green line). More importantly, bail bond premiums are nonrefundable, meaning that many people will functionally have to pay a large fee in order to avoid pretrial detention. Even $1,200 is greater than the total financial assets of the poorest quintile, making it highly likely that poorer defendants would be unable to post bail. [14] These figures may overestimate the ability of many households to generate cash quickly. Roughly a quarter of households do not have $400 in liquid savings (Bhutta and Dettling 2018). An even higher share of households (41 percent) would choose to borrow money, sell some of their assets, or would simply be unable to pay if faced with a $400 emergency expense, highlighting the exceedingly thin financial buffers that many Americans experience (Federal Reserve System 2018). This economic reality suggests that a range of families may face hardship when attempting to attain pretrial release. Given that an individual might stay in jail for months until adjudication, there is a large value to being released on bail, which makes many willing to endure the necessary sacrifice (Liu, Nunn, and Shambaugh 2018). The requirement that defendants post bail—and the inability of many to do so—has substantial negative effects on individuals’ economic outcomes. These effects generally take the form of an increased likelihood of conviction (Dobbie, Goldin, and Yang 2018; Leslie and Pope 2017; Lum, Ma, and Baiocchi 2017; Stevenson 2018), which then diminishes access to labor markets (The Pew Charitable Trusts 2010) and increases the probability of recidivism (Heaton, Mayson, and Stevenson 2017).
Endnotes
[1] The recent Supreme Court ruling in Timbs v. Indiana (2019) limits “excessive” forfeitures by states, but this is not likely to end the practice of civil asset forfeiture.
[2] Some subcounty governments do not report revenues and expenditures in the Census of Governments (U.S. Census Bureau 2012). We sum all non-missing values within a county. Consequently, we do not weight the calculations by county population, which would be inappropriate for counties with missing data. However, when we weight by jurisdiction population (e.g., cities and towns, and excluding county governments), we find a similar pattern.
[3] In New York State, for example, individuals convicted of an offense must pay $300 for felony convictions, $175 for misdemeanors, and $95 for violations as a mandatory surcharge (New York City Bar 2018).
[4] As court-imposed monetary sanctions do not include fees that correctional institutions can levy on prisoners, these estimates are likely to underestimate the prevalence of criminal justice debt. See Eisen (2014) for more information.
[5] The data exclude monetary sanctions for traffic cases. One important caveat is that a single individual can be assessed monetary sanctions for multiple cases. Whereas we report the total monetary sanctions levied on individuals (i.e., the total debt accrued due to their criminal history), the median monetary sanction for a single felony conviction in Alabama was about $2,000 (Greenberg, Meredith, and Morse 2016). Similar research in Washington State found that the median monetary sanction was $1,347 per felony conviction (Harris, Evans, and Beckett 2010).
[6] The bars do not add up to 100 percent because we focus only on technical violations, which are not the only reasons that courts may revoke parole or probation. Moreover, respondents can give multiple responses.
[7] Importantly, criminal justice debt could also be a factor in some of the other technical violations, such as unemployment or criminal association, to the extent that it impairs employment prospects (Appleman 2016).
[8] Because we are limiting the calculation to prison inmates (who are incarcerated for longer spells than jail inmates), this is a conservative estimate of the contribution of monetary sanctions to incarceration. Many more people can end up in jail for failures to pay off court debt, in part due to arrest for repeated missed payments (Shapiro 2014b).
[9] In 2012, over 20 percent of all jail bookings in Huron County, Ohio were related to a failure to pay fines (American Civil Liberties Union of Ohio 2013). In 2013, 29 percent of jail bookings in Tulsa County, Oklahoma were connected to warrants for failure to pay costs—up from 8 percent in 2004 (Smith and Aspinwall 2013). From 2005–07, incarcerations for court debt comprised 18 percent of all commitments in the state of Rhode Island (Rhode Island Family Life Center 2008). And in Benton County, Washington, about a quarter of people in jail for misdemeanor offenses were there due to a failure to pay court fines and fees (Shapiro 2014a).
[10] By contrast, criminal asset forfeiture necessitates a criminal conviction before courts can seize assets.
[11] A February 2019 Supreme Court decision in Timbs v. Indiana (2019) is expected to limit “excessive” forfeitures by states.
[12] The DEA was responsible for about 80 percent of federal cash seizures by the Department of Justice from FY2007 to FY2016.
[13] See also Holcomb et al. (2018).
[14] It is important to note that this 10 percent fee is not part of the typical fees counted in prior facts because the revenue does not typically go to the state, but rather to private firms.


