


Abstract
This paper explores changes in U.S. poverty since the late 1960s and the role that changes in safety net programs played in these developments. We examine changes in the poverty rate, poverty gap, deep poverty rate, and deep poverty gap from 1967 to 2023, using both the “historical/standard” and “anchored” Supplemental Poverty Measures.
The paper finds that the poverty rate and poverty gap declined markedly over this period, with the poverty gap declining somewhat less than the poverty rate. The paper finds considerably less progress, however, in reducing deep poverty and especially the deep poverty gap, which shows little improvement over this period. The paper also finds that these poverty changes have not been evenly distributed, with the most concerning results being for people aged 18–64 who have little or no earnings and do not live with children.
The paper finds that these trends reflect both the overall strengthening of the safety net over this period, especially for the elderly and low-income working families with children, and the weakening of parts of the safety net—especially cash assistance programs—for many very poor people who have little or no earnings and are not elderly or classified as disabled. The findings also reflect the failure of the economic growth that occurred over this period to generate much poverty reduction.
Because our analysis ends in 2023, it does not reflect the deep cuts to safety net programs enacted in the One Big Beautiful Bill Act (OBBBA) of 2025. When fully in effect, those cuts almost certainly will increase poverty and deep poverty rates and gaps and will thus reverse some of the gains reported here.
Introduction
How has the level of poverty in the United States changed since the late 1960s, and what role have changes in social programs played in those developments? A 2025 Hamilton Project paper, “Changes in the safety net over recent decades and their impact” (Greenstein 2025), explores this question with respect to poverty rates and finds, as many other studies have, that poverty rates declined substantially over this period due primarily to the expansion of safety net programs (Wimer et al. 2016; Fox et al. 2015b; Wimer et al. 2025; Kearney and Sullivan 2025; Bahk et al. 2024).
This analysis builds on that paper, principally by also looking at changes in deep poverty—that is, when poverty is measured using a threshold of 50 percent of the poverty line—and in the poverty gap from 1967 to 2023.
Poverty rates measure what share of the population lives below the poverty line (or, in the case of deep poverty rates, below 50 percent of the poverty line) but not how far below the line people who are poor fall. Poverty gap measures, by contrast, capture not only whether people are poor but also how far below the poverty line they are. If people who are already relatively close to the poverty line are raised above it by the economy or changes in government policies, but people who are much poorer are pushed deeper into poverty by economic or policy changes, then poverty rates can fall without commensurate improvement in the poverty gap, and the deep poverty rate can come down less than the overall poverty rate.
We find that over the 1967–2023 period that is the focus of this paper, both the poverty rate and the poverty gap declined markedly using the 100-percent-of-poverty threshold, with poverty gaps declining somewhat less than poverty rates. As figure 1 shows, the poverty rate declined by about one-quarter to one-half (depending on what poverty measure one uses, as we discuss below), with the poverty gap falling by modestly less than that.
Our analyses also show that these poverty declines are primarily the result of expansions of social programs over these years rather than growth in the economy. The poverty rate and poverty gap, as measured before government benefits and taxes are taken into account, declined modestly or even increased over the 1967–2023 period. It is only after government benefits and taxes are counted that poverty is seen to have declined markedly. (See figure 1.)
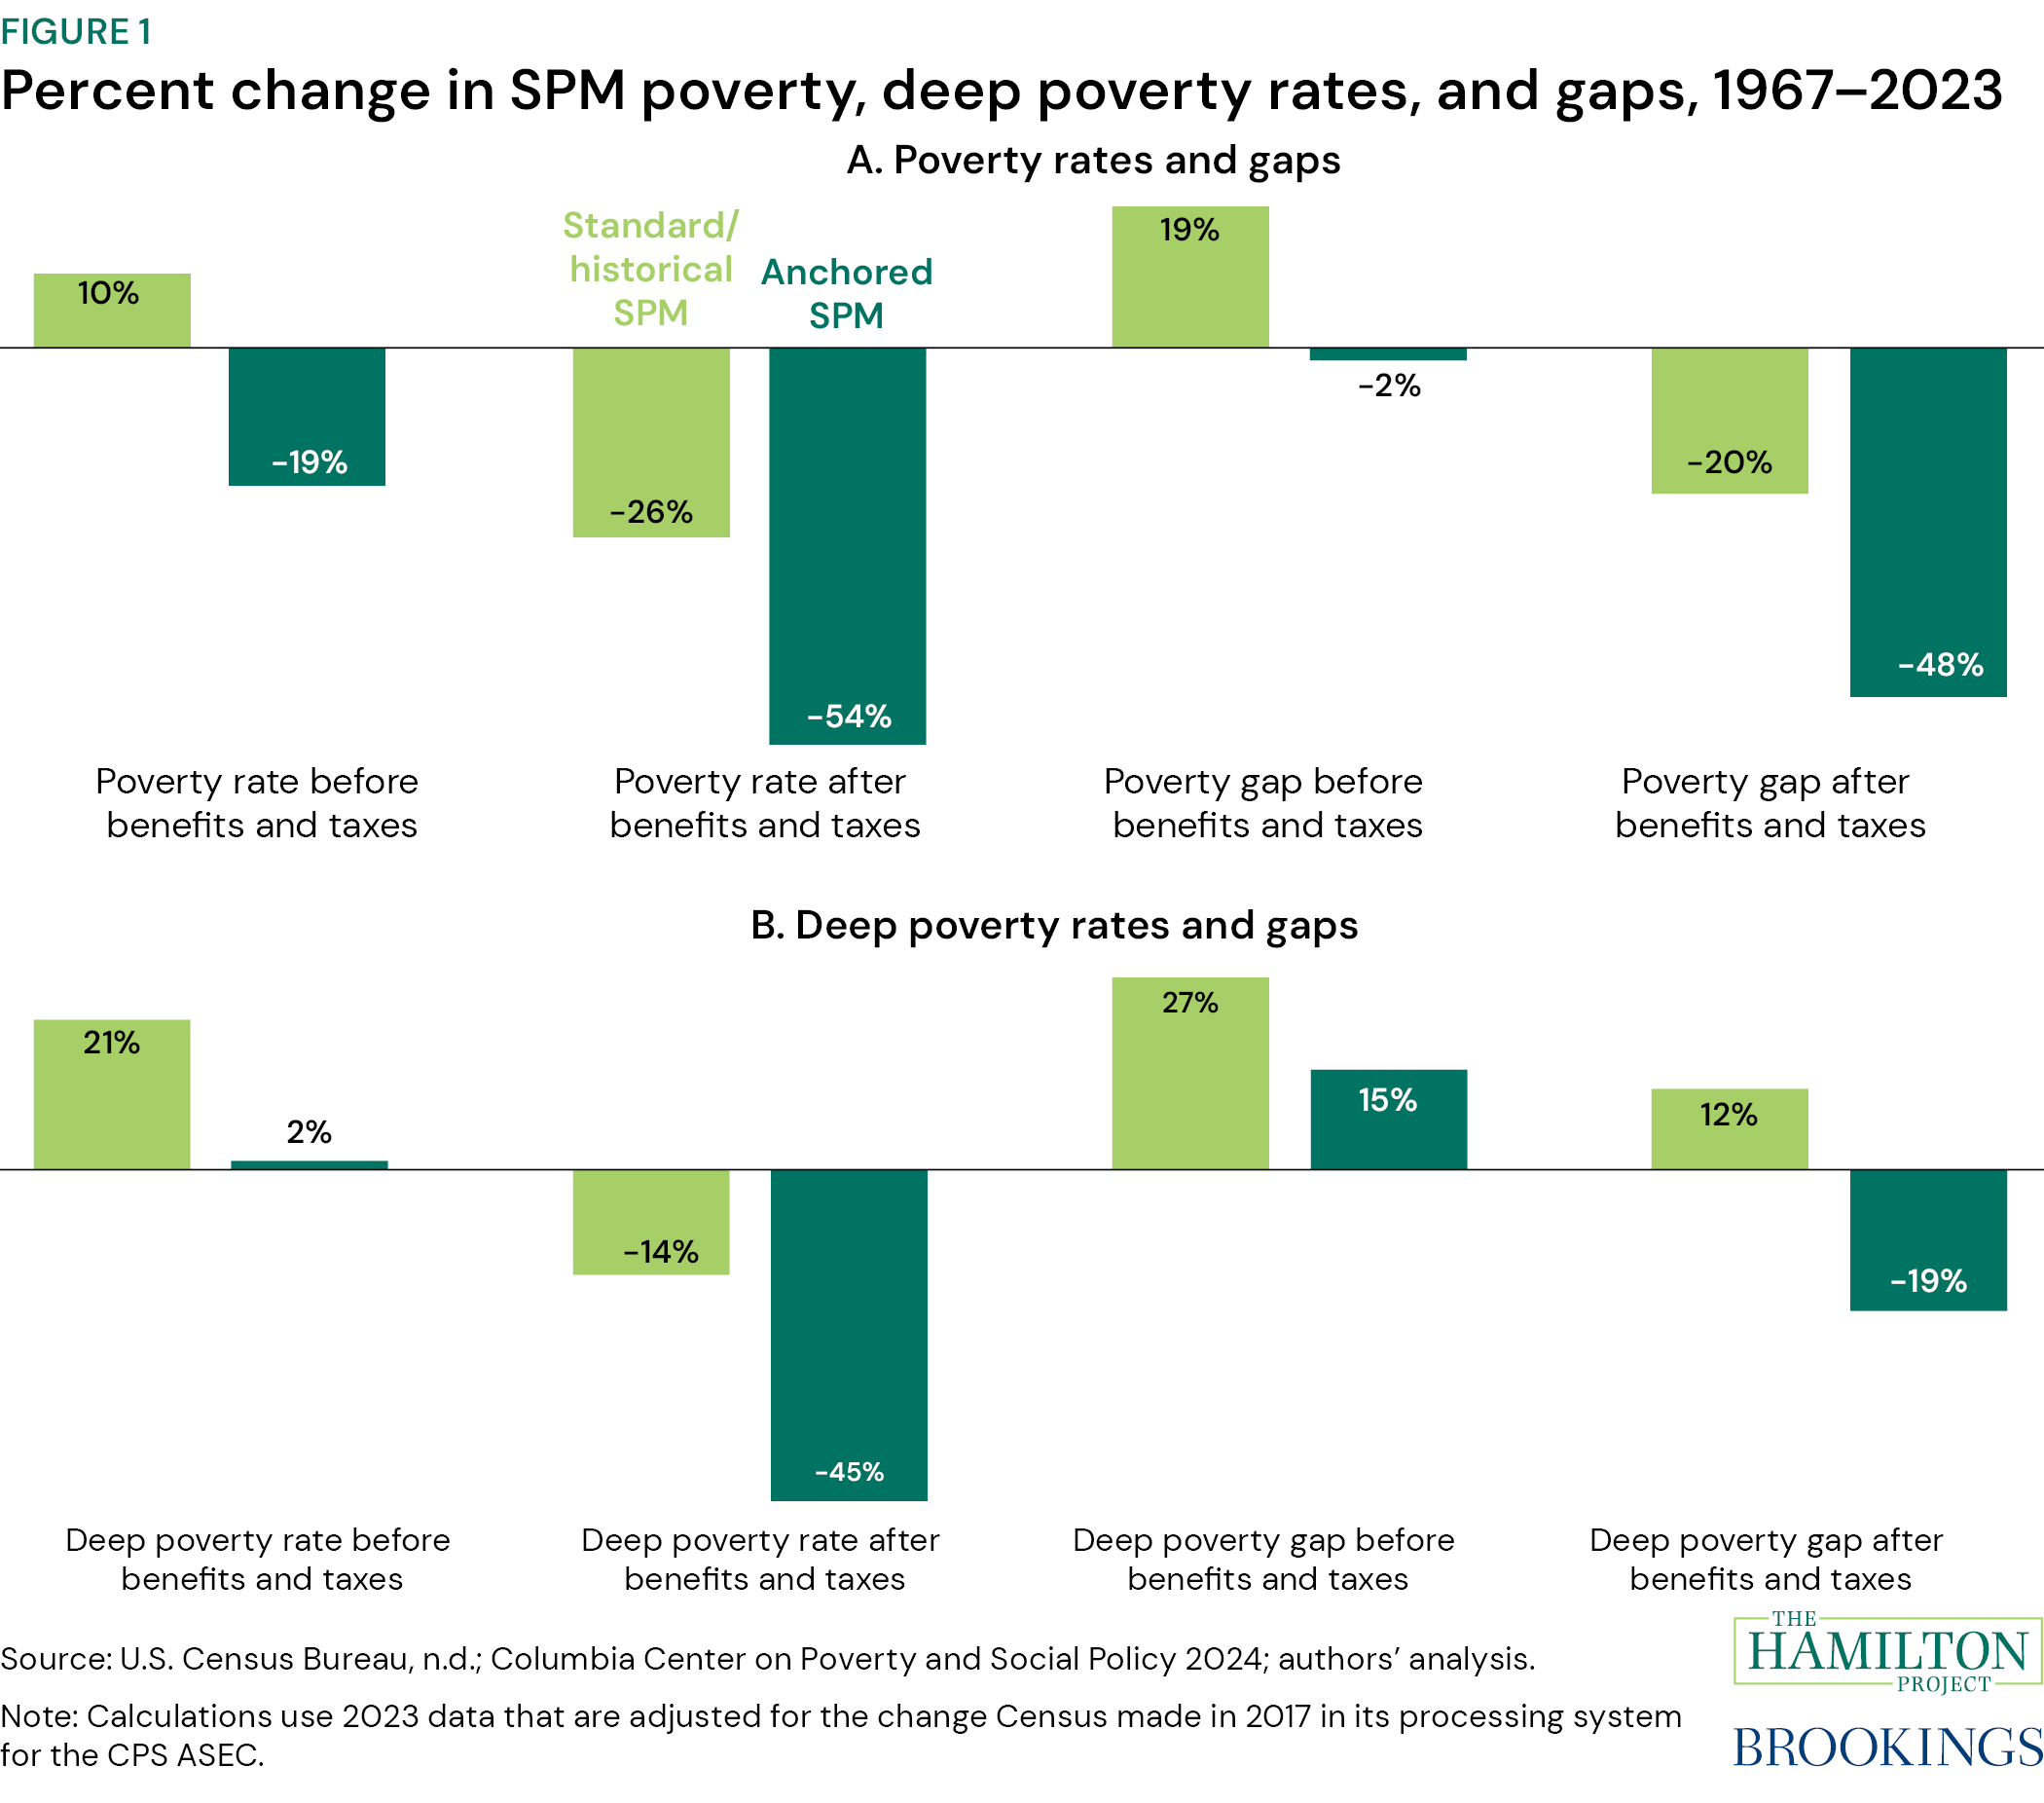
There has been less progress, however, in reducing deep poverty and especially in reducing the deep poverty gap, which does not show much improvement over this period. Our most concerning results are for people aged 18 to 64 who do not live with children.
These findings reflect both the overall strengthening of the U.S. safety net that occurred over this period—particularly for low-income working families with children and people 65 and over—and the failure of the economic growth that occurred over this period to generate substantial poverty reduction. The findings also reflect the weakening of the safety net for many very poor households who have little or no earnings and are not elderly or disabled. Since the late 1980s, substantial cuts have been made in cash assistance programs for such households.[1]
This paper relies on a series of data analyses that cover the years from 1967 to 2023, which can be found in the supplemental Excel tables published alongside this paper. The years 1967 and 2023 represent appropriate comparison years, with very similar unemployment rates in both years (U.S. Bureau of Labor Statistics [BLS], n.d.).[2]
These analyses were conducted using data from the Census Bureau’s Current Population Survey Annual Social and Economic Supplement (CPS ASEC), as well as historical Supplemental Poverty Measure (SPM) data produced by Columbia University’s Center on Poverty and Social Policy.[3] We created an anchored SPM series using the 2023 SPM thresholds, as adjusted for inflation, using the U.S. Department of Labor’s retroactive CPI research series (R-CPI-U-RS). Our analyses rest on more than a decade of pioneering work in this area by Christopher Wimer and others at the Columbia Center on Poverty and Social Policy, who first established SPM data series that extend back to the 1960s and have produced an array of papers on SPM poverty trends since then (Fox et al. 2015a; Fox et al. 2015b; Wimer et al. 2016; Wimer et al. 2025; Vinh et al. 2025).
In addition to its findings regarding poverty trends, this paper discusses several issues related to poverty measurement, including the advantages of using both the historical SPM and the anchored SPM to track changes in poverty over time. As explained below, this analysis uses both of these SPM measures to provide what we regard as upper and lower bounds for changes in SPM-measured poverty over time.
The paper opens with a discussion of these poverty-measurement issues and then provides data on changes in poverty rates and the poverty gap over the 1967–2023 period, using both of the SPMs and employing both 100-percent-of-poverty-line and 50-percent-of-poverty-line thresholds to measure changes in both in poverty and deep poverty. The paper then turns to a discussion of the role of safety net changes in affecting these results. Safety net expansions have played the predominant role in generating the large declines we see in the poverty rate and poverty gap, but sharp cuts in basic cash assistance for people who aren’t elderly or disabled and have little or no earnings have been a factor in the relative lack of progress on deep poverty for certain population groups.
Our analysis ends in 2023 and thus before the enactment and implementation of the One Big Beautiful Bill Act (OBBBA) of 2025, a measure that makes the deepest cuts in programs like the Supplemental Nutrition Assistance Program (SNAP, formerly known as the Food Stamp Program), Medicaid, and health coverage provided through the Affordable Care Act marketplaces in those programs’ histories. The bill also includes stiff cuts in the eligibility of various groups of legally present immigrants for certain benefits. Many of these reductions have not yet been fully implemented. When the rollbacks are fully in effect, they almost certainly will increase poverty and deep poverty rates and gaps, as well as the number of people who lack health coverage, and will thus reverse some of the gains reported here (CBO 2025b; CBO 2025c).
Read the full paper
Footnotes
[1] The Affordable Care Act’s Medicaid expansion increased public health insurance for this population, but that affects poverty rates under the Supplemental Poverty Measure (SPM), which we use in this paper, only to the extent that it changes people’s out-of-pocket health spending. The U.S. Census Bureau has recently started publishing each year an alternative poverty measure, called the Health Inclusive Poverty Measure (HIPM), that shows that when health care is included as a basic need in setting the poverty thresholds and health insurance is counted as a family resource, Medicaid and Medicare keep millions of people from falling below the poverty line (Creamer 2025)
[2] The national unemployment rate was 3.8 percent in 1967 and 3.6 percent in 2023. In addition, 2023 is the latest year for which TRIM-adjusted poverty data currently are publicly available.
[3] Columbia Center on Poverty and Social Policy, “Historical Poverty Trends and Measurement,” https://povertycenter.columbia.edu/historical-poverty-trends-and-measurement. We use SPM data from the Columbia Center for Poverty and Social Welfare Policy for years before 2009 and Census Bureau data for years since.