
See the accompanying interactive map to explore state-level variation in charter school access and enrollment between 2000 and 2015.
Introduction
The Hamilton Project’s mission is advancing opportunity, prosperity, and growth. Promoting a strong and innovative education sector is at the core of this mission. Access to high-quality education enables Americans to gain the knowledge and skills needed to achieve in the classroom and succeed in the workforce. Yet, the education system has fallen short of providing high-quality educational opportunities to all students and so the goals of the education sector are not being met. Within the United States there is stagnating student achievement on standardized test scores and slow growth in degree attainment as well as large gaps between advantaged and disadvantaged students on measures of student achievement and degree attainment.
In the past 25 years the idea of charter schools as a means for public education system innovation has emerged from a wide variety of sources. In 1988 the president of the American Federation of Teachers, Albert Shanker, spoke in support of a mechanism that would give teachers the ability to submit a proposal to create a new publicly funded school that was free of certain regulatory constraints in order to try innovative approaches to teaching and test their impacts. In 1990 the Brookings Institution published John Chubb and Terry Moe’s Politics, Markets, and America’s Schools. This book recommended rebuilding the American education system based on principles of market competition and deregulation, and suggested that, through parental choice and school autonomy, student achievement would improve.
Beginning in the 1990s with Minnesota, states started to pass laws to allow the establishment of publicly funded charter schools. In general, charter schools receive public funding the way traditional public schools do, but operate independently of local school boards or superintendents. Charter schools have used this autonomy in a variety of ways to structure their schools and classrooms innovatively. As Roland Fryer discusses in a Hamilton Project policy proposal, such practices include changing human resource practices, making instruction data driven, developing intensive tutoring programs, increasing the amount of time spent in the classroom, and setting high expectations.1 The second leg of charter school policy is the market hypothesis: providing access to charter schools will improve education through competition. The result of competition may be that all schools—charter and regular public schools alike—will improve because they face an increased threat of losing enrollment if they do not perform adequately. For charter schools to encourage school choice and competition, students must have reasonable access to them.
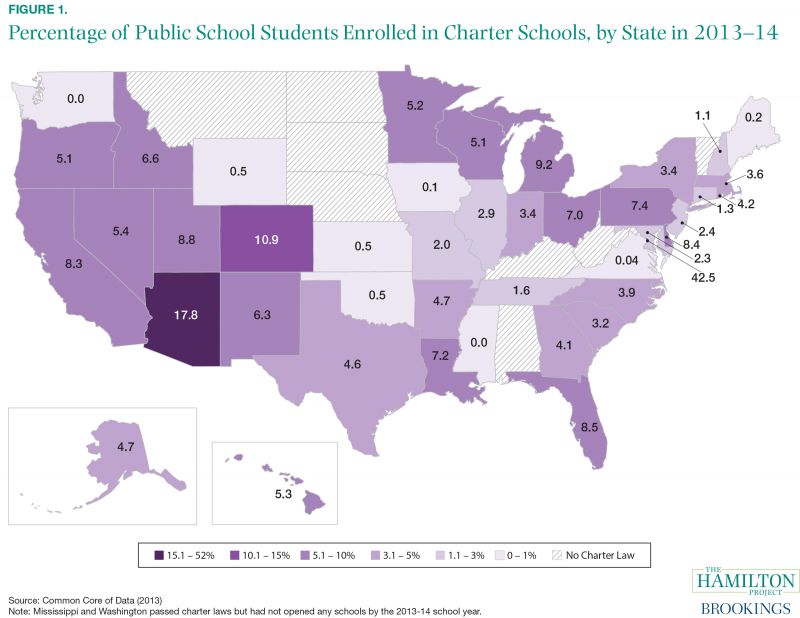
As of the 2014-15 school year, 42 states and the District of Columbia had passed charter laws and 6,648 charter schools were operating nationwide.2 In 2013–14, 5 percent of public school students nationwide attended a charter school, which is more than double the share 10 years earlier.3 As shown in figure 1, there is wide variation in charter school enrollment across states. Arizona has the highest share among states with nearly 18 percent of its public school students enrolled in charter schools.4 Several states, including Iowa, Kansas, Maine, Virginia, and Wyoming, have charter schools, but less than 1 percent of students attend them.
In this economic analysis, we look at access to charter schools at a market level to measure the share of students who live close enough to a charter school as to have the choice to attend a charter school or not. Nationwide, 32.4 percent of students in states have local access to a charter school—defined as living in the same zip code tabulation area (ZCTA) as a charter school.5 This analysis documents that access to charter schools has grown over the past two decades and access to charter schools differs dramatically across states. While the vast majority of states—41 in all—have at least one charter school, states and localities vary widely in the extent to which students have access to charter schools and thus school choice. An accompanying interactive state map breaks out access by year and race/ethnicity.
Charter School Access
Whether a student can choose to enroll in a charter school depends on many factors, the most fundamental of which involve access. School choice is constrained by local access, meaning whether there is a charter school near the student’s home and whether transportation is available from the student’s home to the charter school. School choice is also constrained by open enrollment policies; while many states require charter schools to provide open enrollment to all students, others allow charter schools situated within existing school districts to admit only those students living in that district.6 Access to a student’s school of choice is also constrained by whether there are any enrollment slots available at a preferred school, though data limitations prevent an assessment of this factor.
In this economic analysis we focus on local and enrollment access. Using national data on school characteristics, we quantify charter school access as whether there is a charter school in a student’s local area, operationalized as a student residing in the same zip code tabulation area (ZCTA) as a charter school.7 The Census Bureau created ZCTAs as a unit for data collection because they are not limited to postal routes like zip codes and each ZCTA was sized to contain roughly equal numbers of inhabitants. Many scholars have used ZCTAs because they establish boundaries of local residential environments like neighborhoods, which capture our goal of defining local school access. By this definition, access to a charter school has grown substantially over time but varies widely across states and by student characteristics.
Access over Time
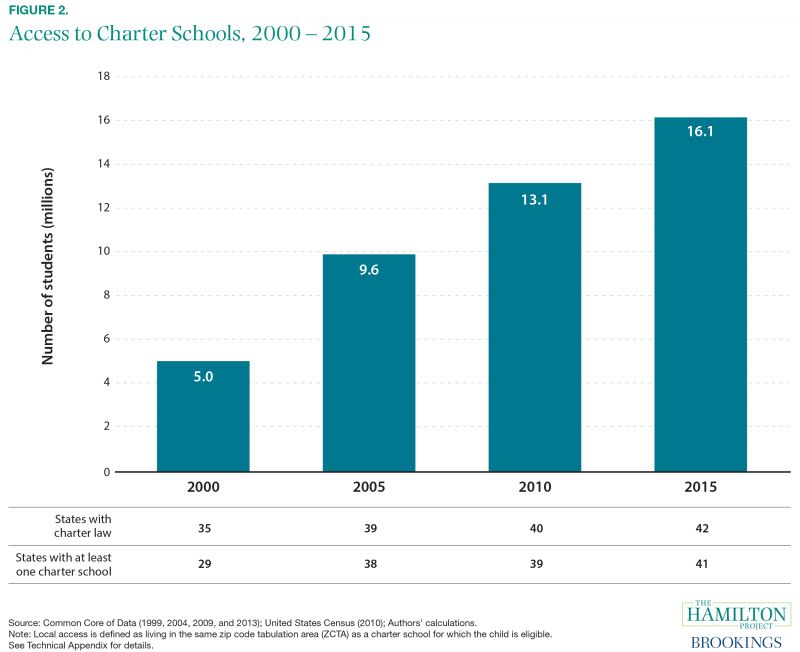
Minnesota became the first state to enact a charter law in 1991, followed by California in 1992 and five additional states in 1993. Since then, local access to a charter school has grown significantly, from 5 million students in 2000 to nearly 16 million in 2014. As of the 2014–15 school year, eight states had chosen not to authorize charter schools at all: Alabama, Kentucky, Montana, Nebraska, North Dakota, South Dakota, West Virginia, and Vermont had not enacted charter laws (see figure 2).8
The increase in charter school access has been driven by charter schools opening as states adopted charter laws and expansion within states with charter laws, either through business-as-usual expansion or after a revision to a legislated cap on the number of charters a state could grant.9 In 2014-2015, 22 states do not have a cap on the number of charter schools. Five of the states that had no charter law in 2000 had opened at least one charter school by 2015. For example, Tennessee did not have a charter law in 2000 and passed one in 2002; by 2015 access in the state had risen to 13 percent. On the other hand, both New Hampshire and Arkansas had a charter law but no charter schools in 2000 and by 2015 had increased the percentage of students with access to a local charter school to around 24 and 25 percent, respectively. In Arizona, which had the highest level of access in 2000 at 65 percent, access has continued to increase, and was at 84 percent in 2015.
Access across States
States have a range of access to charter schools, ranging from a low of 0.2 percent of students in Washington State (with one charter school) to 47 percent of students in neighboring Idaho (see figure 3). In 2014-15 the Southwestern states of Arizona, Colorado, New Mexico, and Utah led the nation in charter school access: in each state, more than half of students have access to charter schools. Arizona was an early adopter of charter schools; it passed a law authorizing charters in 1994 and has consistently led the nation in charter school access and enrollment over the 15 years for which data are available. State-level variation in authorizing legislation can affect access. Many states, like Colorado and Florida, are notable for allowing an unlimited number of charter schools, whereas other states such as Massachusetts impose legislative caps on the number of charter schools that may be authorized. Arizona also makes it easier for charter schools to open by allowing multiple organizations to authorize charter schools, giving wide latitude to who can open a charter school, allowing private schools to convert to charter status, setting 15-year charter terms with reviews every five years, and providing more than 80 percent of charter school funding at the state (as opposed to the local) level.
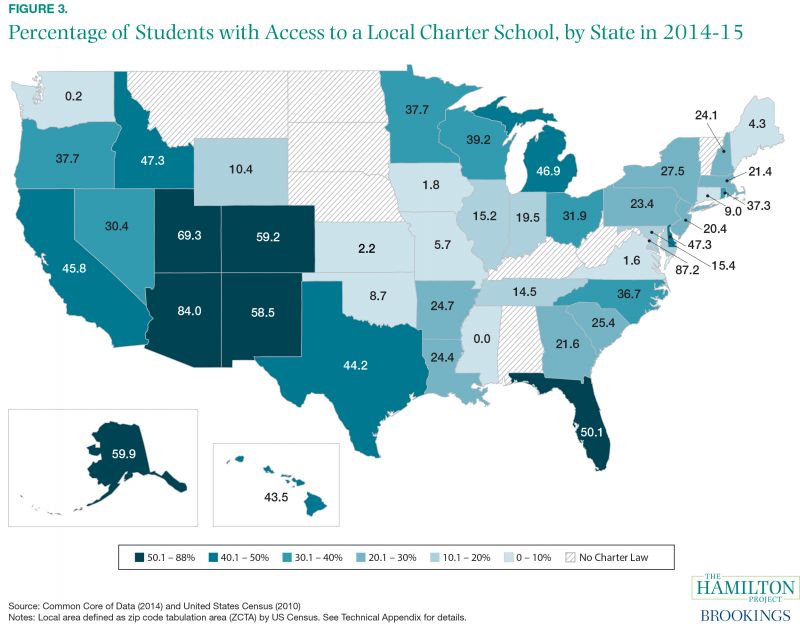
The expectation that charter schools will be closed if they fail to perform is an important part of a market-based reform. In Arizona more than 100 charter schools closed between 2001 and 2009, resulting in a dip in the share of students in the state with local access to a charter school in 2005. In Ohio 41 charter schools (roughly 10 percent of all Ohio charter schools) closed going into the 2014–15 academic year alone, but access continued to increase slightly as new charter schools opened. The grounds for these closures vary, but the major reasons cited are inadequate enrollment, poor academic performance, and financial issues.
Access by Race and Ethnicity
While some maintain that charter schools are powerful tools to improve outcomes for low-income, typically minority students because they enable students to choose schools outside of their neighborhood, others argue that charter schools present ways for more-advantaged parents to avoid local schools that serve primarily minority students. Comparing charter school access across white, Hispanic, African American, and Asian American/Pacific Islander students suggests that African American and Hispanic students have substantially higher access to charter schools in most states. This finding is generally supported by the academic literature on charter school location, which suggests that charter schools tend to locate in communities with concentrations of minority students. Some research suggests that, on average, African American and Hispanic households are more likely to prefer charter schools than are white households. Because they are subject to market forces, charter schools tend to locate where they can expect sufficient local demand.
Charter School Enrollment
Geographic charter school access is a meaningful measure of the availability of school choice, but it represents just one factor in a student’s decision to enroll in a charter school. For access to translate into enrollment, families must know that school choice is an option, they must want to enroll their student at the school, they must attempt to enroll, and there must be available slots in the appropriate grade level of the preferred charter school. The latter is a binding constraint in some areas: the high demand for charter schools in certain areas has forced many schools to allocate open seats via a lottery system. However, as we show below, on average access is positively correlated with enrollment.
Enrollment by Type of Area
Charter school enrollment differs sharply across urban, suburban, and rural areas. Charter schools are more heavily concentrated in urban areas than in suburban or rural ones. 57 percent of charter school enrollment is in urban areas, compared with 31 percent of public school enrollment overall. There is a wide range of enrollment in charter schools in urban school districts, with Louisiana’s all-charter school district in New Orleans boosting it to among the states with the highest urban enrollment share in charter schools. Research suggests that charter schools tend to locate in urban areas with high concentrations of minority and low-income students.
At the other end of the spectrum, enrollment in rural charter schools is lower overall but still serves a substantial share of students in some states, particularly in the West. Like their urban counterparts, rural charter schools tend to serve concentrations of low-income students, but face their own unique set of challenges including difficulty finding adequate facilities and a smaller and more dispersed pool of students to draw from. Enrollment in suburban charter schools tends to fall somewhere in between, as the interactive maps that accompany this economic analysis illustrate.
Enrollment Conditional on Access
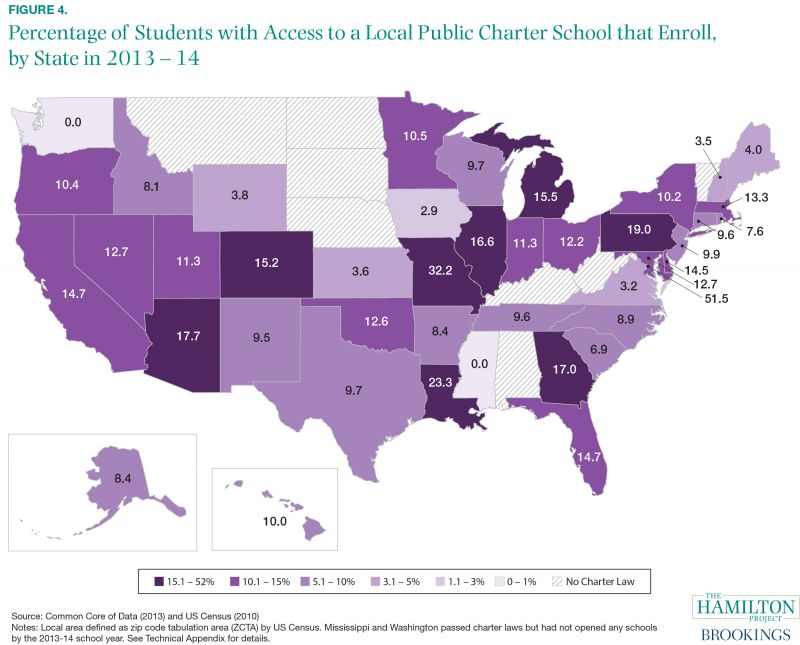
This analysis has focused on local access to a charter school because that is the first—but not only—condition necessary for students to have the ability to choose a charter school. Access is also the most directly tied to the policy levers available, which can increase the availability of charter schools but does not compel children to attend them. It is reasonable, though, to ask whether access predicts enrollment in charter schools. At the state level there is a strong positive relationship between access to and enrollment in charter schools. For the 2013-14 school year, on average a 10 percentage point increase in access predicts a 2.3-point increase in charter school enrollment share.
Figure 4 shows charter school uptake—that is, the percentage of students that enroll in a charter school conditional on having geographic and enrollment access. This map shows state-level variation in whether students are choosing charter schools if they have access to them. The overall rates of charter school uptake are, as expected, much higher than for total charter enrollment rates due to conditioning on access. While Arizona remains in the top category, other states such as Missouri, Louisiana, and Pennsylvania have even higher uptake rates conditional on their lower level of access to charter schools.
Conclusion
This analysis documents dramatic differences in charter school access—a key component of the school choice decision. Over a third of students have access to a charter school in roughly one-third of all states, and over 30 percent of students have access nationwide. Enrollment is correlated with access: in 2015, on average a 10-percentage point increase in access predicts a 2.3-point increase in charter school enrollment share.
While the majority of state charter laws allow for either statewide open enrollment or interdistrict open enrollment, a small number of states do not have open enrollment. In these states, students are restricted to applying for a seat at a charter school in their home district but are not allowed to apply to a charter school in a neighboring district. For thousands of students in seven states, there is local access to a charter school but not enrollment access. Less-restrictive enrollment policies increase access to choice.
Increasing educational opportunities for students, whether through charter schools or other approaches, represents a key interest of The Hamilton Project because a quality education is essential to attaining individual economic security and broad participation in economic growth. Charter schools are one important way to increase school choice and competition in the education system.
Acknowledgments
We would like to thank David Figlio, Philip Gleason, Robert Hughes, Margaret Raymond, and Russ Whitehurst for helpful comments.
1 Fryer’s research is based on urban charter schools. There are also charter school policies and practices adapted to students who live in suburban and rural areas, such as deploying online education to make up for distance from school facilities. There are also charter schools that are organized to serve particular students, such as teen mothers or ex-offenders.
2 Including 231 virtual charter schools, the total is 6,879 charter schools. We exclude virtual charter schools from the access portion of our analysis due to our focus on geographic location and lack of classification for virtual schools prior to the 2013-14 schoolyear in the Common Core of Data. On March 19, 2015, Alabama passed its first charter law.
3 The Common Core of Data includes enrollment data only through school year 2013–14, but provides other relevant school data through 2014–15. As a result, in this analysis the enrollment graphs (figures 1 and 4) are for 2013-14, while the most recent school year for the access graphs (figures 2 and 3) is 2014–15.
4 The District of Columbia has 43 percent of students enrolled in charter schools, but is not a state.
5 This access measure does not address whether there are enrollment slots available in the charter school. There is no systematic information available on seats available or whether charter schools are operating at capacity.
6 We account for this in our analysis by utilizing the fraction of students that attend the school district with a charter school to scale each ZCTA down appropriately in states without open enrollment policies.
7 Two other approaches to defining access are to measure district-level access and access based on distance to a charter school. Due to state-level variation in the geographic size of school districts and open enrollment policies, district-level access is a less precise measure than ZCTA-based local access. David Figlio and Cassandra Hart utilize a five-mile radius based on distance between feeder schools and private schools to define local access to a Florida voucher program. We prefer to use ZCTAs as the geographical area to determine access to charter schools nationwide because ZCTAs must be inclusive of contingent land masses and so access would not be overestimated based on assumptions of topography. In addition, the radius approach requires a second data point, but these data do not include student addresses and using the ZCTA centroid would overestimate access beyond the five-mile radius.
8 On March 19, 2015, Alabama passed its first charter law.
9 Policies on charter schools caps take many forms, only one of which is restricting the number of charters that can be granted. For a current review of state variation in charter school regulation, please see the National Alliance for Public Charter Schools’ database.