Related Charts
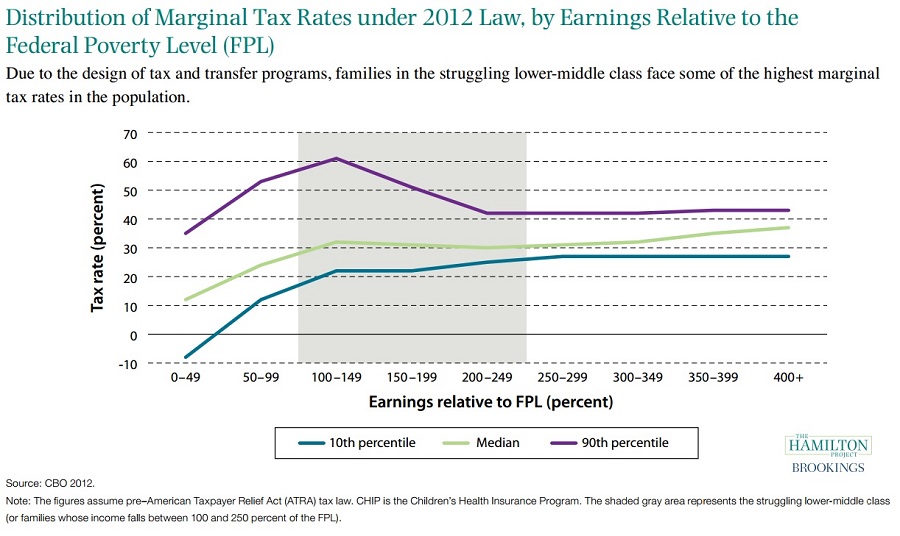
Distribution of Marginal Tax Rates under 2012 Law, by Earnings Relative to the Federal Poverty Level (FPL)
This set of economic facts, and corresponding charts, describes key conditions and challenges facing lower-middle-class families. This figure illustrates how marginal tax rates can be extremely high for some low- and middle-income families as their earnings move them into the range of income where transfer programs are phased out and positive marginal tax rates kick in.
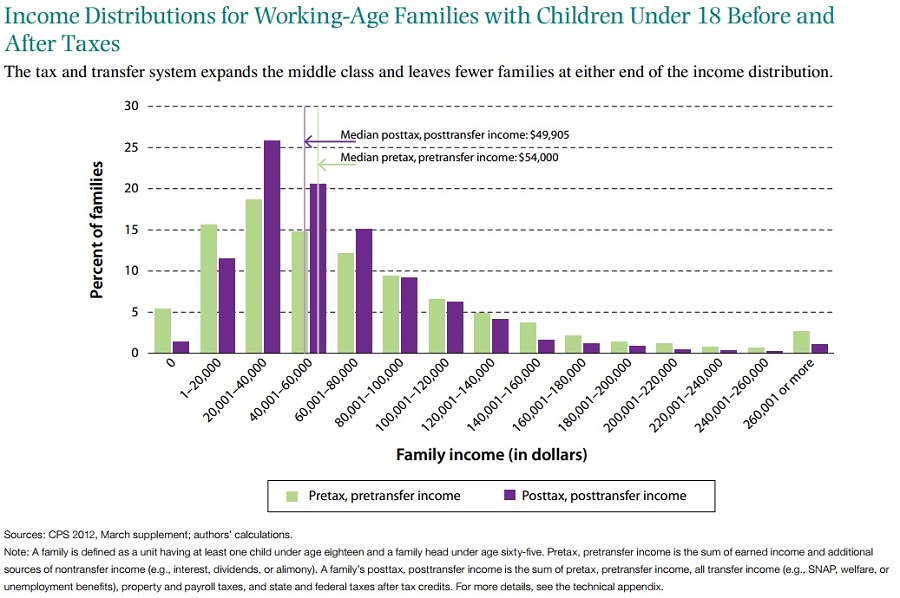
Income Distributions for Working-Age Families with Children Uner 18 Before and After Taxes
This figure illustrates how the tax and transfer system changes the distribution of income for working-age families with children.
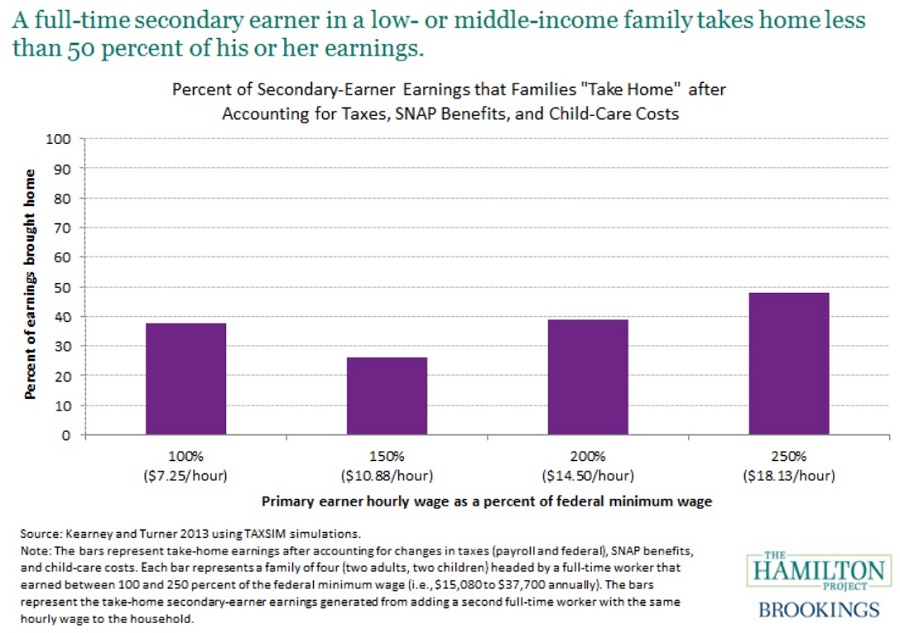
Percent of Secondary-Earner Earnings that Families “Take Home” after Accounting for taxes, SNAP Benefits, and Child-Care Costs
This figure examines how the current tax system hampers low- and middle-income families with two working spouses.