
For the past few years, The Hamilton Project has released an annual report characterizing poverty in America. Describing who is poor is critical for making anti-poverty policy and directly relevant to determining eligibility for means-tested programs.
In 2017, 12.3 percent of the population—39.7 million people—lived in poverty, as defined by the official poverty measure [1]. The share of the population living in poverty was statistically significantly lower in 2017 than in 2016 by 0.4 percentage points.
In this economic analysis, I characterize those who were living in poverty in 2017 using the U.S. Census Bureau’s Current Population Survey Annual Social and Economic Supplement (ASEC), the source of official poverty statistics.
The U.S. Census Bureau is tasked with determining how many people in the United States were living in poverty each year according to the official poverty measure. The official poverty measure has applied the same formula since the 1960s to determine whether a family is below the poverty threshold: a household’s pre-tax income must be less than the current value of three times a minimum food diet in 1963 (adjusted for family composition). Using ASEC data, I describe the characteristics of those living in poverty, as well as the characteristics of the working-age poor and those working-age poor who were employed less than full-time year-round using the same methods as previous reports.
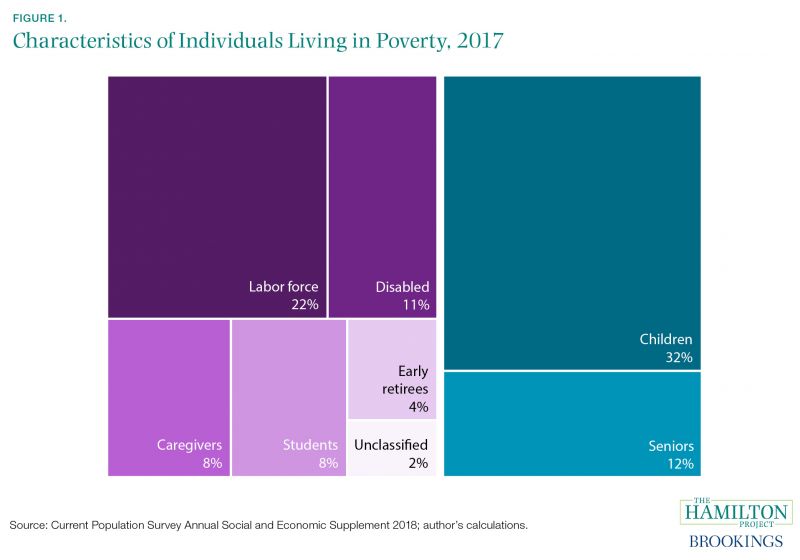
Figure 1 shows that about a third of those living in poverty in 2017 were children, about an eighth were senior citizens, and more than half were working–age (18- to 64-year-olds) adults.
There were a few notable shifts in the composition of who is poor from 2016 to 2017, including among working-age labor force participants (-1.1 percentage points change in share of those living in poverty) and children (-.4 percentage points change in share). By contrast, students (+.6 percentage points), seniors (+.5 percentage points), and early retirees (+.4 percentage points) all became slightly larger portions of the total population living in poverty.
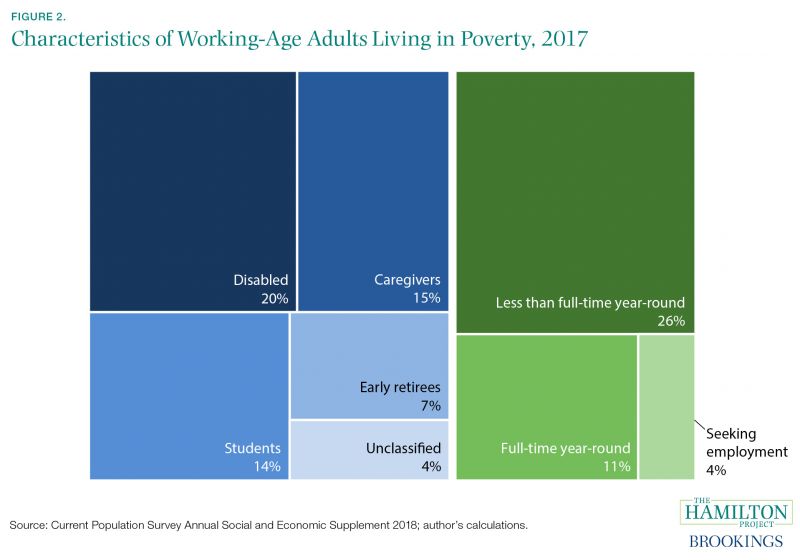
Looking just at working-age adults (figure 2), their declining share of the overall population living in poverty is being driven by a relative reduction in the number of those in poverty working less than full-time year-round (-2.0 percentage points). Rising hours worked have helped, but more than one in 10 of the working-age poor worked full-time all-year but with insufficient earned income to lift them out of poverty [2].
As in previous years, 18 to 64 year-old labor force nonparticipants living in poverty gave a variety of reasons for their nonparticipation. A third of this group were disabled, a quarter were caregivers, and almost a quarter were students. Only one in 10 were early retirees. Only 7 percent of nonparticipants—4 percent of the working-age poor overall—gave other reasons for nonparticipation.
Finally, figure 3 describes the reasons given by adults living in poverty for working part-time in the past week. (This is measured in March 2018 and is a different population than those who worked less than full-time year-round in 2017.) Because working more hours would help to lift a substantial share of these workers out of poverty and because a strengthening economy is most likely to help these workers, their reasons for not working more are policy-relevant.
A large portion of this group—29 percent—continues to be those who work part-time involuntarily (i.e., they would prefer full-time work but cannot obtain it), though this share continues to decrease from its 2010 peak. This improvement continued in the most recent data, as the share of the working-age poor working part-time involuntarily fell 3.2 percentage points from 2017 to 2018. Involuntary part-time work among the working-age poor spiked during the Great Recession, growing from approximately 950,000 in 2008 to 2 million in 2010. In March of 2018, 824,000 people in poverty were working part-time involuntarily.
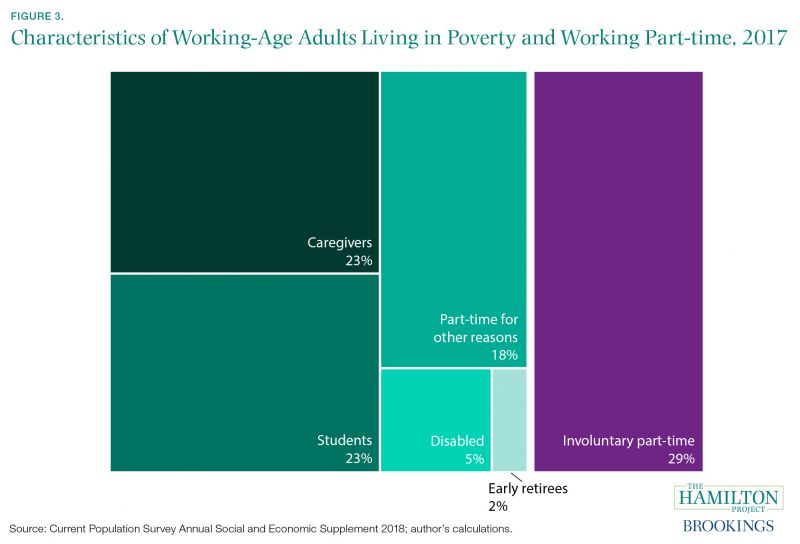
Part-time workers living in poverty gave a number of other reasons for not working full-time. About half of working-age adults living in poverty and working part-time were caregivers and students. As involuntary part-time work became a slightly smaller problem, both students (+1.3 percentage points) and caregivers (+.2 percentage points) saw their shares increase from 2017 to 2018. About a fifth were part-time for other reasons, and a small share were disabled or early retirees.
The overall decline in poverty—to be expected as the labor market strengthens—is certainly encouraging. However, the fact that so many of the poor face significant barriers to working their way out of poverty (e.g., caregivers, students, and the disabled) suggests that more targeted interventions are necessary. And while the strong job market continues to reduce the share of those living in poverty who are working part-time, there nevertheless remain millions of Americans who are working full-time all year but at wages insufficient to lift them out of poverty.
[1] There are multiple ways to measure poverty, including the consumption and supplemental poverty measures. The U.S. Census Bureau also provides estimates for the Supplemental Poverty Measure. By this measure, 13.9 percent of people in the U.S. were poor, 1.6 percentage points higher than the official measure. By the supplemental measure, poverty in 2017 was not statistically significantly different from 2016.
[2] Work forthcoming from The Hamilton Project will look at the Supplemental Poverty Measure and the contribution of programs, including the Earned Income Tax Credit, to reducing poverty.