Improvement in living standards over time is not inevitable or automatic. Rather, it is made possible by increases in physical and human capital, technological progress that itself might require large investments, and well-designed institutions. In this set of eleven economic facts, we explore central features of the innovation system, including patents, research and development (R&D) investments, and science, technology, engineering, and mathematics (STEM) education. Following this analysis, we highlight opportunities to enhance the effectiveness of the innovation system, thereby contributing to faster technological progress and economic growth.
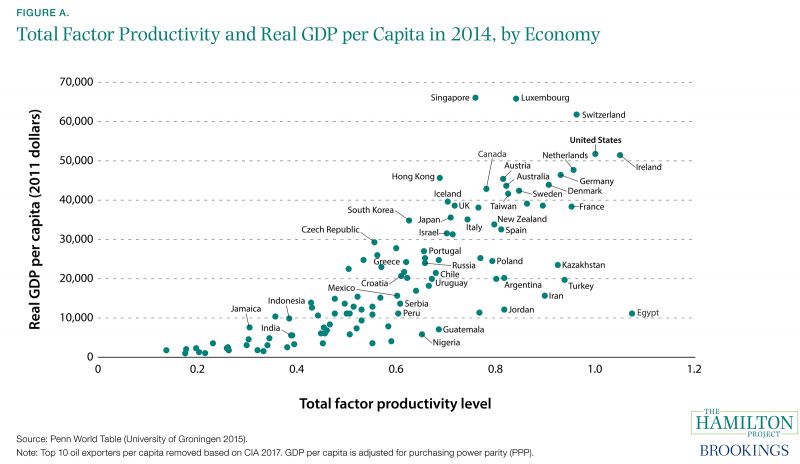
It is difficult to overstate the importance of technological progress for living standards. Consider the example of Argentina and Austria, as shown in figure A. These countries have roughly the same level of per capita inputs (labor and capital), but there is a vast gulf between them in economic output: Austria’s per capita income is more than double Argentina’s. Labor and capital play vital roles in generating economic output and helping to explain differences in national incomes, but large disparities in per capita national income—in other words, national living standards—are due to the various ways that economies use their resources, and not just to the quantities of resources available.
In the language of growth accounting, total factor productivity (TFP) is the measure of how effective an economy is at producing economic output with a given amount of inputs. Across developed and developing economies, the majority of per capita income differences are due to total factor productivity variation (Hall and Jones 1999; Klenow and Rodríguez-Clare 1997). In other words, most of per capita income differences are not explained by differences in available capital and labor. Moreover, sustained growth over time in per capita incomes requires growth in TFP (Solow 1957). Without technological progress, increases in labor and capital have a bounded potential to raise per capita income.
Read the Full Introduction
Figure A shows how important TFP is for understanding per capita income. On one end of the spectrum there are countries like Germany and the United States that have relatively high TFP, indicating a high level of efficiency in use of both human and physical capital. On the other end of the spectrum, countries like India and Indonesia have low TFP, indicating that the way they combine labor and capital is less efficient.
Total factor productivity is, in part, a reflection of differences in policies and institutions. Even if two countries have implemented the same technologies, their economic output will differ if one country has institutions that better support growth (Acemoglu, Johnson, and Robinson 2005). However, while institutions and rules form the foundation of an economy and shape incentives, much of the variation in TFP reflects differences in the availability and efficient deployment of technology and innovation in business practices (Bloom and Van Reenen 2010; Isaksson 2007).
U.S. TFP growth was rapid in the decade after World War II, but slowed around 1973. There was a brief increase in U.S. productivity growth beginning in the mid-1990s, but that also faded, and recent U.S. productivity growth has been disappointing. Given the central importance of productivity growth for improvements in living standards, the weaker TFP growth in the United States in recent years is a serious concern. Notably, though TFP and GDP growth are not measured perfectly, mismeasurement cannot account for the recent slowdown in productivity growth (Byrne, Fernald, and Reinsdorf 2016; Syverson 2017).
Slowing productivity growth is both a matter of declining technological progress and a lack of skills necessary to adopt existing technologies (Baily 1986; Baily and Montalbano 2016). One account of the recent U.S. decline puts primary emphasis on the limited usefulness and number of recent technological innovations—focused in entertainment, communication, and information processing—when compared with the advances of earlier generations, such as electricity and the internal combustion engine (Gordon 2016). Some researchers contend that the financial crisis of the late 2000s slowed the implementation of innovation (Anzoategui et al. 2017) and that changing demographics can lower TFP growth (Feyrer 2007). Noted productivity scholar John Fernald found that the slowdown in productivity growth began in 2004 as the impact of the late 1990s tech boom faded, with only a limited role for the later financial crisis (Fernald 2015).
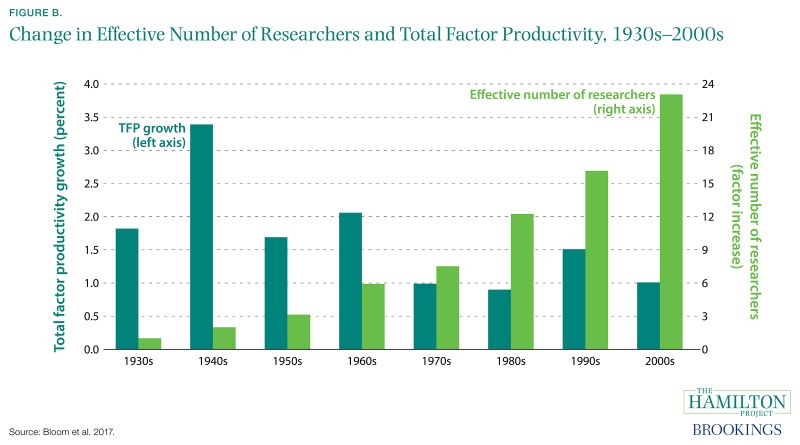
Compounding the puzzle of diminished productivity growth—the output of the innovation pipeline—is the rise in the inputs to innovation. Bloom, Jones, Van Reenen, and Webb (2017) compare TFP growth and R&D inputs (figure B). As TFP growth weakened from 2.1 percent in the 1960s to 1.0 percent in the 2000s (dark green bars), the effective number of researchers—defined as the number of researchers who can be hired with each decade’s research expenditures—grew steadily (light green bars). Bloom and coauthors describe this pattern as resulting from declining research productivity, with new technological progress requiring ever-larger research investments.
The implication of this analysis is that when it comes to innovation, ever more investment is required even as the productivity growth rate falls. This is likely due to some combination of having exhausted the simpler opportunities for technological progress, as well as inefficiencies in the innovation-generating pipeline. The former could be an inevitable feature of technological progress, but inefficiencies in the pipeline can be addressed.
Patents and the patent system are a primary focus of efforts to remove such inefficiencies and spur innovation. The design of the patent system must be carefully calibrated to balance costs and benefits: On the one hand, patents help innovators to obtain more of the returns from their work, thereby increasing the incentive to undertake costly investments. On the other hand, patents limit competition and can be a source of temporary monopoly power; for example, a competitor might be prevented from designing a new product that builds on a patented invention (Schumpeter 1943). Patent litigation—or simply the threat of litigation—is also costly, as are dense accumulations of patents, which can discourage innovation in ways that are significant but hard to quantify (Cockburn and MacGarvie 2009).
Consequently, it is important that patents be granted only when they meet certain standards of novelty, non-obviousness, and usefulness. In these cases, the social benefits of the patent are more likely to exceed the social costs. When patents do not meet these standards—when they are invalid—they benefit only the patent recipient while causing harms to other firms and consumers. In a new Hamilton Project policy proposal, Michael Frakes and Melissa Wasserman discuss reforms to the U.S. patent system that would discourage the granting of invalid patents.
Invalid patents and other challenges in the innovation pipeline can be overcome only if the determinants of innovation are well understood. Chapter 1 of this document examines the process of innovation and some of its key inputs, including R&D investments, STEM education, and immigration flows that bring innovators to the United States. Chapter 2 illustrates some of the challenges: the geographic concentration of innovation, the limited involvement of women in STEM work, the social costs of invalid patents, and the long time lags in the innovation pipeline that can make it difficult to bring new technologies to market. Addressing these challenges advances The Hamilton Project’s core goal of promoting broadly shared economic growth.
Chapter 1: The Process of Innovation
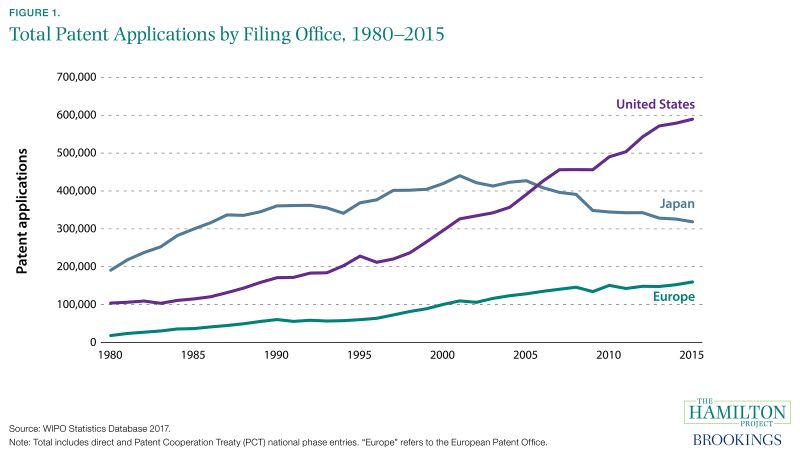
Fact 1: The U.S. Patent Office receives six times as many applications as it did in 1980.
Patent counts are one way to measure innovation. They are an imperfect measure, however, because patents vary in importance and some might be low quality (Pavitt 1988). Countries differ in terms of patent standards, market size, and what types of innovations can be patented, among other differences (Nagaoka, Motohashi, and Goto 2010). Due to varying standards, it is more difficult to make cross-national and over-time comparisons; making those comparisons can be informative about both innovation and differences in countries’ patent systems, however.
Figure 1 shows patent application trends for the Trilateral Patent Offices: the U.S., Japan, and European Patent Offices (USPTO, JPO, and EPO, respectively). Since 2006 the United States has exceeded Japan and Europe in patent applications. Part of the recent increase is due to the rise of foreign patenting activity in the United States (Leydesdorff, Etzkowitz, and Kushnir 2015). Increasing volume has led to a current backlog of more than 500,000 applications at the USPTO (USPTO 2016).
For decades, the United States has been the leader in international patent applications filed by its residents, (World Intellectual Property Organization [WIPO] 2017). When a patent has been granted by the USPTO and filed with all three of the Trilateral Patent Offices (such patents are referred to as triadic patent families), the patent is less likely to be invalid or improperly granted, particularly given that, compared to the USPTO, the JPO and EPO are believed to apply stricter scrutiny to applications (Picard and van Pottelsberghe de la Potterie 2011).
Increases in patent applications can also be misleading. Chinese patent volume, not shown in figure 1, has skyrocketed since the mid-2000s (Five IP Offices 2015), but few are triadic patents (OECD 2017). Moreover, Chinese international patent applications receive only 34 percent of the citations accrued by the average international application, further suggesting that Chinese patents are of lower quality (Boeing and Mueller 2015).
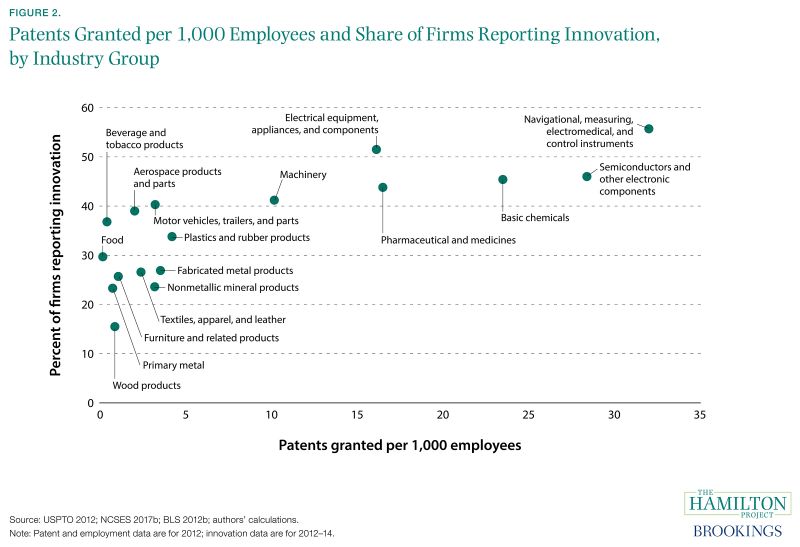
Fact 2: Patenting is closely related to other measures of innovative activity.
Though many patents are certainly valuable to workers and firms that possess them (Kline et al. 2017), it might be less immediately obvious whether patents are closely associated with innovation. Measuring this link is critical to understanding both the social benefits of the patent system and the usefulness of the patent-based approach to analyzing innovation.
In figure 2 the share of firms reporting that they had implemented an improved product, service, or business method is plotted against the number of patents generated by every 1,000 employees. In industries with no patent activity, there is wide variation in whether firms report engaging in innovation. By contrast, in those industries where patents are common, including industries like semiconductors and basic chemicals, reported innovation is consistently higher.
Importantly, this innovation measure is independent of information about patents, and derives from a survey of businesses that collects data regarding innovative activities. Figure 2 is consistent with research finding that patents are closely linked to innovation; patent counts are one of the most commonly used proxies for innovation (Jaffe and Traitenberg 2002; Kogan et al. 2017).
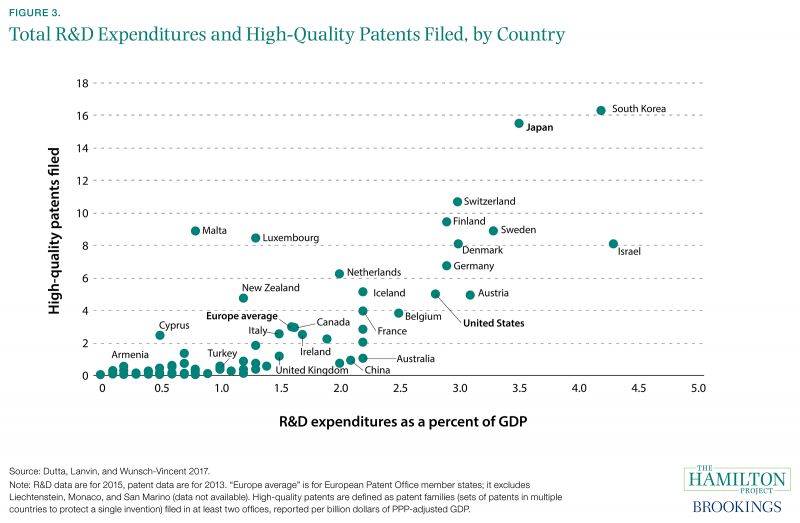
Fact 3: Countries that invest more in R&D tend to produce more high-quality patents.
R&D spending—a key input into the innovation pipeline—is associated with a higher output of high-quality patents (defined as those filed in at least two offices). This relationship is evident within countries (see fact 8), and is also apparent when comparing countries, as shown in figure 3.
Countries with relatively low R&D spending (calculated as a fraction of purchasing power parity [PPP]-adjusted GDP), like Italy and Turkey, tend to produce few high-quality patents. Countries with high R&D spending, like Japan and South Korea, tend to produce many more high-quality patents. Interestingly, some countries under- or out-perform their R&D spending, as in the cases of China and New Zealand, respectively. China is catching up to the United States in terms of R&D spending, now accounting for 20 percent of worldwide R&D, as compared to the United States’ 30 percent (UNESCO 2016), but China is not producing a proportionate number of high-quality patents.
Of course, R&D can yield innovation without generating patents that are filed in multiple patent offices. In particular, if two countries’ firms have differing levels of interest in filing their patents internationally, their positions in figure 3 would be different.
Moreover, R&D expenditures are often allocated quite differently across countries. For example, more than two-thirds of U.S. R&D occurs in biopharmaceuticals, software, and technology hardware. By contrast, R&D spending in the European Union and Japan is much more concentrated in the automotive sector (European Commission 2016).
Fact 4: Federal R&D spending has declined while business R&D spending has risen.
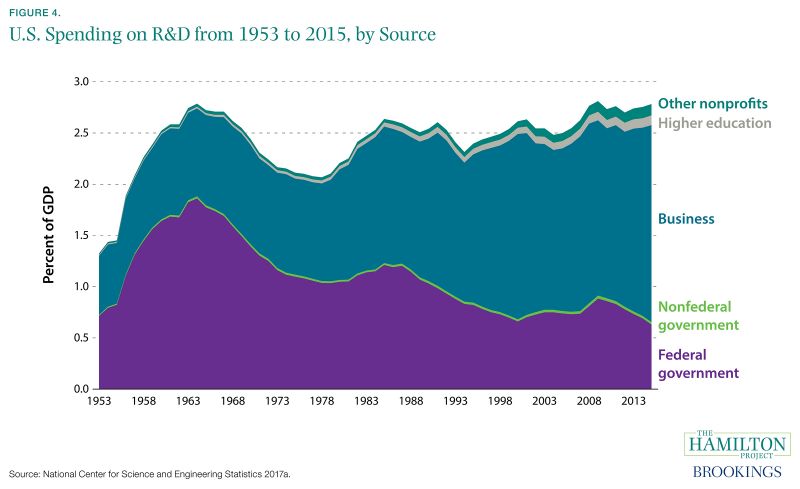
From basic research to developing and bringing a new product to market, technological progress is increasingly costly (Bloom et al. 2017). Although total R&D spending has increased as a share of GDP from 1.3 percent in 1953 to 2.8 percent in 2015, the share has increased little since the early 1980s, implying that the dollar value of R&D spending has risen along with GDP in recent decades.
The composition of R&D spending has changed, however. Federally funded R&D has not kept pace with GDP growth, while business R&D has risen. In 1953, the earliest year for which data are available, federal funding accounted for 54 percent of all R&D spending, while business contributed 44 percent. By 2015 those shares had shifted to 22 percent and 69 percent for the federal government and business, respectively.
R&D funded by universities and other nonprofits continues to make up only a small portion of the total investment. However, much innovative activity occurs in or around universities, as described in fact 10. About 55 percent of R&D expenditures occurring at universities were federally funded in 2015 (Britt 2016).
The declining federal role in R&D is surprising in light of the substantial social benefits of such investments. Typically, firms are not able to obtain all the returns from their R&D spending, some of which spill over to other firms and society more broadly (Griliches 1998). To achieve the appropriate level of R&D spending (i.e., the level commensurate with its social costs and benefits), a federal role is usually considered appropriate. Importantly, federal investments tend to increase research expenditures from other sources rather than crowding them out (Lanahan, Graddy-Reed, and Feldman 2016).
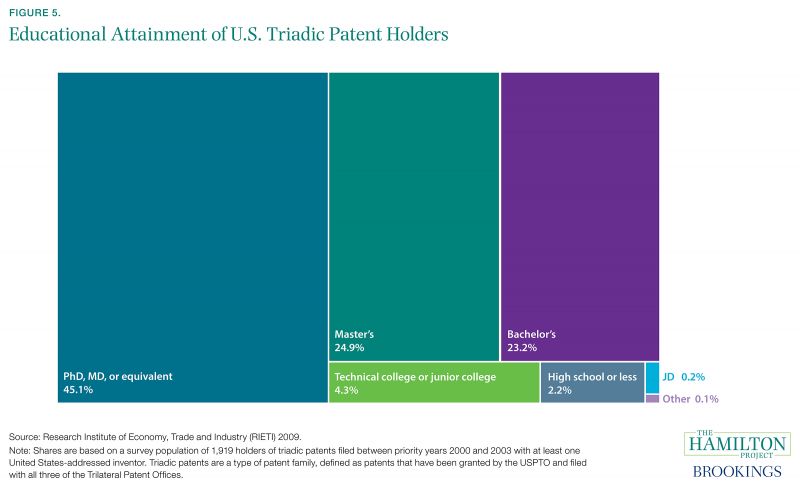
Fact 5: Nearly three quarters of high-quality patents are filed by inventors with a graduate degree.
Beyond R&D spending, a crucial input into producing patents is education. Contrary to the stereotype of the college-dropout entrepreneur, innovation—at least as measured by high-quality patent activity—is almost exclusively accomplished by people with advanced degrees. Most often, this entails some amount of education beyond an undergraduate degree: 45 percent of triadic patent holders hold a PhD, MD, or equivalent degree, and 70 percent have at least a master’s degree. Only 23 percent completed only a bachelor’s degree, and 7 percent have not completed a four-year degree.
Patent holders are substantially more educated than the rest of the population. Only 3 percent of the adult U.S. population has a professional or doctoral degree (U.S. Census Bureau 2010b; authors’ calculations), but 45 percent of patent holders hold a degree at that level. And, while more than 90 percent of patent holders have at least a bachelor’s degree, just 27 percent of the overall population does (U.S. Census Bureau 2010b; authors’ calculations). The importance of education in innovative activity highlights some of the broader spillovers to the economy from an educated workforce.
The educational attainment of innovators appears to have increased over time. One explanation for this trend is the rising “burden of knowledge,” which requires new researchers to spend more time simply reaching the frontier of study before they can begin to make contributions. As technological progress accumulates, innovation necessitates ever-greater specialization and teamwork (Jones 2009).
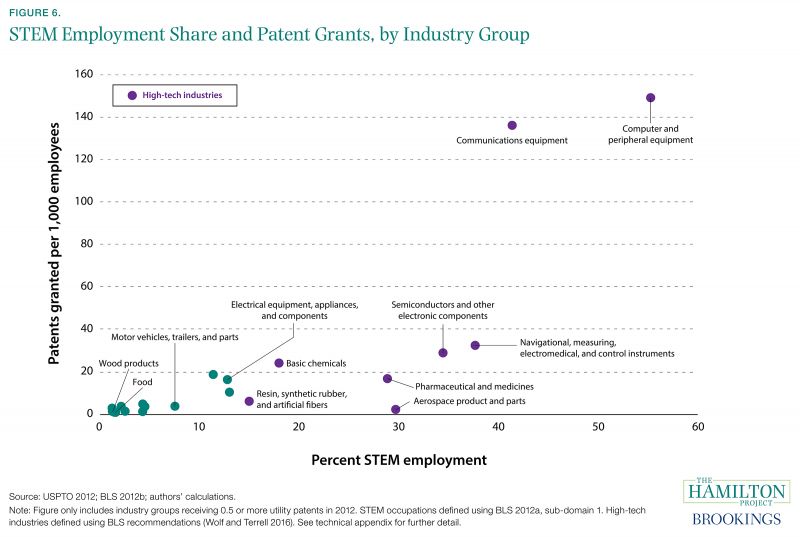
Fact 6: Industries that employ more STEM workers produce more patents.
While patents can and do come in all fields, the stereotype of a scientist or engineer generating a patent is broadly true, and industries with more STEM workers tend to patent more. STEM workers are distributed highly unevenly across industries. For example, fewer than 2 percent of employees in the food and textile industries are classified by the Bureau of Labor Statistics as STEM workers, whereas more than 40 percent of communications equipment employees are considered STEM workers.
This wide variation translates into large differences in an industry’s patents granted per 1,000 employees, which ranges from 0 to 2 for the food and textile industries to 135 for the communications equipment industry. However, it is important to note that some of this variation is associated with differences in the tendencies of industries to use patents—as opposed to trade secrets and other mechanisms—for the protection of their intellectual property (Cohen, Nelson, and Walsh 2000).
Industries with high levels of STEM employment are also patenting more and more. Computer and electronics industries increased their patent production from 1975 to 2007. In contrast, the chemicals and pharmaceuticals industries, which have a much lower share of STEM employment, saw little or no growth in patenting (Autor et al. 2016). However, some of these patterns may have been driven by changes in the rules regarding patentability of software and business methods, rather than changes in innovative activity (Bessen and Meurer 2008).
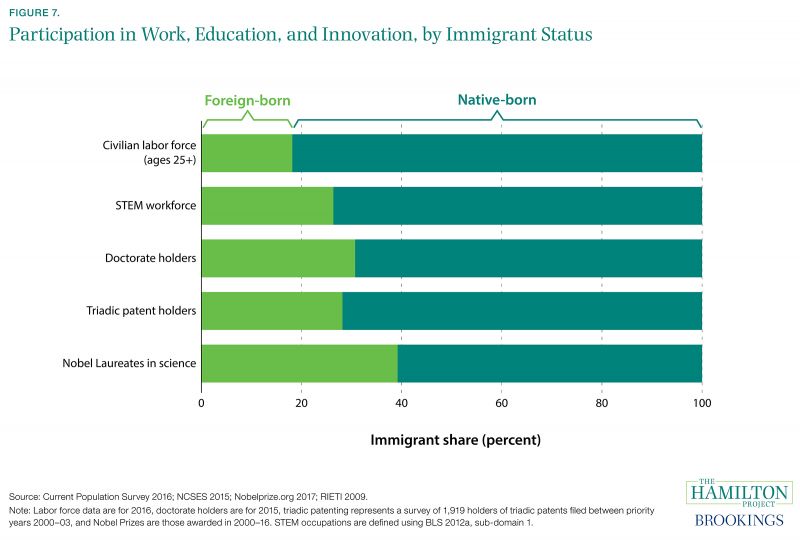
Fact 7: More than a quarter of high-quality patents are granted to immigrants.
Innovation is generally driven by talent, education, and funding. Immigration has been one of the main sources of talent for innovation in the United States, where immigrants make substantial and disproportionate contributions to research and innovation. Figure 7 shows the fraction of immigrants in the United States in the labor force, STEM workforce, PhD-holding population, high-quality patent-holding population, and among Nobel Prize recipients in the sciences. Immigrants make up only 18 percent of the U.S. 25-and-older labor force, but are 26 percent of the STEM workforce and 28 percent of high-quality patent-holders. Their high degree of patenting is not surprising given their disproportionate share of PhDs. In fact, 31 percent of PhD holders in the United States are immigrants.
In addition to boosting innovation directly, high-skilled immigrants create positive spillovers for the larger innovation system: Hunt and Gauthier-Loiselle (2010) find that a one percentage-point increase in the college-graduate immigrant population raises patents per capita by 9–18 percent when these spillovers are taken into account. Types of technology in which immigrant inventors were relatively active between 1880 and 1940 subsequently were characterized by more patenting and citations between 1940 and 2000 (Akcigit, Grigsby, and Nicholas 2017).
Innovations can spread around the world, and the U.S. economy benefits from technological advances in other countries as well, but immigration flows into the United States seem to have enhanced this country’s ability to serve as a global innovation hub.
Chapter 2: Innovation Challenges
Fact 8: R&D investments result in new technologies, but often only after many years.
The innovation pipeline requires large inputs of R&D spending and highly skilled labor. These investments might be difficult to monetize due to their substantial spillovers to the broader economy. In addition, these investments often yield benefits only many years later, which can complicate the process of organizing and financing the investments.
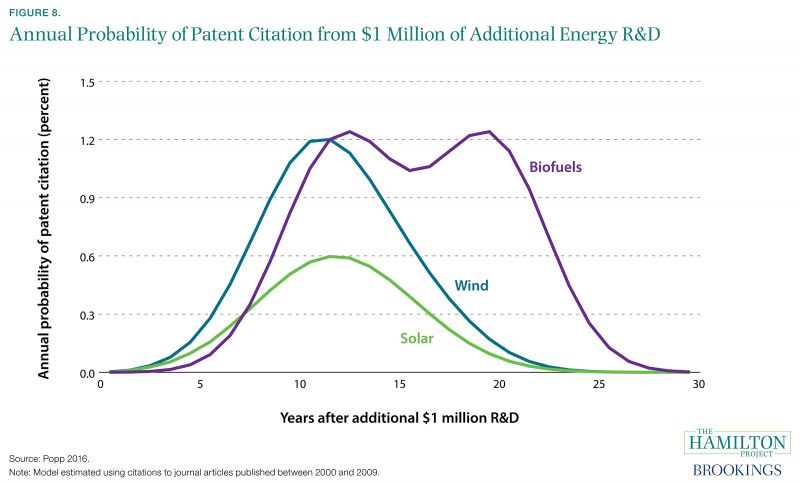
Figure 8 draws from Popp (2016) and depicts the returns over time to research investments. For an initial $1 million investment in R&D, the figure shows the probability of patent citation of a resulting publication, with results given separately for three types of renewable energy technology. The focus on patent citation, rather than on the patent’s award date, gives a better sense of the full time that elapses prior to invention of a new technology. For the purpose of this figure, a patent citation is a reference in a patent application to nonpatent literature, which is a good measure of knowledge flow from public research to later inventions (Squicciarini, Dernis, and Criscuolo 2013).
For all three types of technology, the lag time is typically substantial: the maximum probability of a citation occurs 10 to 12 years after the initial investment. These lag times between the initial research stage and the final commercialization stage can create difficulties for the U.S. innovation system. In a new Hamilton Project policy proposal, Anna Goldstein, Pierre Azoulay, Joshua Graff Zivin, and Vladimir Bulović consider how to improve the innovation pipeline for energy technology. Their proposal addresses—among other challenges—the problem of long lags between investment and technology deployment, considering reforms that would improve entrepreneurs’ capacity to bring new technologies to market.
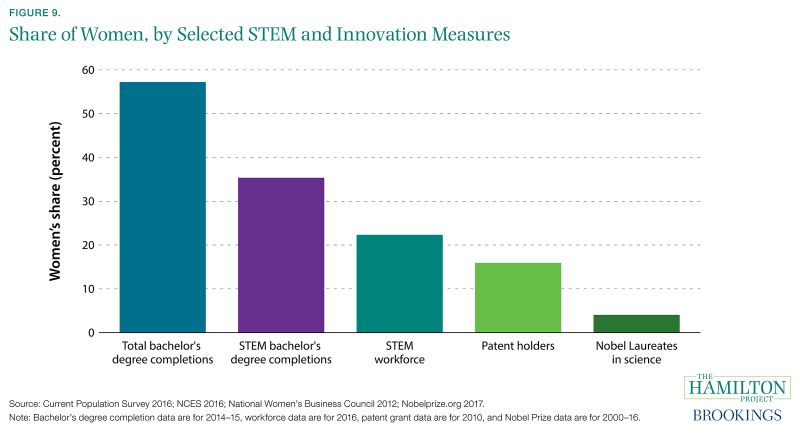
Fact 9: Women are underrepresented throughout the innovation pipeline.
As productivity growth slows and R&D becomes more difficult, inefficiencies in the innovation pipeline are perhaps more damaging than ever. Addressing these inefficiencies could yield large social benefits. One important area where the data suggest a potential for improvement is in contributions by women to STEM work.
The decline in barriers to women’s economic opportunities has led to an improved allocation of talent, raising overall economic growth (Hsieh et al. 2016). Similarly, making better use of women’s talents—as well as the talents of minorities and individuals from low-income families—in STEM employment could contribute to a better-functioning innovation system (Bell et al. 2017). Women are increasingly better educated than men, but their role in STEM and patenting lags.
Figure 9 shows the steep drop-off in women’s participation at each stage of involvement in STEM. Although 57 percent of all four-year degrees are earned by women, only 35 percent of STEM bachelor’s degrees go to women. Participation in innovation is even more limited: women make up just 22 percent of the STEM workforce and are responsible for only 16 percent of granted patents. For the most part, these progressively lower rates appear to reflect attrition from the STEM and innovation pipeline, rather than differences between younger and older cohorts of women. For example, the share of STEM bachelor’s degrees earned by women has increased only about four percentage points over the past two decades, indicating that the underrepresentation of women in STEM has been relatively stable over time (American Physical Society 2017).
Women’s underrepresentation in STEM is especially pronounced in math-intensive fields like computer science and engineering, with gender gaps emerging well before college (Card and Payne 2017; Kahn and Ginther 2017). Once in postsecondary programs, women are disproportionately likely to drop out of STEM tracks (Ellis, Fosdick, and Rasmussen 2016). After college, women with STEM degrees are more likely than their male counterparts to work in education or health care rather than in STEM fields (Beede et al. 2011). All of these disparities accumulate to a sharp underrepresentation of women in scientific exploration and patenting, possibly depriving the economy of important innovations.
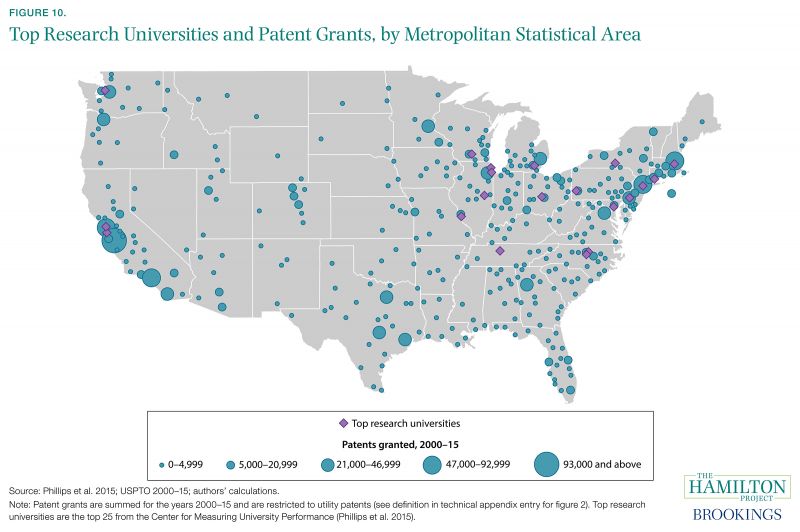
Fact 10: Patenting is highly concentrated in metropolitan areas and near research universities.
Innovative activity is not evenly distributed across the country, even after adjusting for population density (Chatterji, Glaeser, and Kerr 2014). Between 2000 and 2015, 59 percent of U.S. patents were awarded to applicants living in 20 metro areas with only 36 percent of the population (U.S. Census Bureau 2010a; USPTO 2000–15; authors’ calculations).
Figure 10 shows the number of patent grants by metropolitan statistical areas, with larger circles indicating proportionally larger numbers of patents. In addition, purple diamonds indicate the presence of a top research university. One striking feature of the map is the tendency for patents to be granted in and around top research universities. Aghion et al. (2009) find that for more technologically advanced states, a $1,000-per-person investment in four-year colleges generates an additional 0.06 patents per person. Commercial outcomes are particularly strong when universities are located inside cities (Andes 2017).
In a related pattern, the share of STEM-educated college graduates in a metro area is positively associated with higher patenting levels (Rothwell et al. 2013; Winters 2014). Research suggests this pattern is true in other countries in addition to the United States. For example, Toivanen and Väänänen (2016) found that establishing three new technical universities resulted in a 20 percent increase in the number of USPTO patents granted to Finnish inventors.
The spatial concentration of patenting has increased since the early 1990s (Kerr 2010). For productivity growth to drive living standards across the country, steps might need to be taken to ensure innovative activity is spread or can transfer across a broader array of regions.
Fact 11: Patent litigation is costly and common.
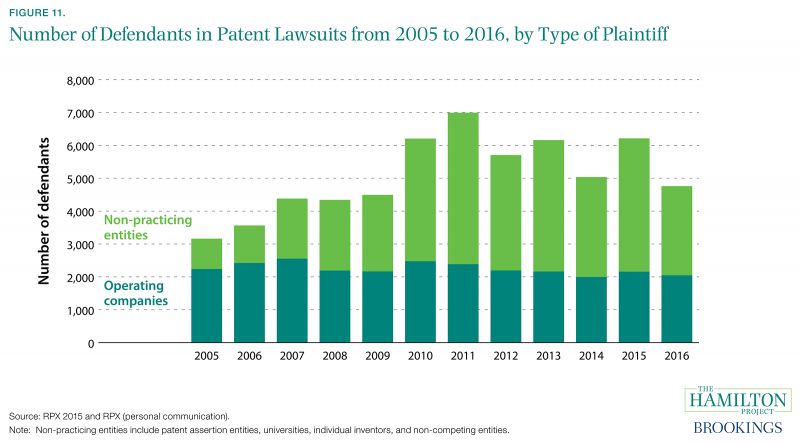
Patents are both a tool for promoting innovation and a useful metric by which to measure it. However, patents—even valid patents—also impose significant costs. One of these costs comes in the form of patent litigation, which is costly and time-consuming. By one estimate, non-practicing entity (NPE) patent litigation produced $7.4 billion in direct costs to firms in 2015 (RPX 2015).
Figure 11 shows the annual number of defendants sued in patent lawsuits—a proxy for litigation costs—broken out separately for lawsuits filed by NPEs and operating companies. NPEs are those persons or firms that accumulate patent rights but do not produce goods or services using those patents (Halt et al. 2014); some such entities have been referred to as patent trolls. Operating companies, by contrast, are firms that generate goods or services that depend on the patent rights. From 2005 through 2011, NPEs made up an increasing share of patent litigation at the same time that overall litigation was increasing. This litigation likely slowed innovation (Council of Economic Advisers 2016).
In response to growing legal costs, Congress enacted the America Invents Act of 2011 (AIA), which limited the number of defendants allowed per case. As a result, although figure 11 shows that the number of defendants sued remained relatively steady between 2010 and 2013, the number of cases filed increased by 146 percent during that time period (RPX 2015). The AIA might also have contributed to a decline in overall NPE litigation costs through the introduction of a less costly patent validity review procedure. According to the 2017 American Intellectual Property Law Association (AIPLA) Survey of Costs of Patent Litigation, the median cost of an infringement suit declined by 47 percent between 2015 and 2017 (Nayak 2017).
In addition, the 2017 Supreme Court decision TC Heartland v. Kraft Foods reduced plaintiffs’ ability to select the forum in which their lawsuits would be decided. Prior to the 2017 decision, 40 percent of all patent lawsuits in 2015 were heard by the plaintiff-friendly Eastern Texas Federal District Court; this share has subsequently declined (Fried Frank Intellectual Property 2017; Sag n.d.; authors’ calculations).