
See a 2020 update, and use the accompanying interactive feature, Undergraduate Student Loan Calculator, to calculate the share of earnings necessary to service traditional loan repayment for 80 majors.
Introduction
Student debt is becoming the norm for young adults in America. Aggregate student loan debt has more than tripled over the past decade, as both the number of borrowers and the size of the average balance have increased. Today, roughly 70 percent of American bachelor’s graduates leave school with debt. For these borrowers, the typical balance is $26,500—half owe more than this amount and half owe less.
The high incidence of student debt says nothing about whether taking out student loans to pay for college is a good idea. In a previous economic analysis Major Decisions: What Graduates Earn Over Their Lifetimes, The Hamilton Project examined earnings for approximately 80 majors and found that, throughout the entire career, median earnings for every major are higher than those for high school graduates. Differences in earnings reflect both the return to skills acquired in pursuit of a degree and the underlying capability and work ethic of individuals who pursue college education. However, experts agree that for most students, college will pay off by large margins over a lifetime.
But how easily students can repay the loans used to pay for college is another matter. While career earnings tend to grow rapidly for almost every major, student loans are typically repaid in the first decade of the career when earnings are at their lowest. Such a repayment strategy places a particularly heavy burden on graduates whose earnings start low before rising later in their careers. For these students, college likely still pays off in the end, but it may not provide the cash flow needed to easily pay off loans in the years immediately following graduation.
In this second economic analysis in the Major Decisions series, The Hamilton Project turns to the question of loan repayment. The analysis explores the relationship between earnings growth over one’s career and the relative burden of debt repayment across 80 majors. Specifically, we examine the share of monthly earnings needed to make monthly loan repayments for each major under the traditional 10-year repayment plan. Accompanying the analysis is a new interactive feature that combines a debt repayment calculator with major-specific earnings trajectories, allowing the user to see what share of earnings will go to debt repayment for each year of the repayment period.
The earnings data by major come from the U.S. Census Bureau’s American Community Surveys. For more detail on their construction, see the technical appendix from the previous Major Decisions economic analysis. Data on student debt of bachelor’s graduates come from the U.S Department of Education’s National Postsecondary Student Aid Study; we use the 2012 wave, the most recent available.
The analysis yields the following key conclusions:
First, earnings trajectories differ across majors but nearly all of them show rapid growth in the early-career years.
- Graduates see steep earnings growth in the first five years after earning a degree: the typical increase in median earnings over this period is 65 percent. This implies that a focus on earnings right out of school—either as an indicator of earnings potential or loan repayment ability—can be misleading.
- Graduates from majors with lower initial earnings are more likely to see faster earnings growth in early-career years. In the first five years after degree receipt, graduates in some of these majors show increases of over 100 percent while graduates from other majors see gains of no more than 30 percent.
Second, the burden of student loan repayment diminishes rapidly as earnings grow, but it can still be difficult for the graduates of some majors under typical repayment strategies and loan levels.
- For a bachelor’s graduate who borrowed, and who had typical earnings and student debt, payments under the standard 10-year repayment plan take up 14.1 percent of earnings in the first year, but only 6.5 percent of earnings in the tenth year.
- Among borrowing graduates with typical earnings and debt levels, eight in ten will pay more than 10 percent of their earnings in the first year of repayment. However, fewer than one in eight will pay such a share of earnings in the fifth year, and none will by the tenth year.
- However, the share of earnings necessary for loan repayment varies substantially across majors. With typical earnings and student debt, borrowing graduates in drama and theater face payments of 24 percent of their earnings during the first year of repayment, with this fraction gradually falling to 10 percent during the tenth year. Graduates from energy and extraction engineering, on the other hand, experience repayment shares of only 7 percent and 4 percent, respectively, over the same horizon.
- Because student loan debt is fairly similar across majors, the spread in earnings repayment shares over the majors is mostly driven by differences in earnings trajectories.
- This mismatch between the timing of repayment of student loans in early career and higher earnings in mid-career can be mitigated in part through income-based repayment plans. For borrowers with debt of $26,500—the typical or median amount—99 percent of graduates would qualify for the most generous income-based repayment plan in the first year of the career, 82 percent would in the fifth year, and 54 percent would in the tenth year.
It is important to note that the earnings presented here are not limited to full-time workers and include both part-time workers and those who experience unemployment throughout the year. As The Hamilton Project and others have noted, the risks of unemployment and underemployment are higher for those with less education, and they also differ by college major among bachelor’s degree holders. Indeed, these risks are a primary source of repayment difficulty. The interactive feature, however, does allow users to choose whether they want to view earnings and repayment among all workers or only among those working full-time and year-round.
Furthermore, as the focus of the analysis is on earnings growth and debt repayment in the early-career years, the earnings presented here are based on individuals who complete a bachelor’s degree in a particular major and do not go on to earn an advanced or professional degree. Individuals from certain majors are more likely to pursue additional degrees that may raise earnings as well as student debt; this is not something that we attempt to account for in this analysis.
Our goal in providing this analysis and interactive feature is to highlight earnings and student debt information that can help consumers—students and their families—make the best decisions regarding their higher-education investments. We hope the analysis and interactive feature will be a springboard for discussion regarding educational investments, financial aid and loans, and career choices.
Earnings Growth by Major in the Initial Years Following Graduation
The higher earnings that come with a college degree do not always occur immediately after graduation [1]. While lifetime earnings are higher for the more educated, early-career earnings can be relatively low, especially for a select group of majors. For all majors put together, median initial earnings—the point where half of graduates earn more and half earn less—start around $27,000. For a number of majors, median earnings begin at less than $20,000. However, earnings typically grow rapidly in the first five years following graduation: across all majors, earnings growth is 65 percent within five years. Much of this rapid growth is a result of graduates achieving full-time employment and switching jobs as they look for a better employment match [2].
Moreover, just as initial earnings vary across majors, so do five-year earnings growth rates. Figure 1 plots for each major initial earnings (on the horizontal axis) against the percentage growth in earnings over the first five years of the career (vertical axis) [3]. Median initial earnings range from under $20,000 for a few humanities and arts fields to over $50,000 for some engineering fields. Five-year growth rates are over 50 percent for most majors, but range from under 20 percent for a few education-related majors to over 100 percent for majors such as production and transportation, nutrition and sports, and fine arts. Only a handful of majors have five-year growth rates under 25 percent.
Figure 1.
Graduates of majors with initially low earnings experience faster earnings growth during the early-career years.
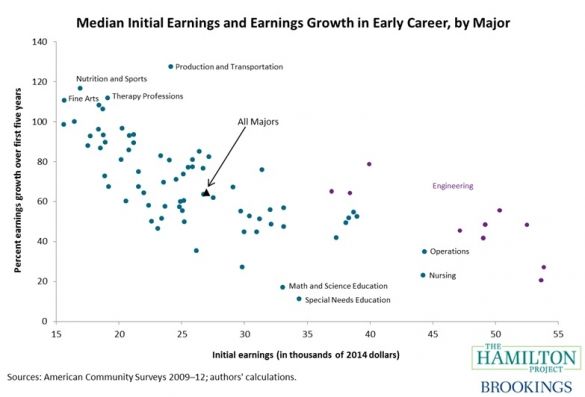
A remarkable pattern emerges when comparing initial earnings to the growth rate over the first five years: initially-low-earning majors tend to see the fastest earnings growth in early-career years, while initially-high-earnings majors tend to see the slowest earnings growth. (This negative correlation is evident in the downward-sloping shape of the dots in figure 1.) Typical graduates in majors like fine arts, nutrition, and speech therapy start off with earnings under $20,000, but experience earnings increases of approximately 100 percent (translating into gains of $15,000 to $20,000) over the first five years of the career. Engineering graduates, on the other hand, experience some of the slowest earnings growth, although because their initial earnings are quite high, they still see gains of around $20,000 during the early-career years. The upshot is that earnings grow quickly for graduates of almost every major and especially so for those who start with the lowest earnings.
Paying for a Degree: Loan Repayment Following Graduation
Our country invests an enormous amount in higher education. In recent years, the total annual cost of educating America’s college students totaled nearly $500 billion. Fortunately, the cost of acquiring higher education is heavily subsidized and does not fall entirely on students (or their families) themselves. State legislatures send billions of dollars annually to public colleges and university systems, Pell Grants issued by the Department of Education offset the cost of schooling for disadvantaged students, federal tax breaks—such as higher education tax credits and deductions for tuition—further reduce the after-tax cost of attending college, and school endowments and the institutional grants they provide often result in a large difference between the total cost of education and what students and their families actually have to pay.
Despite these subsidies, students and their families often must borrow to finance a college education. Most students today take out loans through the federal government and elect a standard 10-year repayment plan (see text box). This plan spreads the cost of repaying the loan in equal parts across the decade following a student’s exit from school. Other types of loans (notably from private lenders) can feature variable interest rates, and some students have more than one type of loan.
According to the Department of Education’s National Postsecondary Student Aid Study (NPSAS), 69 percent of bachelor’s graduates from the class of 2012 left school with student debt, and for these borrowers the median balance was $26,500. In the figures below, we show the share of earnings that such typical graduates could expect to allocate toward paying off their student loans. In the interest of simplicity and transparency, these loan repayment calculations make several simplifying assumptions relative to what students actually experience when repaying loans. In particular, we assume repayment under a traditional 10-year plan (unless mentioned otherwise), a 4.66 percent interest rate on the entire balance (the prevailing rate for federal loans issued during the current school year), that interest begins to accrue at graduation, and that payments also begin at graduation [4].
Figure 2 shows the share of earnings a graduate with median debt would need to allocate for debt repayment under these assumptions. For a graduate with median earnings, 14.1 percent of first-year earnings are needed to make the required payments. But, because of early-career earnings growth and fixed payments that don’t change over time, only 8.1 percent of earnings are necessary in the fifth year, and only 6.5 percent in the tenth and final year of repayment.
Graduates with earnings at the 75th percentile never owe more than 9 percent of their earnings to repayment; for the final three years of a 10-year loan, they owe less than 5 percent of their earnings. A less rosy picture emerges for a graduate with earnings at the 25th percentile. For this student, over 30 percent of first-year earnings are needed for repayment, with this share dipping below 10 percent only in the tenth year. These numbers reveal that for the typical college graduate who borrowed, the burden of loan repayment quickly becomes manageable. However, for those with lower earnings, even the typical debt level can present a heavy load under the traditional 10-year repayment plan.
Figure 2.
The share of earnings needed for repayment starts high and falls quickly as earnings grow.

Loan Repayment Across Majors
Unlike earnings, student debt at graduation does not tend to vary much by major. For example, of the 17 majors listed in the NPSAS, the median debt at graduation for those carrying a student loan ranged from a low of $21,000 (General Studies) to a high of $31,500 (Computer Sciences and Information). For 13 of the 17 majors, typical debt was between $24,000 and $27,000. The share of graduates carrying any debt at all did not vary much by major either, with almost all majors listed graduating between 65 percent and 80 percent of their students with debt.
The combination of similar debt payments across majors and varying earnings in the initial years, as shown above, means that the debt burden as a share of earnings will vary substantially across majors. Within most majors, the debt burden will be high in the first few years following graduation, but will ease over time. Among graduates with typical earnings and typical debt levels, those from 66 out of 81 majors will owe more than 10 percent of first-year earnings to debt repayment. However, this count falls relatively quickly, and by the third year, only 42 majors pay more than 10 percent of their income to repayment, and by the sixth year, only 7 majors do.
Figures 3 and 4 show the share of earnings needed for loan repayment in the first and sixth years of the career for each major, using the same assumptions as those in figure 2 (typical debt of $26,500), but with median earnings specific to each major.
Figure 3.
The share of earnings needed for repayment across majors ranges from 6 percent to 26 percent.
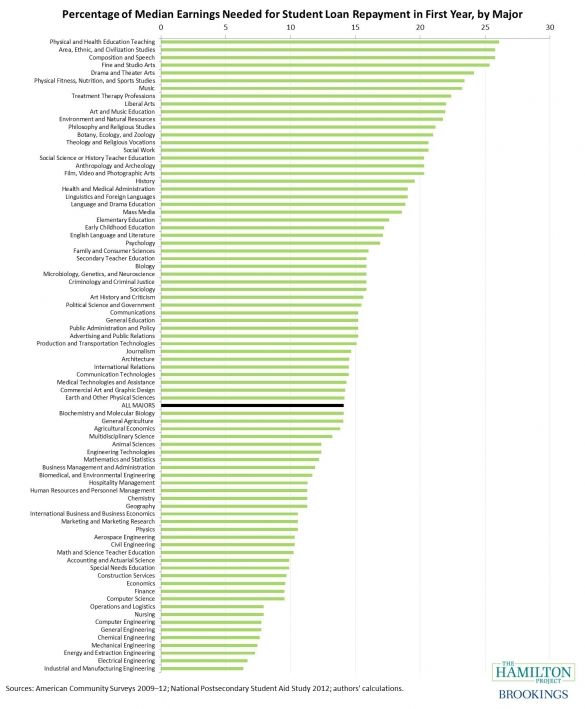
Figure 4.
The share of earnings needed for repayment across majors now ranges from 4 percent to 11 percent.
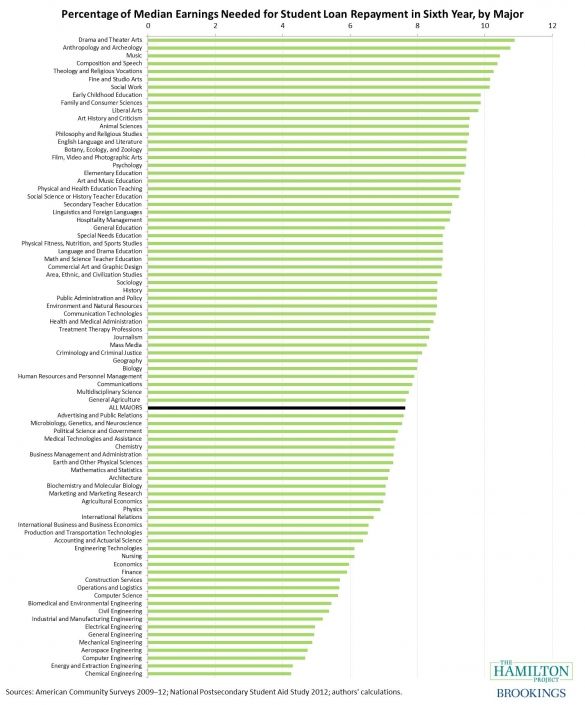
In the first year of the career, when earnings are at their lowest, graduates from several majors in the arts and humanities would need more than 20 percent of their earnings to service their loans. Even graduates from majors that have fairly high earnings potential, such as business, mathematics, and earth science, need at least 12 percent of their first-year earnings to pay back their loans. But, five years later, as a consequence of the earnings growth shown in figure 1, these repayment-to-earnings shares are much smaller, and most of them—even for low-paying majors—have fallen below the 10-percent threshold. Even the major with the greatest relative burden—drama and theater arts, at 10.9 percent—has a lower repayment share in the sixth year than do three-quarters of the majors in the first year.
The Timing Mismatch Between Earnings and Debt Payments
For the graduate with typical debt and earnings, the total sum of loan repayments relative to total earnings over the first decade of the career is a small fraction, about 8 percent. However, a key problem with the current college financing system is that debt payments are often fixed, while for many majors, earnings are low in the initial years following graduation. This mismatch can lead to a substantial financial burden on young workers, even resulting in loan default in some cases. Indeed, the rate at which borrowers are 90 or more days behind on their student loan payments has slowly risen in recent years, and now sits at around 17 percent.
Some financial aid experts recommend repayment guidelines of no more than 20 percent of disposable income, where disposable income is defined as income beyond 150 percent of the poverty line for a single person living alone. (That is, since 150 percent of the poverty line for a single person is about $17,200, loan repayments should not take up more than 20 percent of additional income beyond this amount.) The motivation for these guidelines is that when debt payments rise above this threshold, the risk of default tends to increase quickly. Under this measure, the median borrower in most majors would exceed the guidelines in the initial years following graduation. Assuming typical earnings profiles, the graduates of 68 majors owe more than 20 percent of disposable income in the first year, those from 45 majors do so in the third year, and those from 17 do so in the fifth year.
However, within the past few years (and in some cases, past few months) borrowers of federal loans have gained additional options for repayment, particularly with regard to income-based repayment plans. Under these plans, rather than making fixed monthly payments over a specific horizon, the borrower’s payments are determined as a function of current income. Recent borrowers are now eligible for the most generous of these plans, known as Pay As You Earn or PAYE, if loan repayment under the standard 10-year plan would consume more than 10 percent of disposable income (as defined above), in which case loan repayment is capped at this fraction of disposable income. Under this threshold, and again assuming typical earnings profiles, the median borrower would be eligible for PAYE in 80 of 81 majors in the first year of the career. Because this threshold is relatively low, graduates from 61 majors would still be eligible in the sixth year, and graduates from 46 majors would be in the tenth year. Indeed, even after 20 years into the career, graduates from 30 majors would still qualify for PAYE under these assumptions [5]. Since one of the provisions of PAYE is that any remaining loan balance is forgiven after 20 years, this means that typical graduates from 30 majors—with median earnings for their major and median debt of $26,500—could qualify for loan forgiveness.
In a recent THP discussion paper, Susan Dynarski and Daniel Kreisman proposed to replace the current student-loan system with a simplified income-based repayment system. Under their proposed system, called Loans for Educational Opportunity, payments are made through payroll deduction, with employers withholding a fixed percentage—based on wages—from individuals’ paychecks. Payments would range from 3 percent to 10 percent of earnings, and would be spread out beyond the low-earning early years so that young workers are not hit with large payments when they can least afford them. Instead of paying off loans during a fixed, 10-year period, borrowers will have up to twenty-five years to repay, although most borrowers will repay in about ten years, as is the case under the traditional system.
An important characteristic of income-based repayment plans is that, relative to the standard 10-year repayment plan, they offer the option of deferring some of the payment to later years. As noted above, this allows the repayment amount to more closely align with earnings patterns, mitigating the risk of negative social and financial outcomes like delinquency and default. In addition, income-based repayment represents an option to defer: borrowers can pre-pay their loan balances or continue paying along the 10-year fixed path if it suits them. While income-based repayment can result in more total interest paid over the course of the loan, borrowers gain the benefit of being able to choose to spread out payments as a means to avoid financial hardship.
Conclusion
As borrowing for higher education becomes increasingly common, it is important that college students have a good understanding of how they will repay their loans. With young workers typically experiencing low earnings immediately after graduation, more than half of graduates will spend at least 10 percent of their earnings repaying loans in the first two years after graduation. Yet, because of rapid earnings growth early in the career, the number of graduates paying this share of earnings to service their loans plummets over the next five years.
The traditional structure of loan repayment represents a fundamental mismatch with graduates’ early-career earnings patterns. Fortunately, there are now alternative repayment plans, including several that are based on graduates’ incomes. Such plans may be preferable for graduates with low initial earnings. These plans can potentially ease the burden of debt payments by deferring payments later into a worker’s career when earnings are higher.
The purpose in presenting these earnings and repayment estimates is to provide students, parents, policymakers, and researchers with information for which there is great interest and—until now—little availability. More transparent information about career earnings by major and the reality of loan repayment burdens will allow everyone to make more-informed decisions about borrowing for higher education. Nevertheless, this analysis must not be misinterpreted as individually tailored information. We focus here on the situation for typical students; borrowing patterns can vary greatly across schools and individuals, and a given student’s borrowing experience may be quite different than that of the median student used in this analysis.
The interactive loan repayment calculator allows further exploration of student loan repayment (under the traditional 10-year plan) by major. Although information is not individually tailored, the user can specify different borrowing amounts and terms as well as different earnings trajectories.
We emphasize that there are some nuanced—but important—issues to consider when interpreting earnings differences across majors. First, earnings differences across majors are driven by many factors and do not necessarily reflect a wage premium for particular majors. The estimates cannot distinguish why graduates in certain majors earn more than those in others. For example, perhaps individuals who select into particularly difficult majors have skills that they would bring to the workforce even if they had chosen another major. Second, future earnings are not the only factor in choosing a major: personal enjoyment, engaging in meaningful work, and filling a social need should all also enter into a student’s decision-making process.
The U.S. Department of Education documents how recent bachelor’s graduates switch jobs, and the Federal Reserve Bank of New York examines how they look for a better match. Despite these frequent job changes, there is significant media attention on earnings immediately after graduation. For a table comparing the share of recent graduates by major who find full-time year-round employment, see Appendix C of this Lumina Foundation report.
Technically, the growth rates are calculated using the average of the first two years of career earnings as the base, rather than just the first year, to account for graduates who may not have had a full 12 months to work after finishing their degree in the first year of the career.
In reality, students generally have multiple loans with different interest rates, some of these loans have interest accruing before graduation, and payments generally begin several months after graduation. These differences do not qualitatively affect the outcomes of our analysis.
In cases where payments relative to discretionary income might fall below 10 percent before rising again past this threshold, we count the last year in which the share is above 10 percent. We also assume discretionary income is based on a single person; for other family structures, eligibility for PAYE may be higher or lower depending on total family income.