Over the last few decades, economic inequality has increased, with strong growth at the top of the income distribution but slow growth in the middle and at the bottom. In recent years mortality rates among middle-aged Americans also have grown more unequal by income level, as shown in recent studies and discussed in a June 2016 Hamilton Project framing paper. Changes in health, determined by the interplay of economic, behavioral, and technological factors, have been the subject of considerable speculation.
In this economic analysis, we analyze the relationship between age, income, and measures of health status, as well as how these relationships have changed between the late 1970s and today. While overall there have been remarkable gains in life expectancy in the United States over the past half-century, these have not been reflected in other measures of health which have declined over time. For example, the fraction of Americans who describe themselves as being in “very good health” or better has fallen and rates of obesity have risen, with the largest changes occurring among those with middle incomes. Furthermore, stress load—an index constructed using laboratory measurements of health biomarkers that are associated with long-term physiological strain—has risen over time for individuals of all income levels.
Health declines have been smaller for high-income individuals, resulting in an increasing gap in health between the lowest- and highest-income individuals. In addition, we find that by several measures health is deteriorating for the young relative to the old.1 Describing these developments is critical to understanding how Americans’ health has evolved over recent decades and what interventions are most likely to be successful in achieving health improvements.
Self-reported health and obesity
We analyze health measures collected in the National Health and Nutrition Examination Survey (NHANES), a survey conducted by the Centers for Disease Control and Prevention that is unique among nationally representative surveys for collecting demographic, socioeconomic, and health-related information as well as laboratory-based measures of health. NHANES data have been collected since the 1970s, allowing for comparisons of health over time.2 To analyze change over time in self-reported health, obesity, and stress load, we compare NHANES data from 1976-80 and 2009-14.
As shown by the light green line in Figure 1, health tends to decline with age. In 2009-2014, over half of 25-29 year olds reported being in excellent or very good health, compared with only 44 percent of 40-44 year olds. A similar downward-sloping trend is observed in the data from 1976-80.
In order to provide a clear picture of changes in health over time, our calculations account for how the demographic composition of the population has changed over the same time period. For example, it is well known that the average age of the population has increased from the late 1970s to today, driven in large part by the aging of the baby boom generation. Failure to account for changes in the age distribution would produce a misleading picture, likely understating any health gains that were made over time.3
As shown in the dark green bars in Figure 1, even within narrow age groups the shares of younger Americans reporting excellent or very good health declined by over 10 percentage points between the 1970s and today. In contrast, the share of those age 50-74 reporting being in very good health or better has increased since the 1970s. For example, the share of those between the ages of 65 and 69 reporting their health as “excellent” or “very good” increased from 35 percent in the 1970s to 46 percent today, after adjusting for demographic changes.4
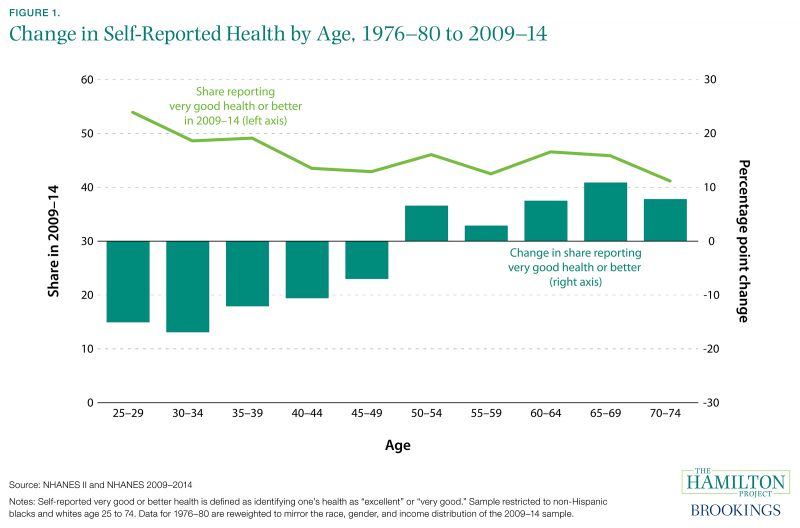
In the figures that follow, we focus on the relationship between income and health. Differential aging across income groups would be particularly misleading in this context. Notably, the middle and high income groups became considerably older since 1976-80—for example, those in the high income group in 1976-80 were 43.5 years old on average, while the same income group in 2009-14 averaged 48.6 years old. Over the same time period, the low income group became younger, with average age dropping from 50.3 to 48.2 years. As discussed previously, we therefore adjust for changes in the age distribution—as well as race, income, and gender—that occurred over the decades, so that the graphs demonstrate how health has changed over time given today’s demographics.
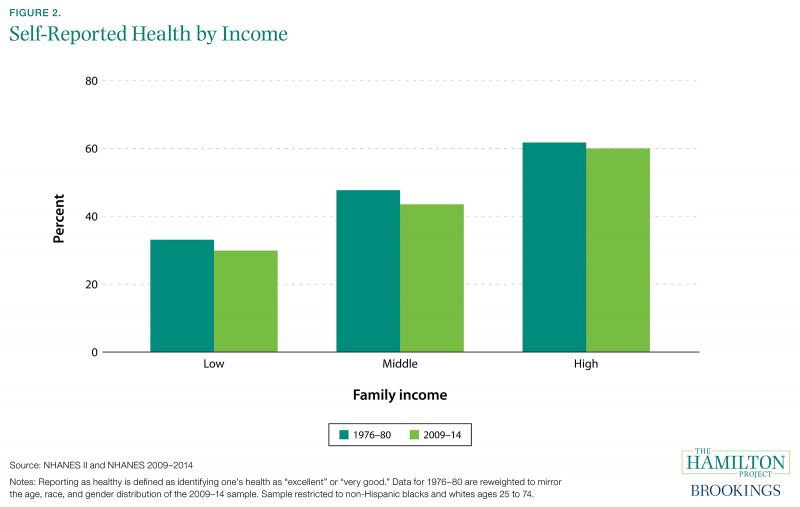
Figure 2 shows how the likelihood that an individual reports being in very good or excellent health is related to family income. We group individuals by whether their family income falls in the top, middle, or bottom third of the income distribution in the set of years covered by the survey. Those with high family incomes are more likely to report being in very good health, and an individual in the top third of family income is now twice as likely as someone in the bottom third of family income to report being in very good or excellent health. Note that across all family income groups the share reporting very good or excellent health has declined over time, although for high-income individuals the decline is small and not statistically significant.
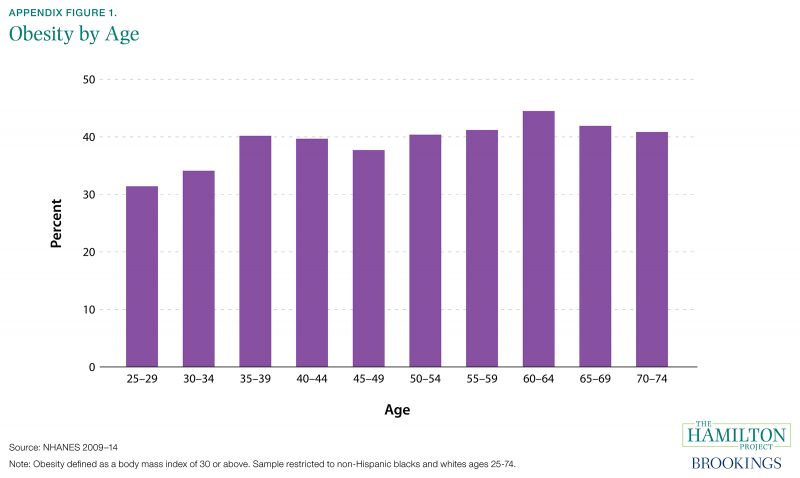
Another key health measure is obesity. Obesity is associated with many causes of preventable death, such as heart disease, stroke, and diabetes, and has a significant negative relationship with self-reported very good health in the NHANES data. In the past 40 years, rates of obesity have increased for all demographic groups, though not uniformly. The increase is widely documented; more than one-third of all US adults are now obese. The fraction of individuals who are obese increases with age: just over 30 percent of 25-29 year olds are obese, compared with just over 40 percent among those over age 50, as shown in Appendix Figure 1.
Figure 3 shows the relationship between obesity and income. Those with higher incomes are less likely to be obese, though it is striking that high-income individuals are now approximately 50 percent more likely to be obese than low-income individuals were in the late 1970s. As shown in the dark green bars, in the late 1970s there was a particularly strong relationship between income and obesity. Today, the relationship is weaker, with obesity rates among the middle-income group nearly the same as for the low-income group.5
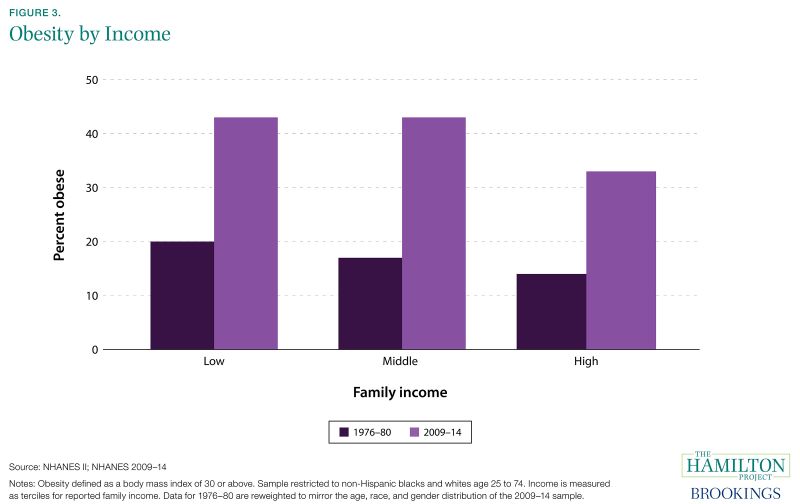
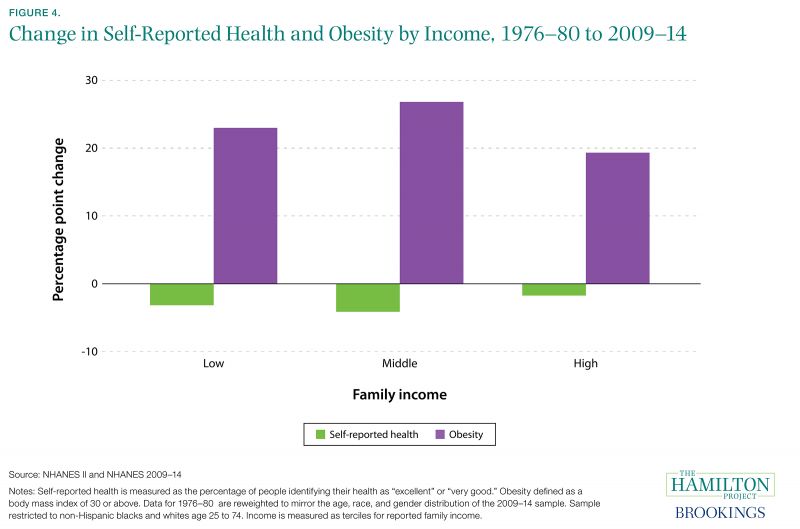
Figure 4 shows how these health outcomes have changed across income groups between the 1970s and today. For both self-reported very good health and obesity, health has deteriorated among people of all income levels, and in both cases the deterioration has been more muted for high-income individuals than for those in the middle or bottom of the income distribution.
Stress load and income
Another way to document changes in health over time is to use measured levels of biomarkers—biological measures like blood pressure—that are associated with long-term stress on the body, or stress load. Stress load is a summary measure of biomarkers that quantify the wear and tear on the body that accumulates in response to stressors. Our analysis incorporates biomarkers commonly used to calculate stress load that are available in NHANES data: diastolic and systolic blood pressure, triglycerides, and cholesterol (cardiovascular risk), creatinine (kidney function), and albumin (liver function). These biomarkers are predictive of poor self-reported health, and are negatively associated with subjective well-being, or happiness, as shown in the linked chart.
To construct a single index of stress load, we first standardize measures of the five biomarkers, then combine them using a weighted average, where the components are weighted in relation to their association with fair or poor self-reported health status.6 Importantly, this allows us to distinguish between biomarkers that are more or less predictive of bad health. A higher level of the stress load index indicates a larger accumulation of damage from stressors, which has been shown to predict mortality and illness.
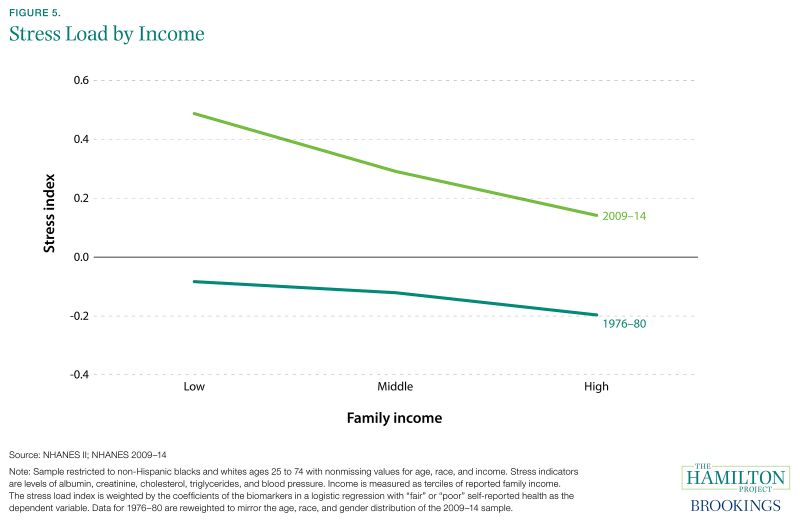
The level of stress load and its relationship with income have both changed over time. Figure 5 shows that those with higher incomes have lower stress loads, regardless of time period. However, income is more closely related to stress in 2009-14 than it was in 1976-80. In other words, after adjusting for demographic change, those with lower incomes experienced a bigger increase in stress over time than did those with higher incomes.
Discussion
Health disparities by income have a variety of possible explanations. Availability and quality of health care are well-documented factors that can improve health and decrease stress levels on the body. Income predicts differential exposure to external stressors themselves, both in the form of environmental hazards and financial and psychosocial demands. Chronic stressors such as food insecurity, substandard housing, and greater exposure to violence have also been demonstrated to increase the wear and tear on biological systems.
Consequently, policies aimed at mitigating these problems for low-income families can help to improve health and reduce stress load. These policies can take the form of direct assistance to low-income families—for example, in the form of nutrition assistance—or assistance in relocation to neighborhoods that lead to better outcomes for low-income families. Policies that raise economic growth and maintain a strong labor market will benefit all Americans. Efforts to improve both health and economic outcomes are an important part of The Hamilton Project’s goal of enabling broader participation in economic progress. This analysis serves as a reminder that income matters not only for individuals’ finances, but also for their chances at healthy lives.
Thank you to Patricia Anderson, Dalton Conley, David Cutler, David Figlio, Bhaskar Mazumder, Kerry Anne McGeary, Thomas McDade, Peter Orszag, and Louise Sheiner for helpful comments and to Rose Burnam and Greg Nantz for excellent research assistance.
1 Interestingly, inequality in mortality rates has fallen for children.
2 Consistent mental health variables are not available across the time period we study.
3 Specifically, we compare health outcomes within 5-year age, race, and sex bins, and calculate average health outcomes based on the 2009-14 distribution of the population. Note that because there were relatively few Hispanics in the 1976-80 NHANES, we exclude Hispanics from the analysis. The relationship between income and health in the 2009-14 sample does not change appreciably if Hispanics are added back to the sample.
4 Self-reported health is a subjective measure of health that strongly predicts mortality. Changes in self-reported health, however, may not reflect changes in other measures of health. For example, changes in norms or population health may influence responses. Below we show additional health metrics from laboratory-based measures.
5 Interestingly, changes in obesity do not appear to explain trends in self-reported health and stress load. When adjustment was made for obesity in the same way as for age, race, and gender, trends were qualitatively similar (not shown).
6 Specifically, we use the pooled 1976-1980 and 2009-14 sample to estimate a logit model with the standardized biomarkers as independent variables and self-reported health as the dependent variable, where “fair” and “poor” health are coded as one and other responses are coded as zero. Predicted values from that specification are then standardized to generate the stress load index. Where some biomarker values are missing, we impute these values conditional on age, income, race, and gender.