Data
THP visualizes economic issues through figures and data interactives.
Interactive
Tracking trade amid uncertain and changing tariff policies
Monitor the effects of tariff policies on trade with this interactive tracker showing total merchandise, duties, and price inflation by industry and country.
Interactive
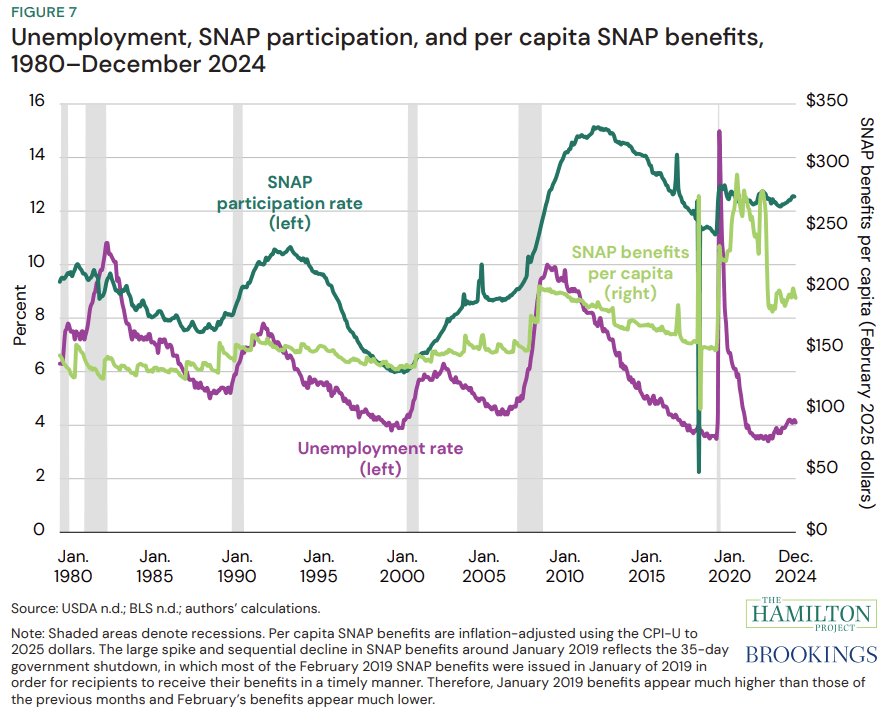
Tracking federal outlays to the Supplemental Nutrition Assistance Program (SNAP)
The figures on this page visualize federal outlays to SNAP for November 2025, with comparisons to prior months and prior years.
Interactive
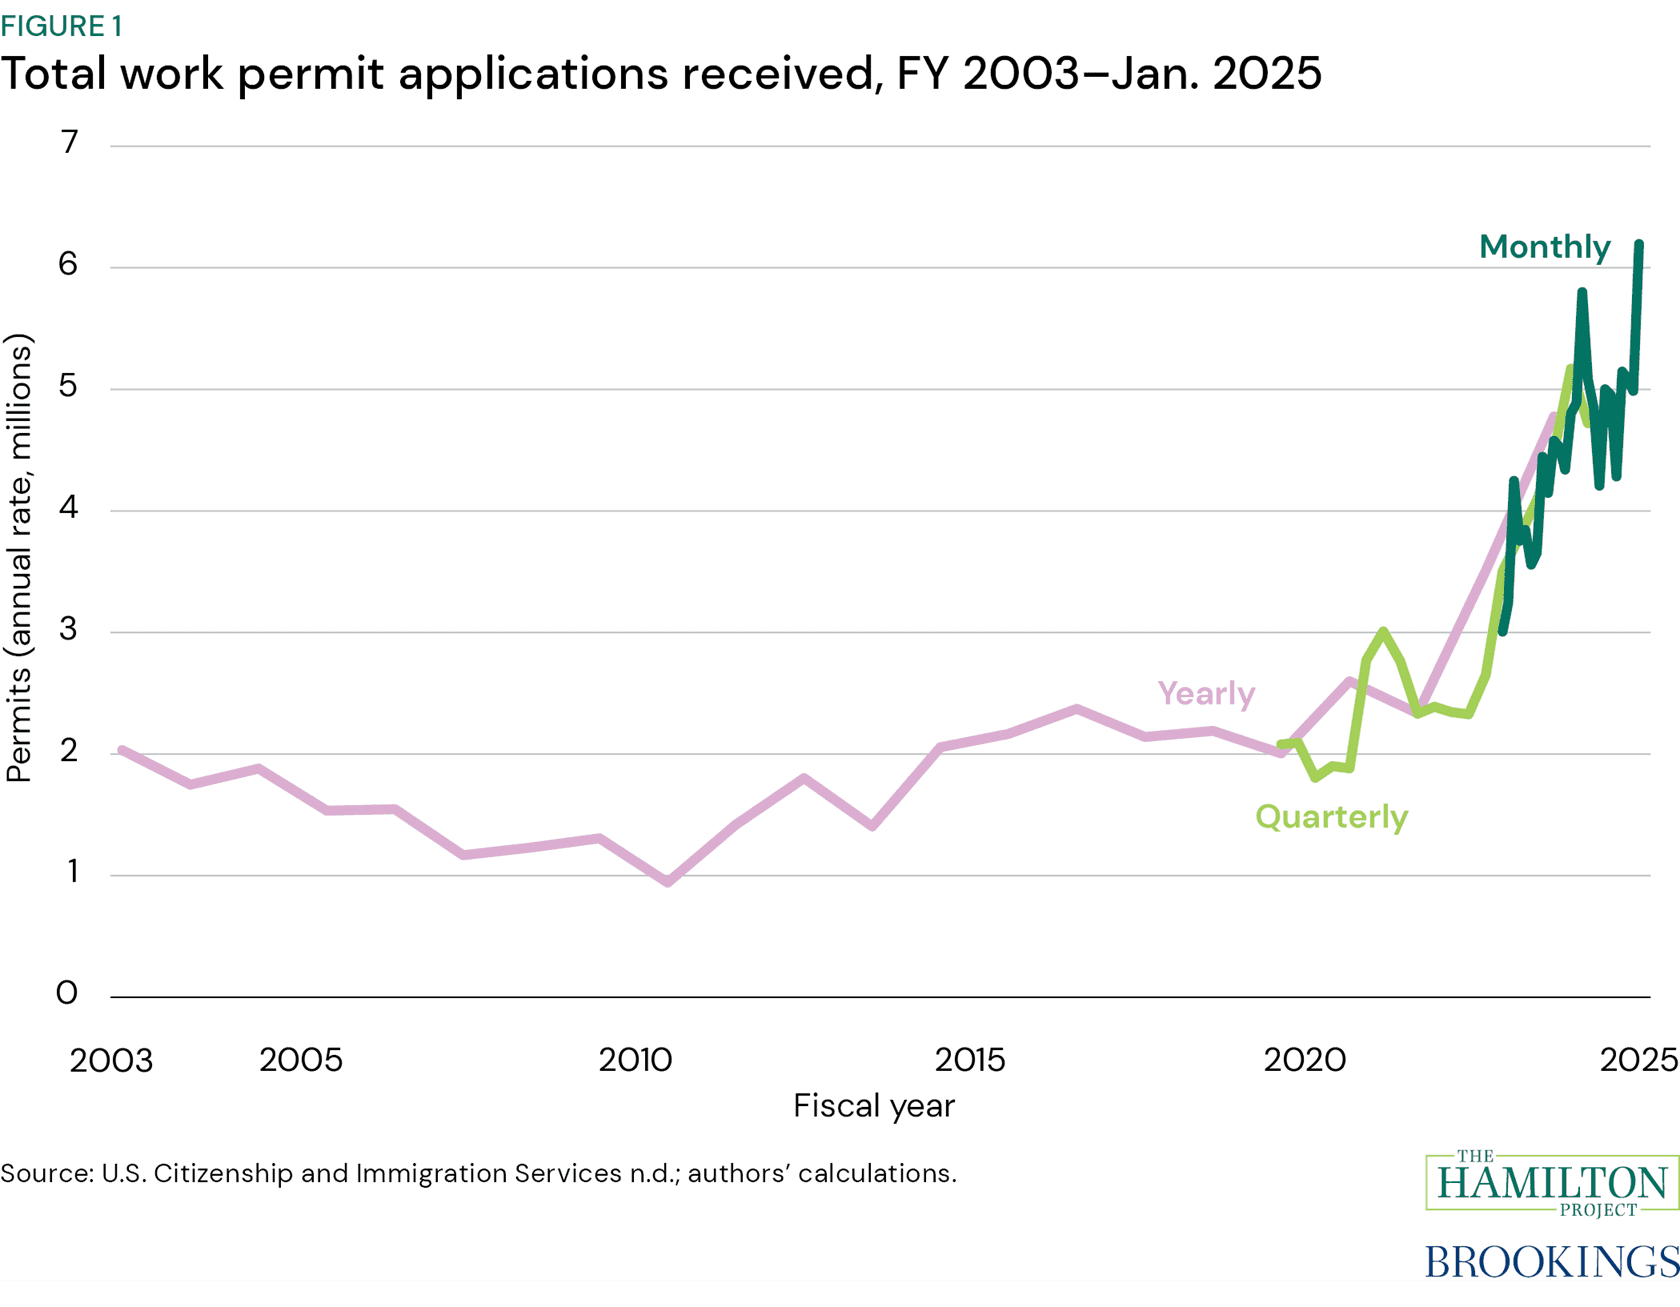
Tracking work permit applications among eligible immigrants
Tracking work permit applications can illuminate how changes in the pace of immigration are affecting labor supply.
Interactive
Tracking federal expenditures in real time
Track federal expenditures and filter by department, program, and more. Data are updated daily.
Featured Figures
Explore data from our publications

