"Taking on tax: Toward progressive revenue-raising business tax reform"
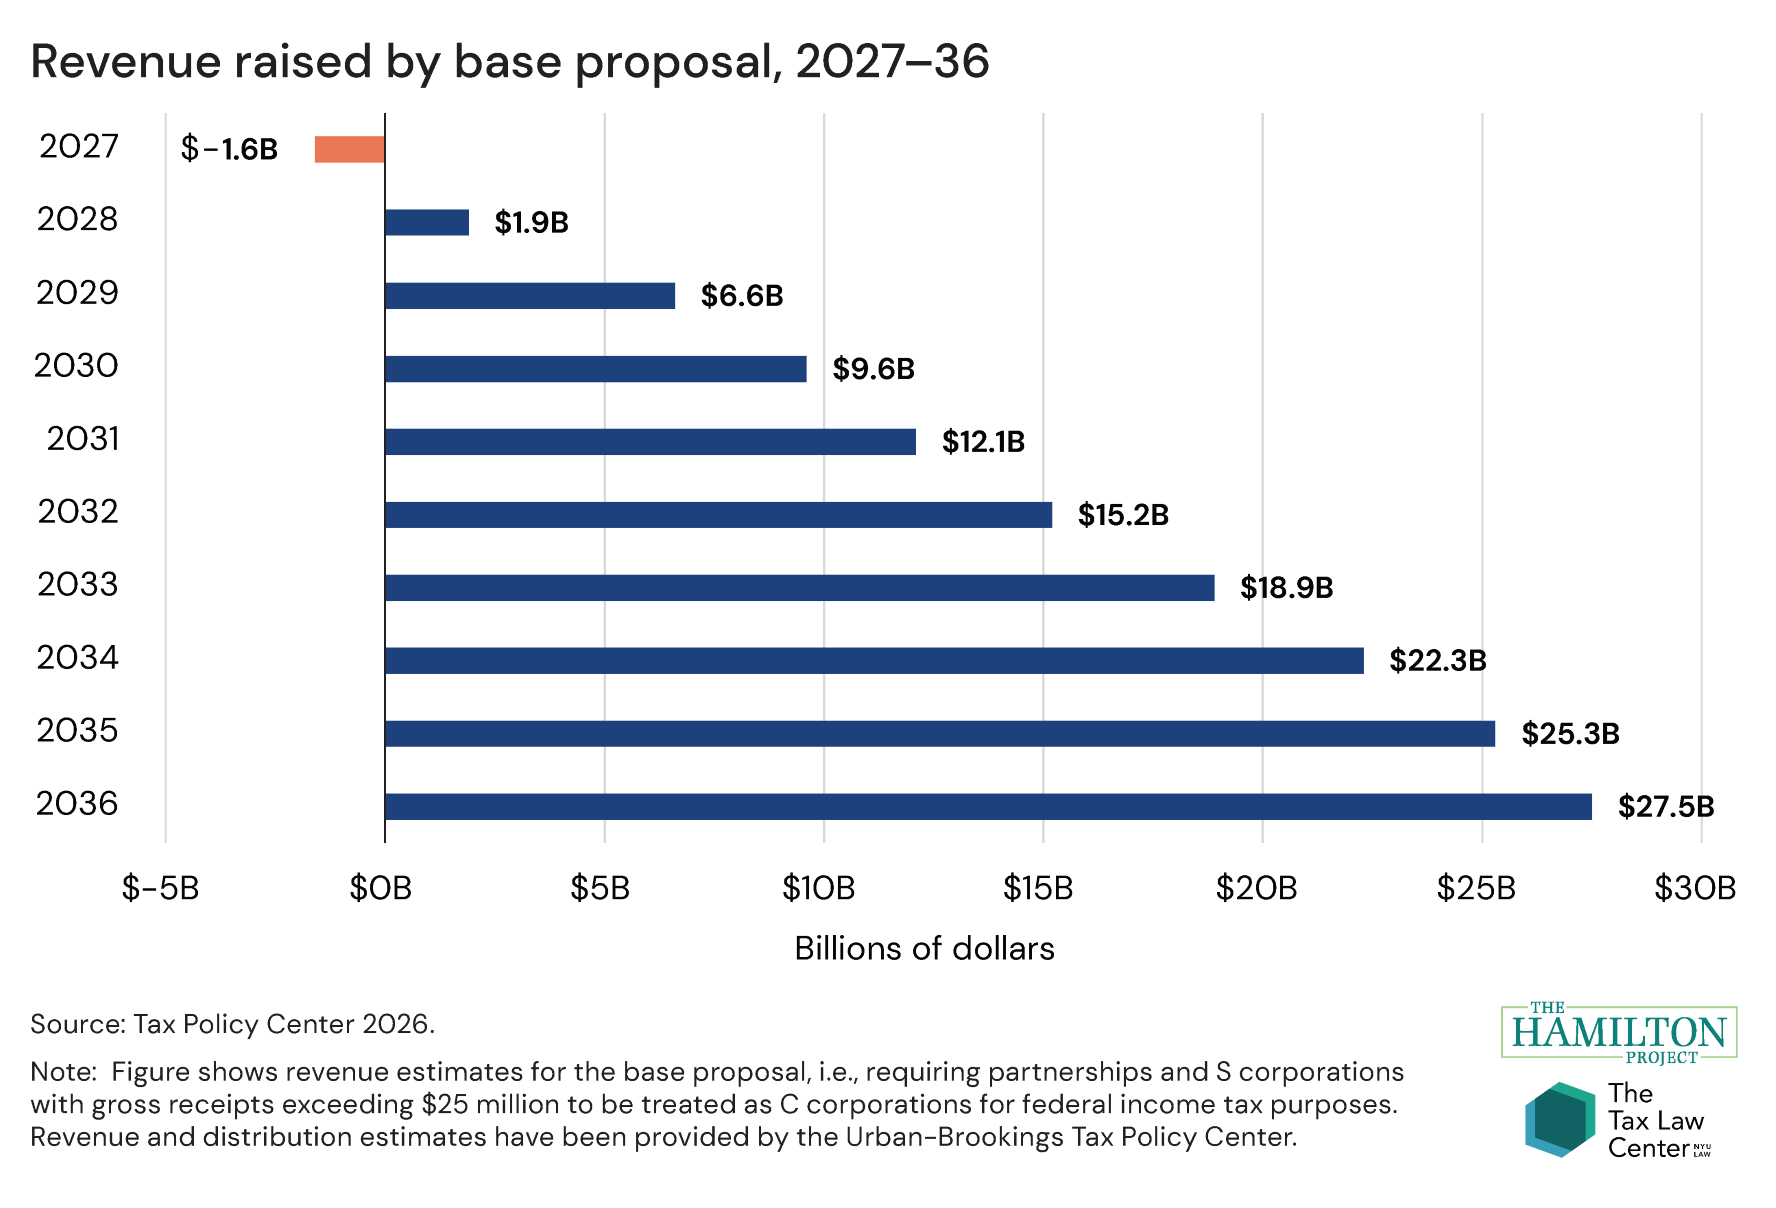
"Toward a uniform business tax system: Examining proposals to tax large pass-through entities as corporations"
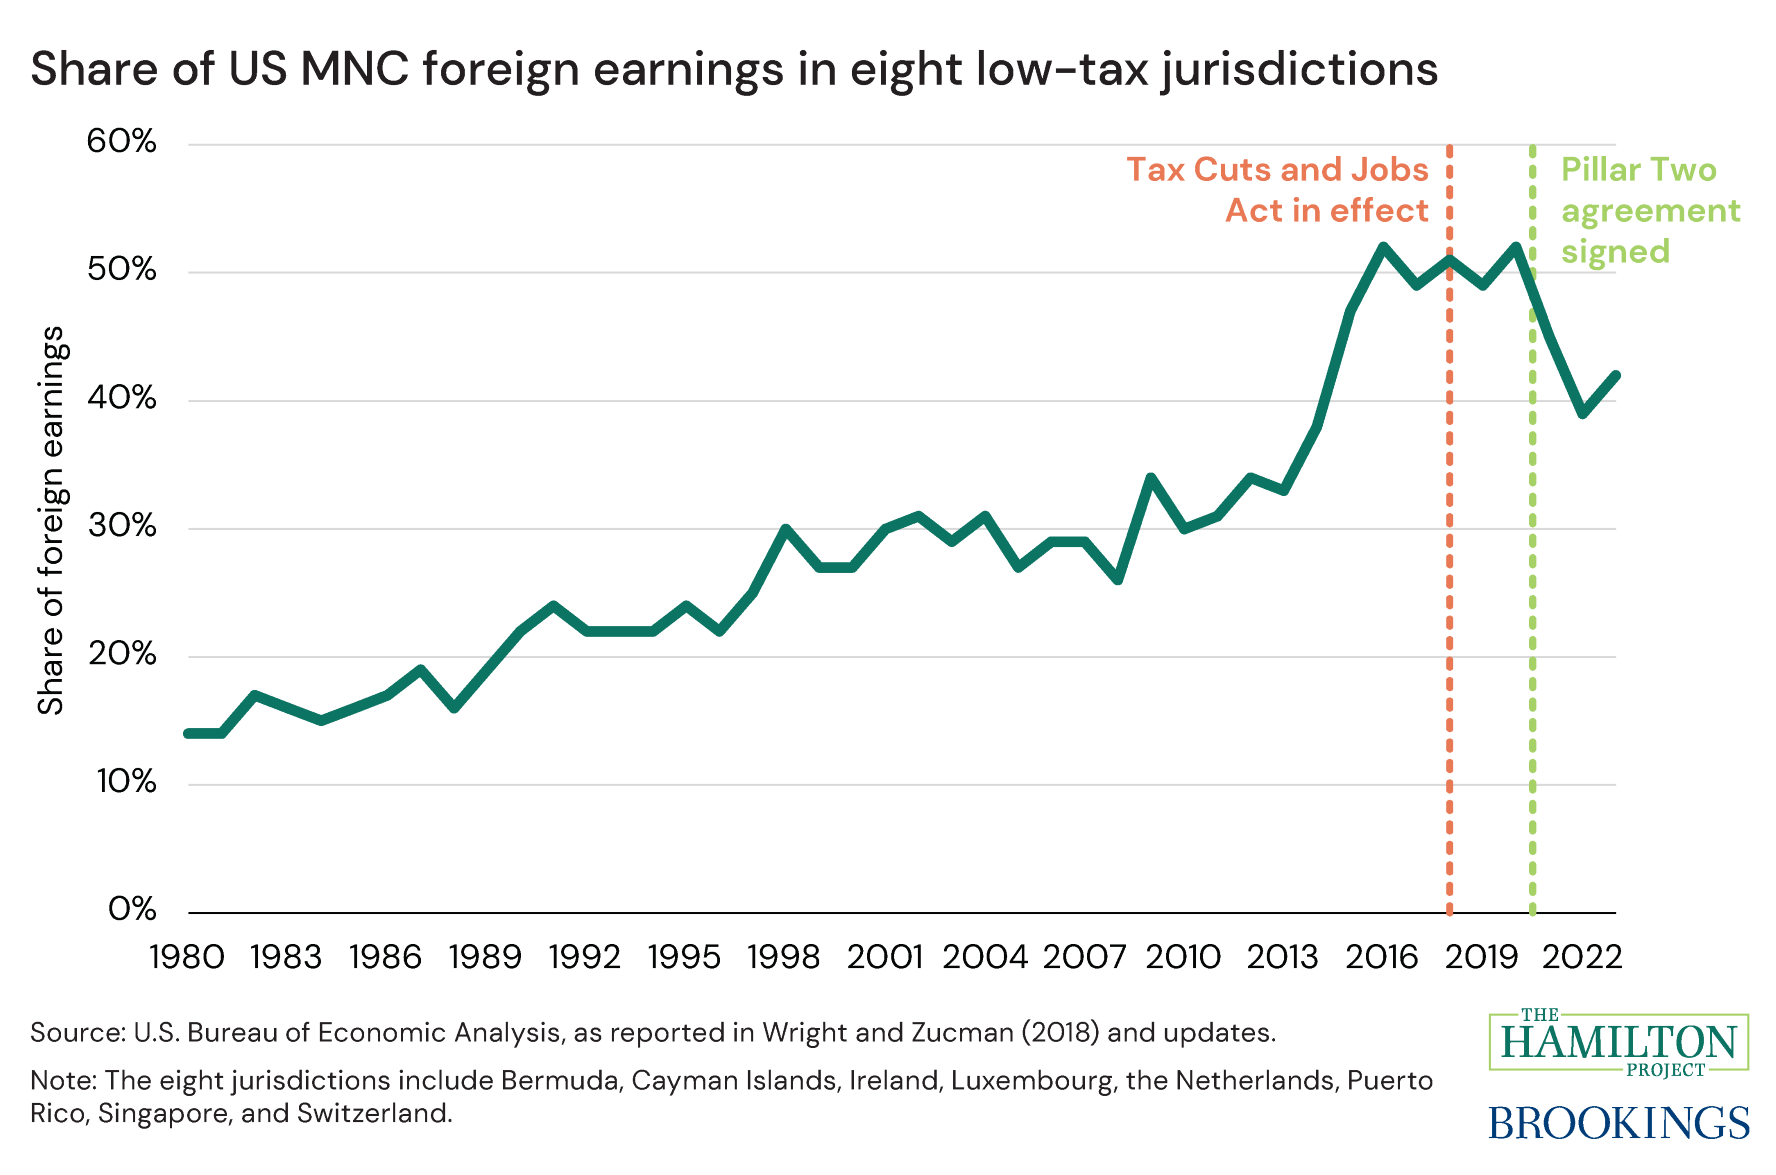
"The future of US international corporate tax reform"
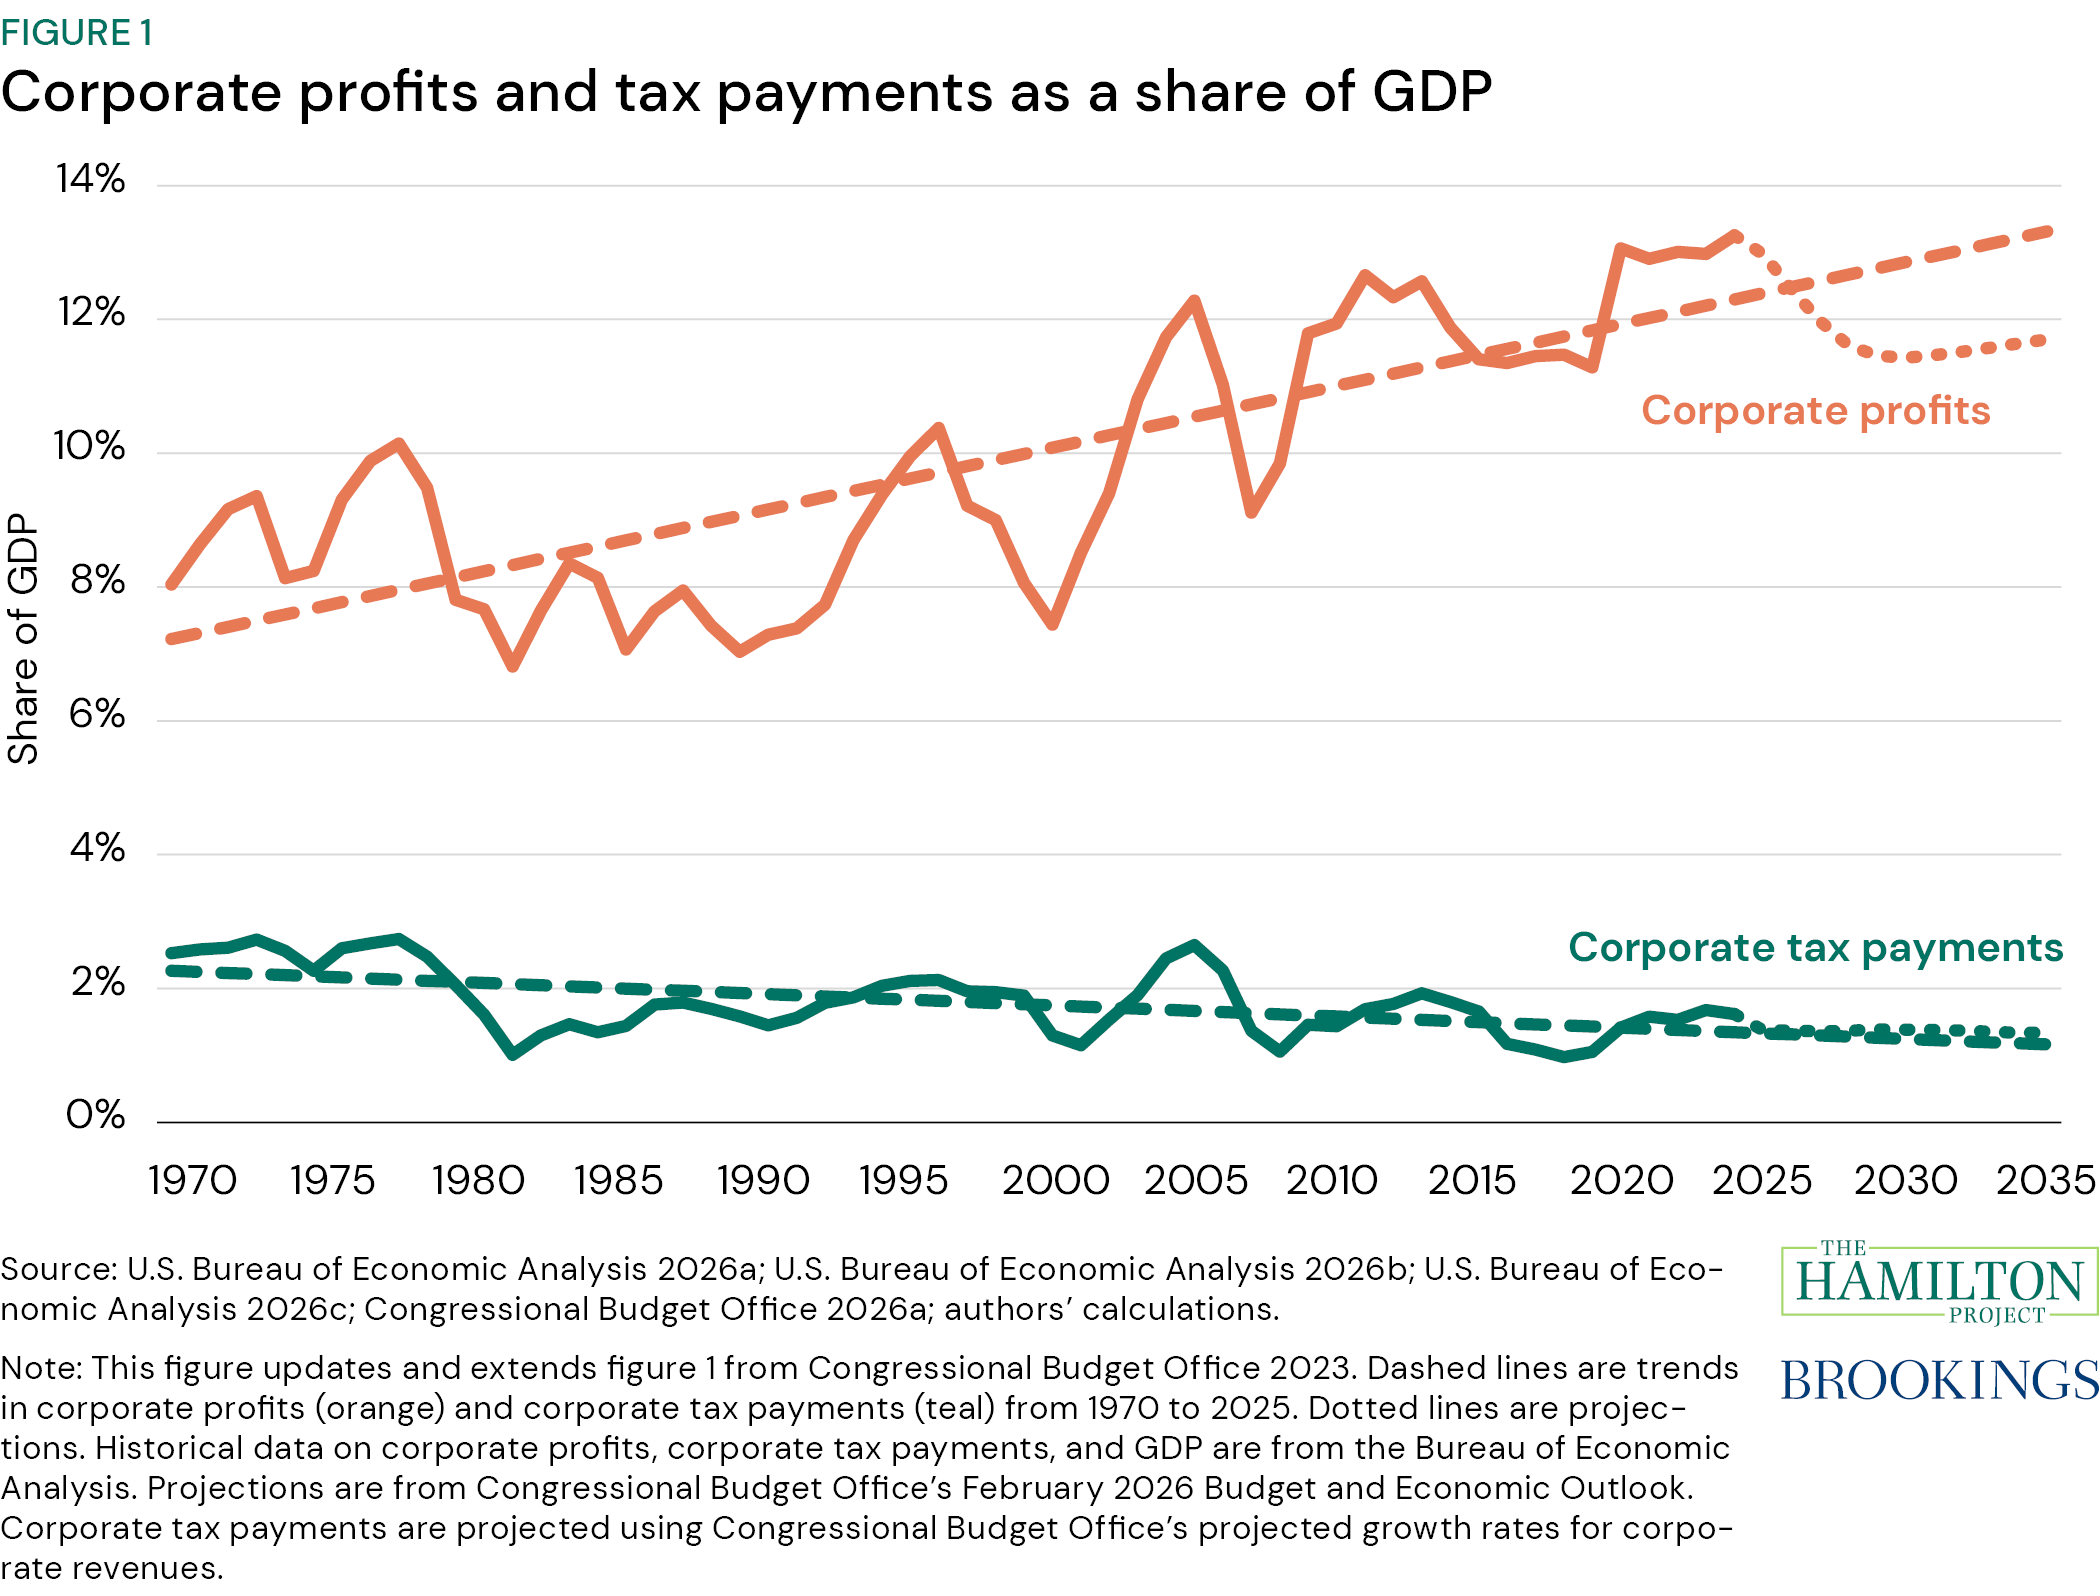
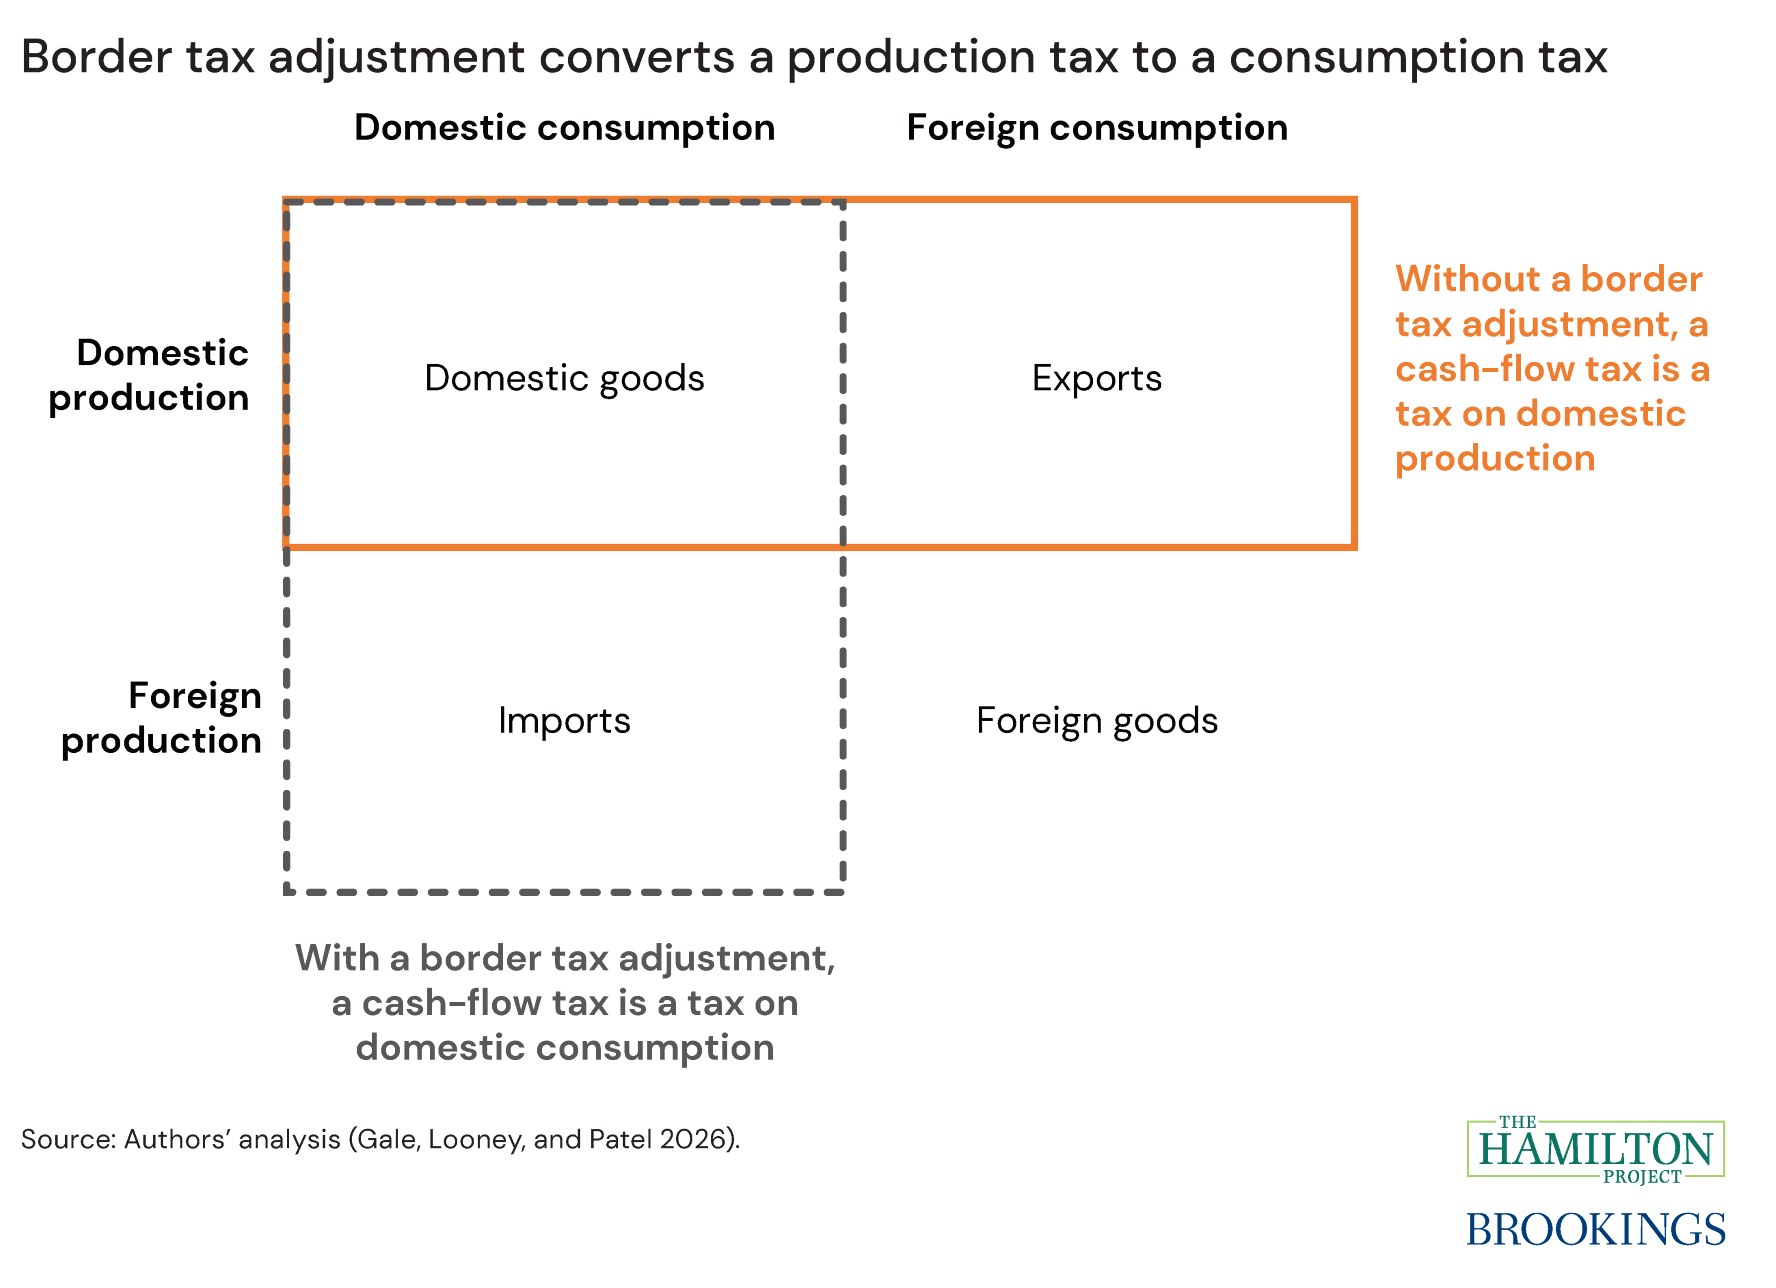
"Corporate tax reform in the wake of the 2025 tax law: Completing the shift to a corporate cash-flow tax"
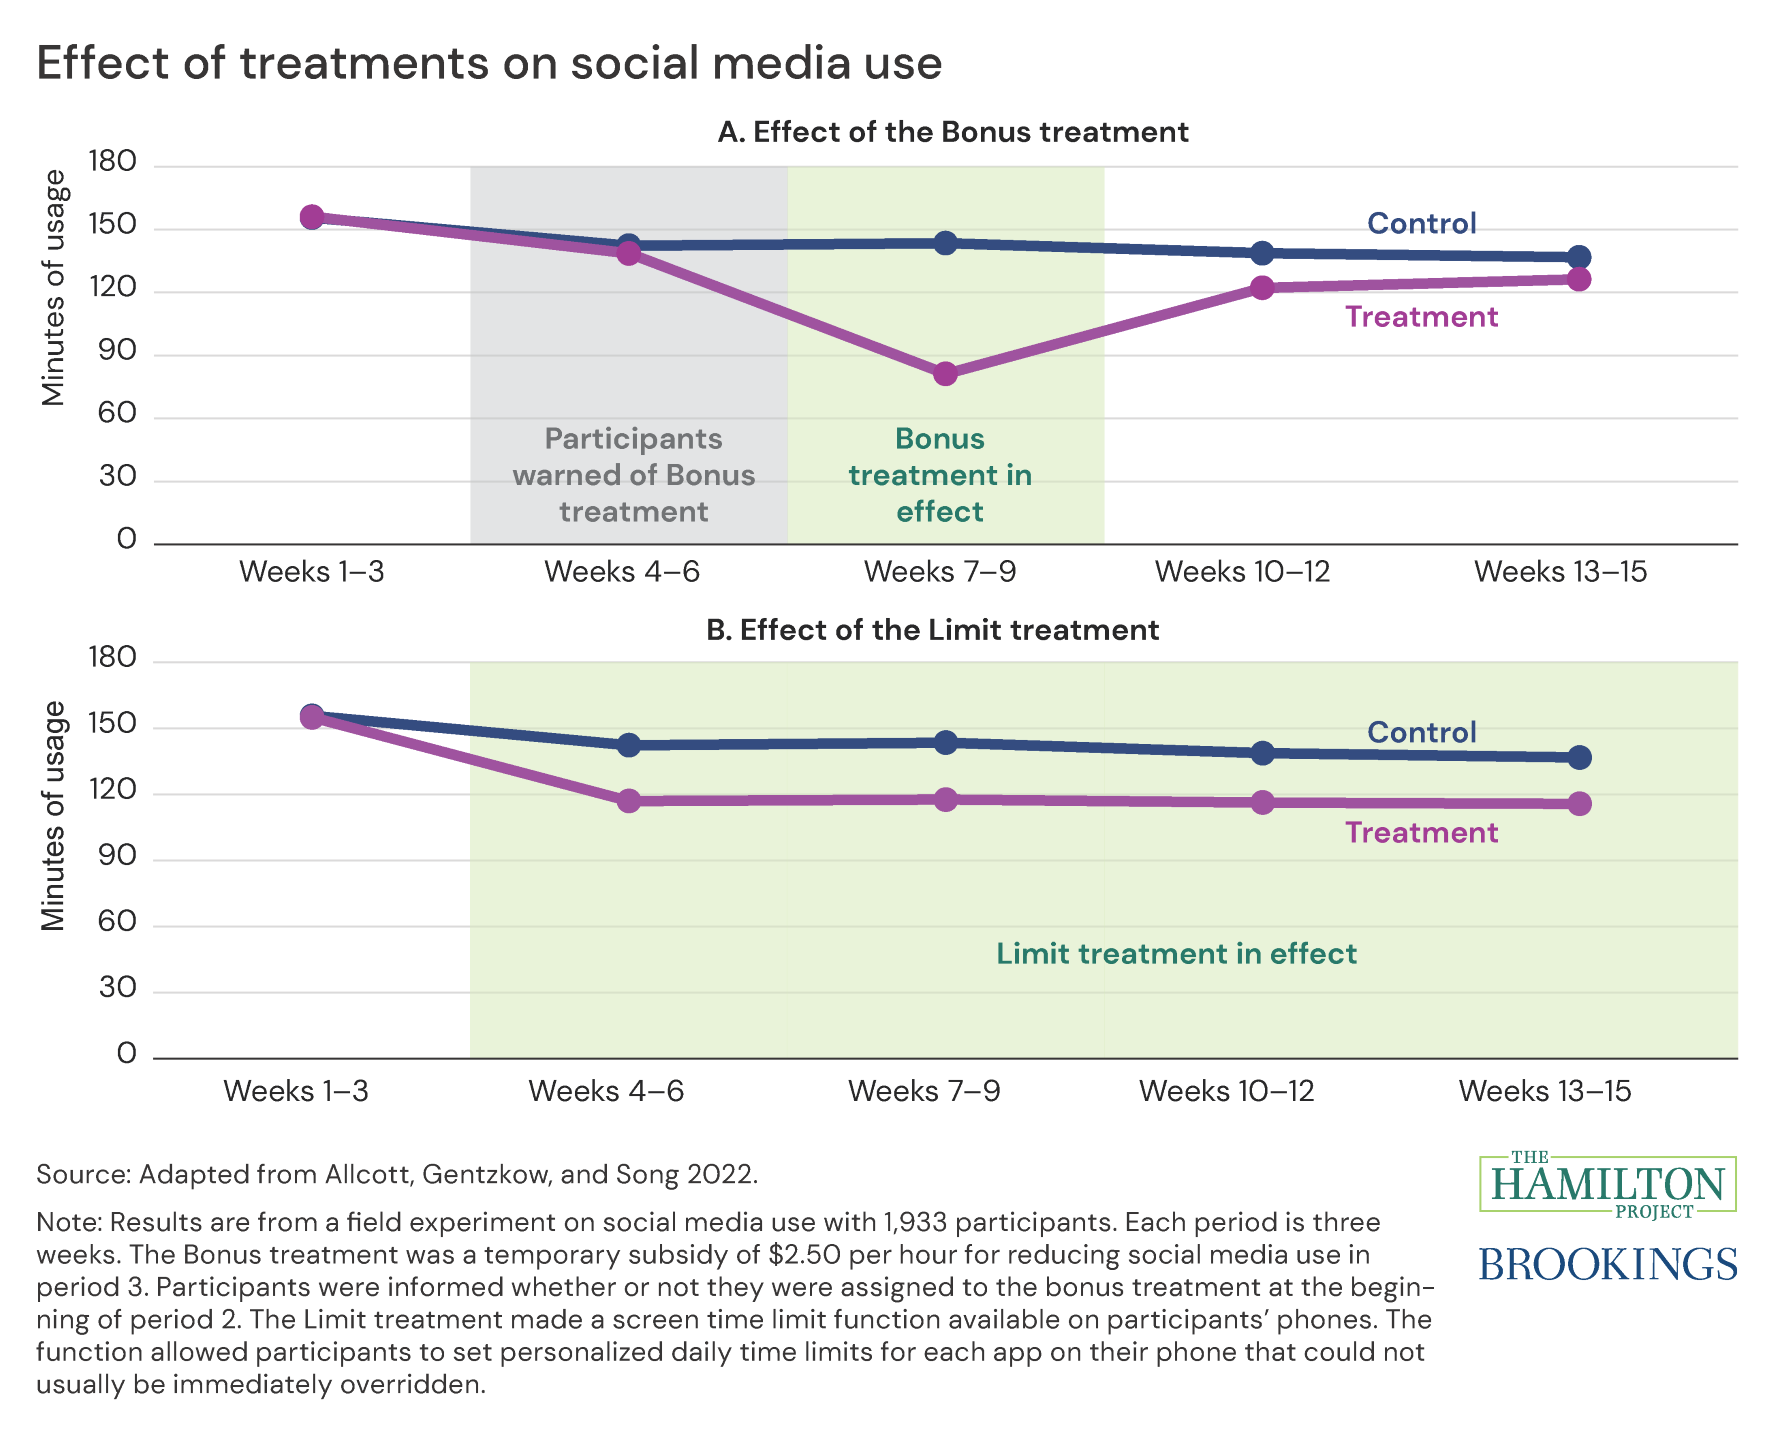
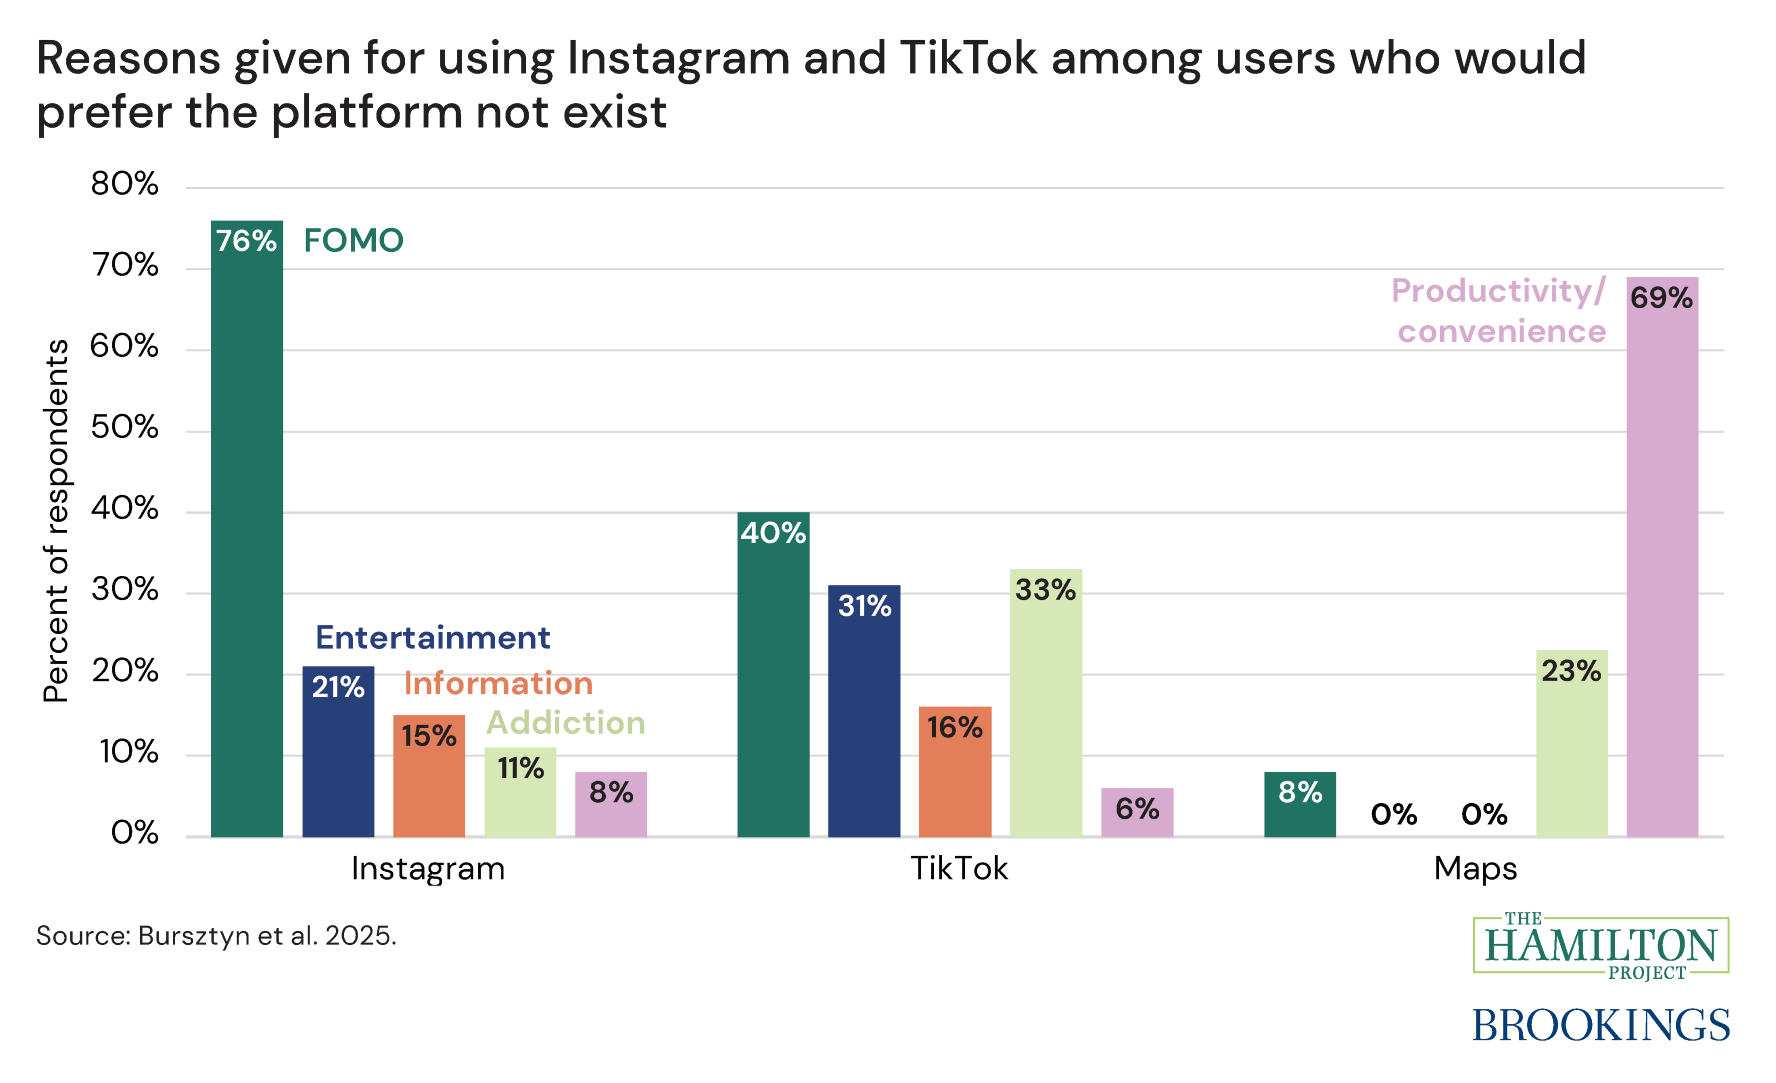
"Digital addiction: Evidence and policy implications"
"Product market traps in social media: Evidence and policy implications"
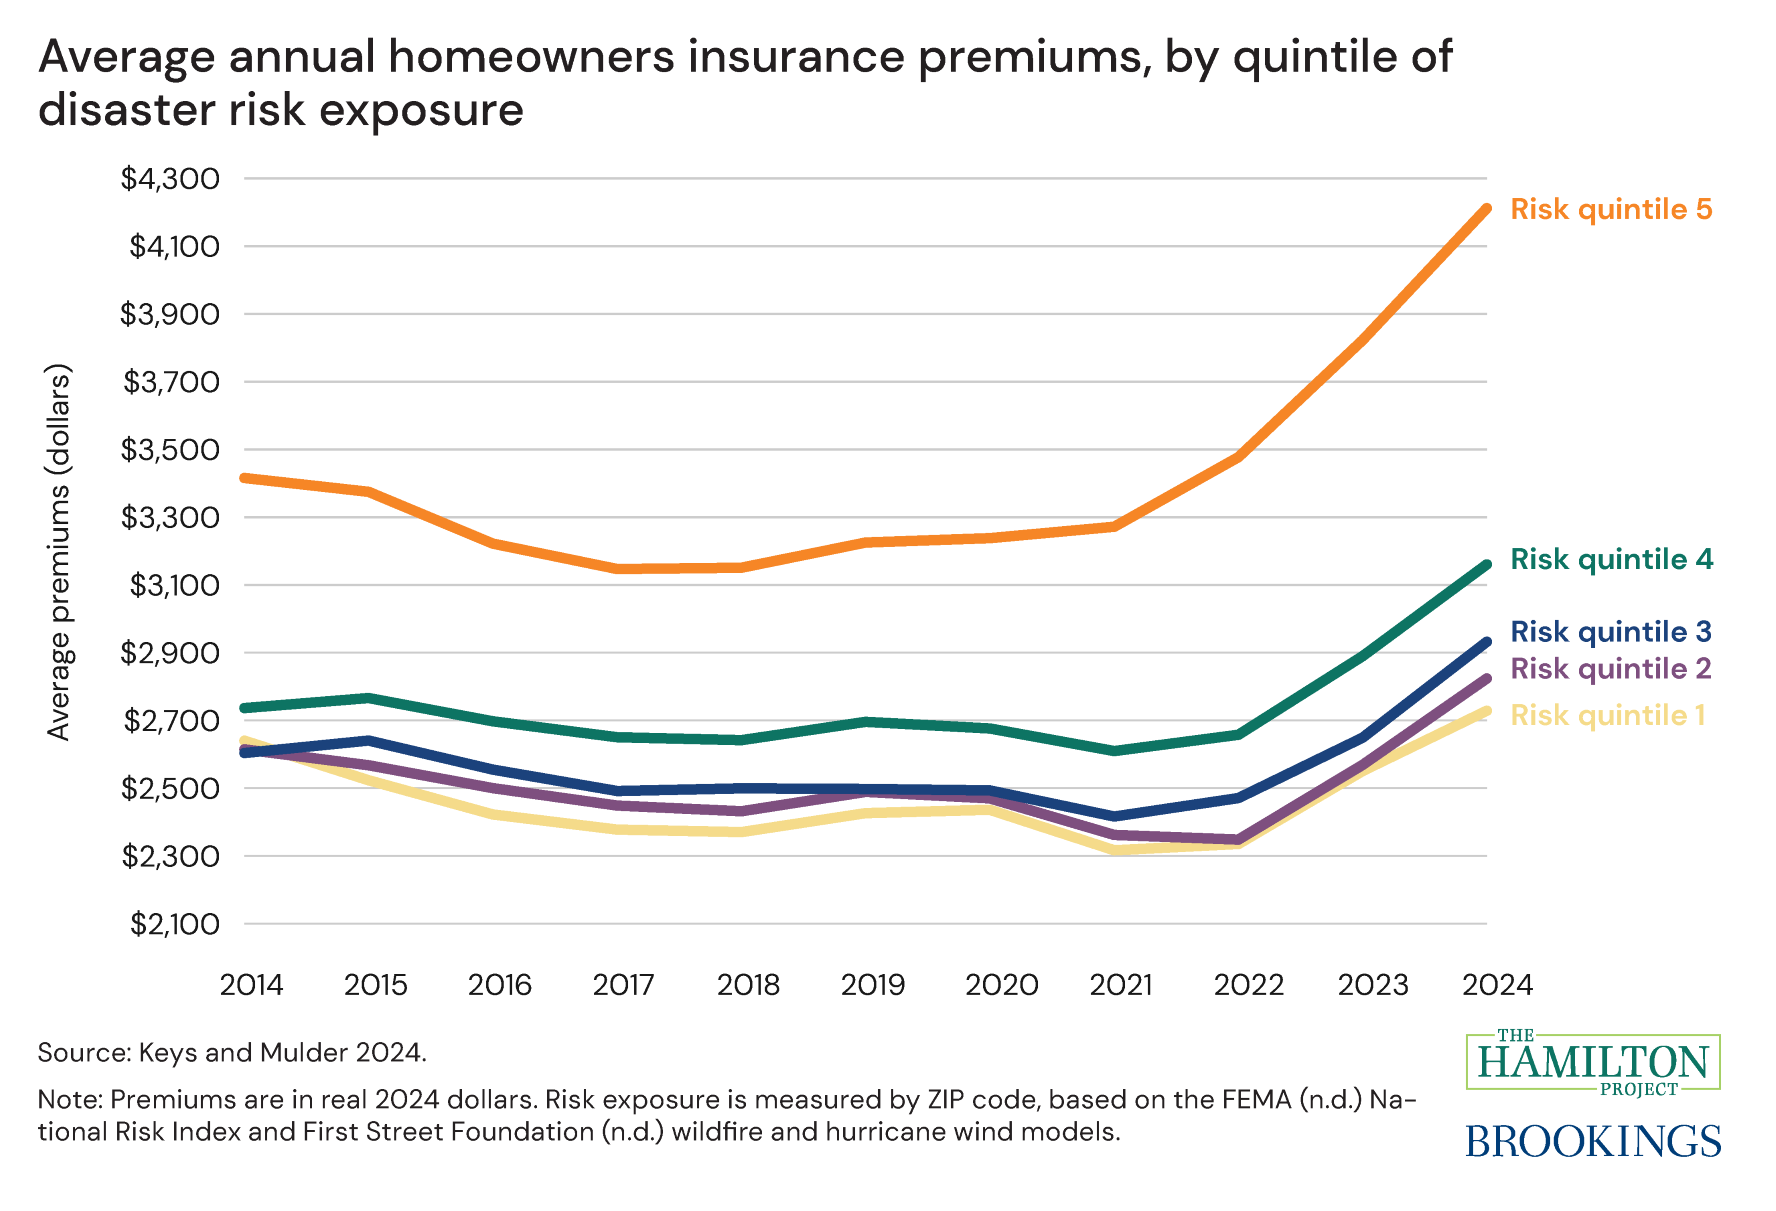
"A proposal for a US federal property reinsurer"
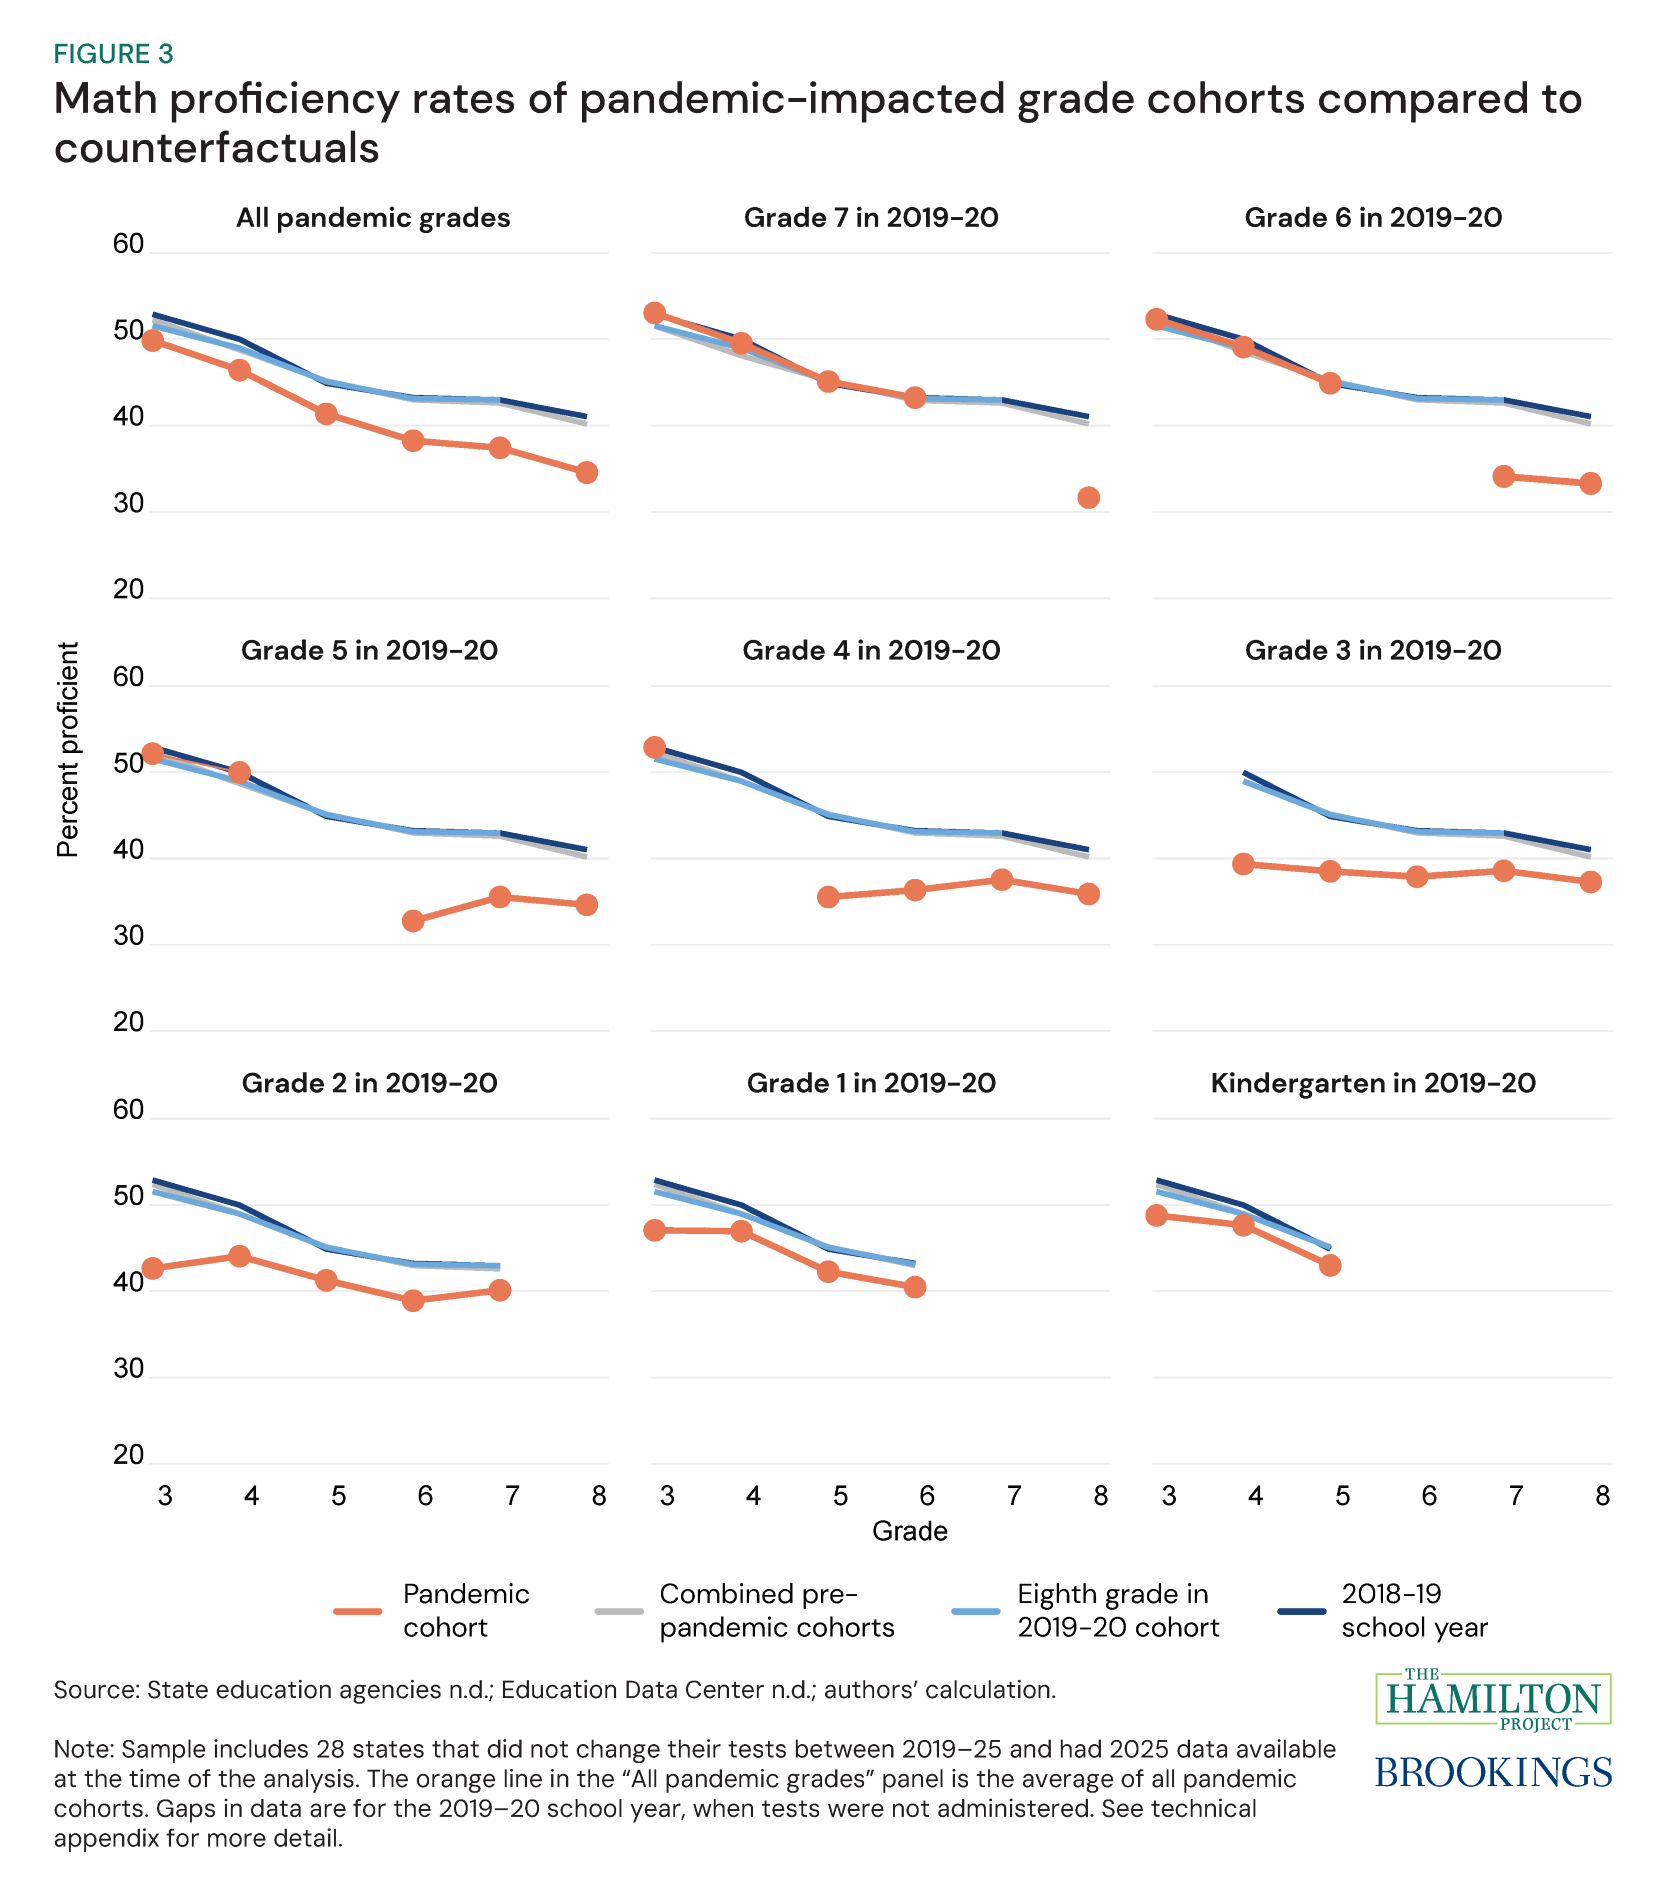
"Learning curves: Post-COVID learning trajectories differ by the grade a student was in when the pandemic hit"
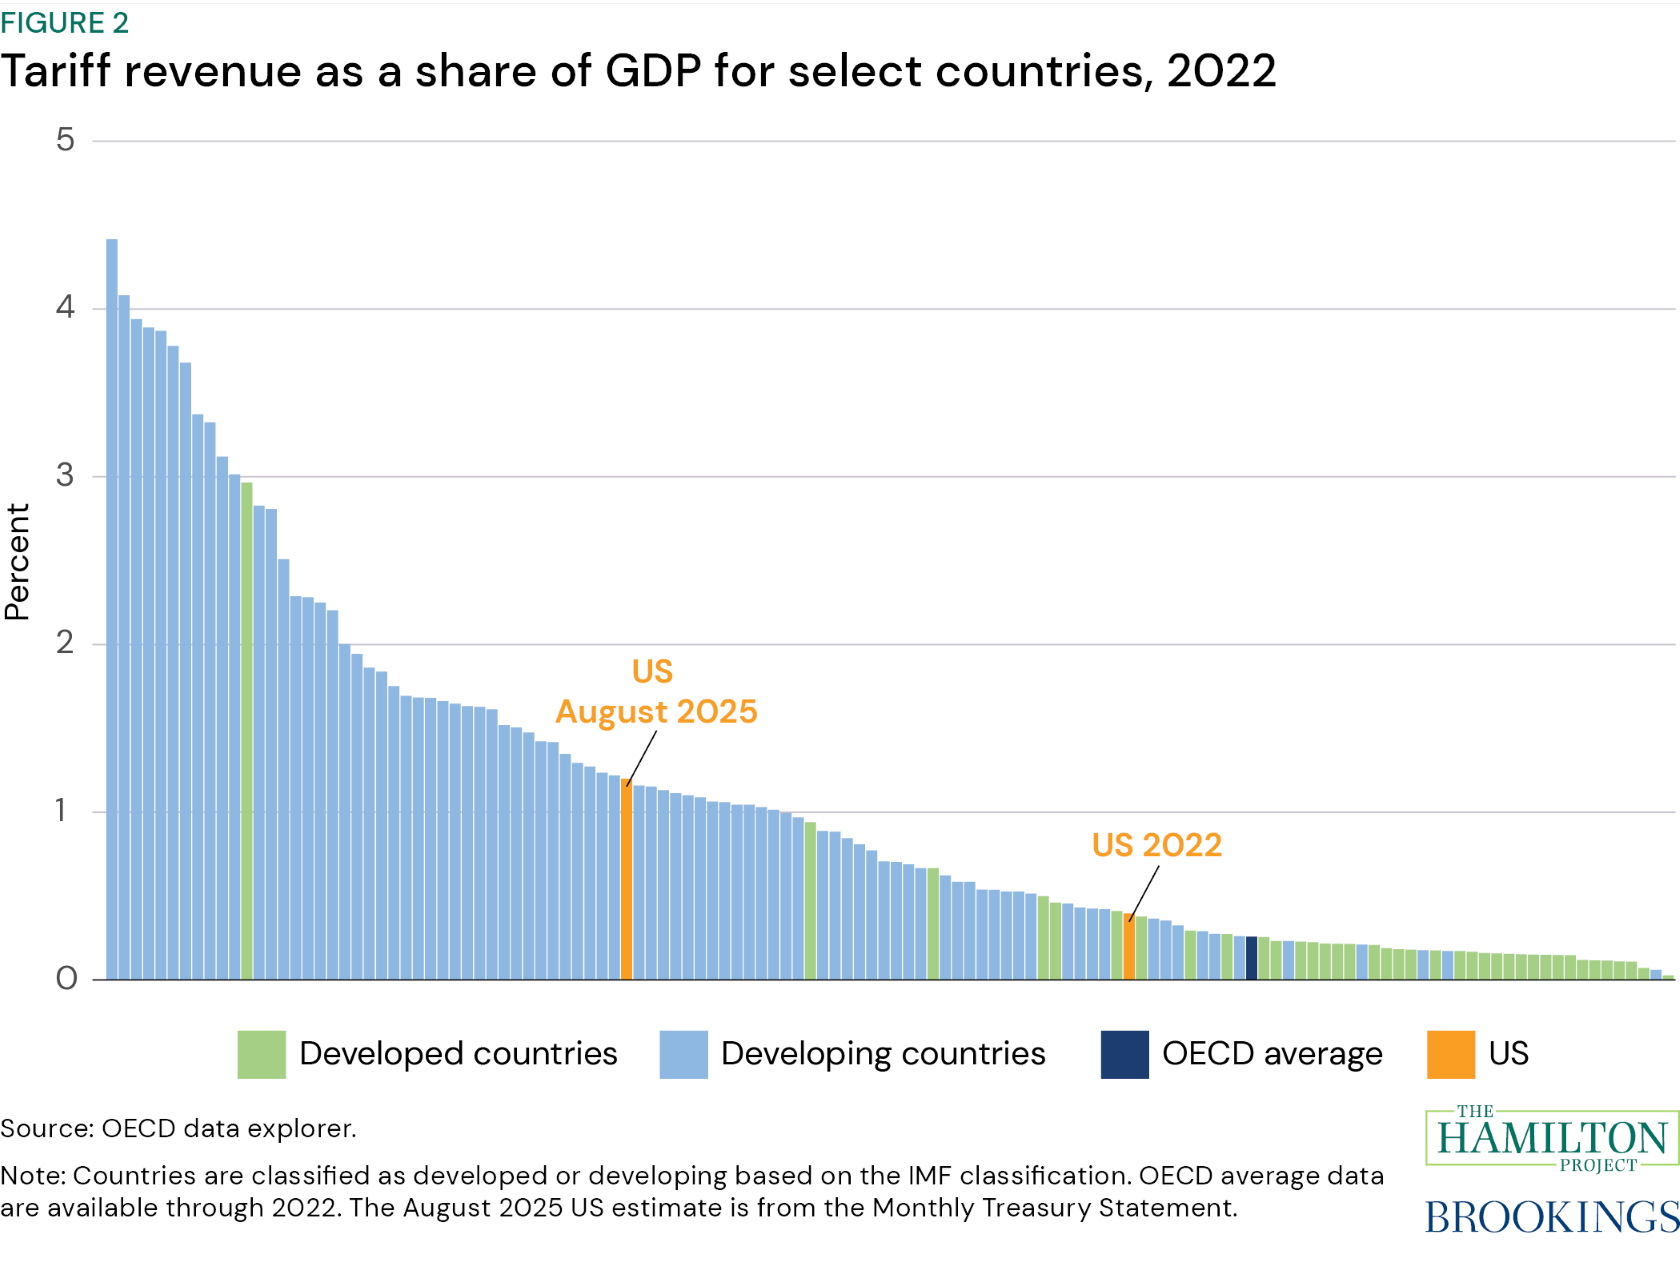
"Tariffs are a particularly bad way to raise revenue"
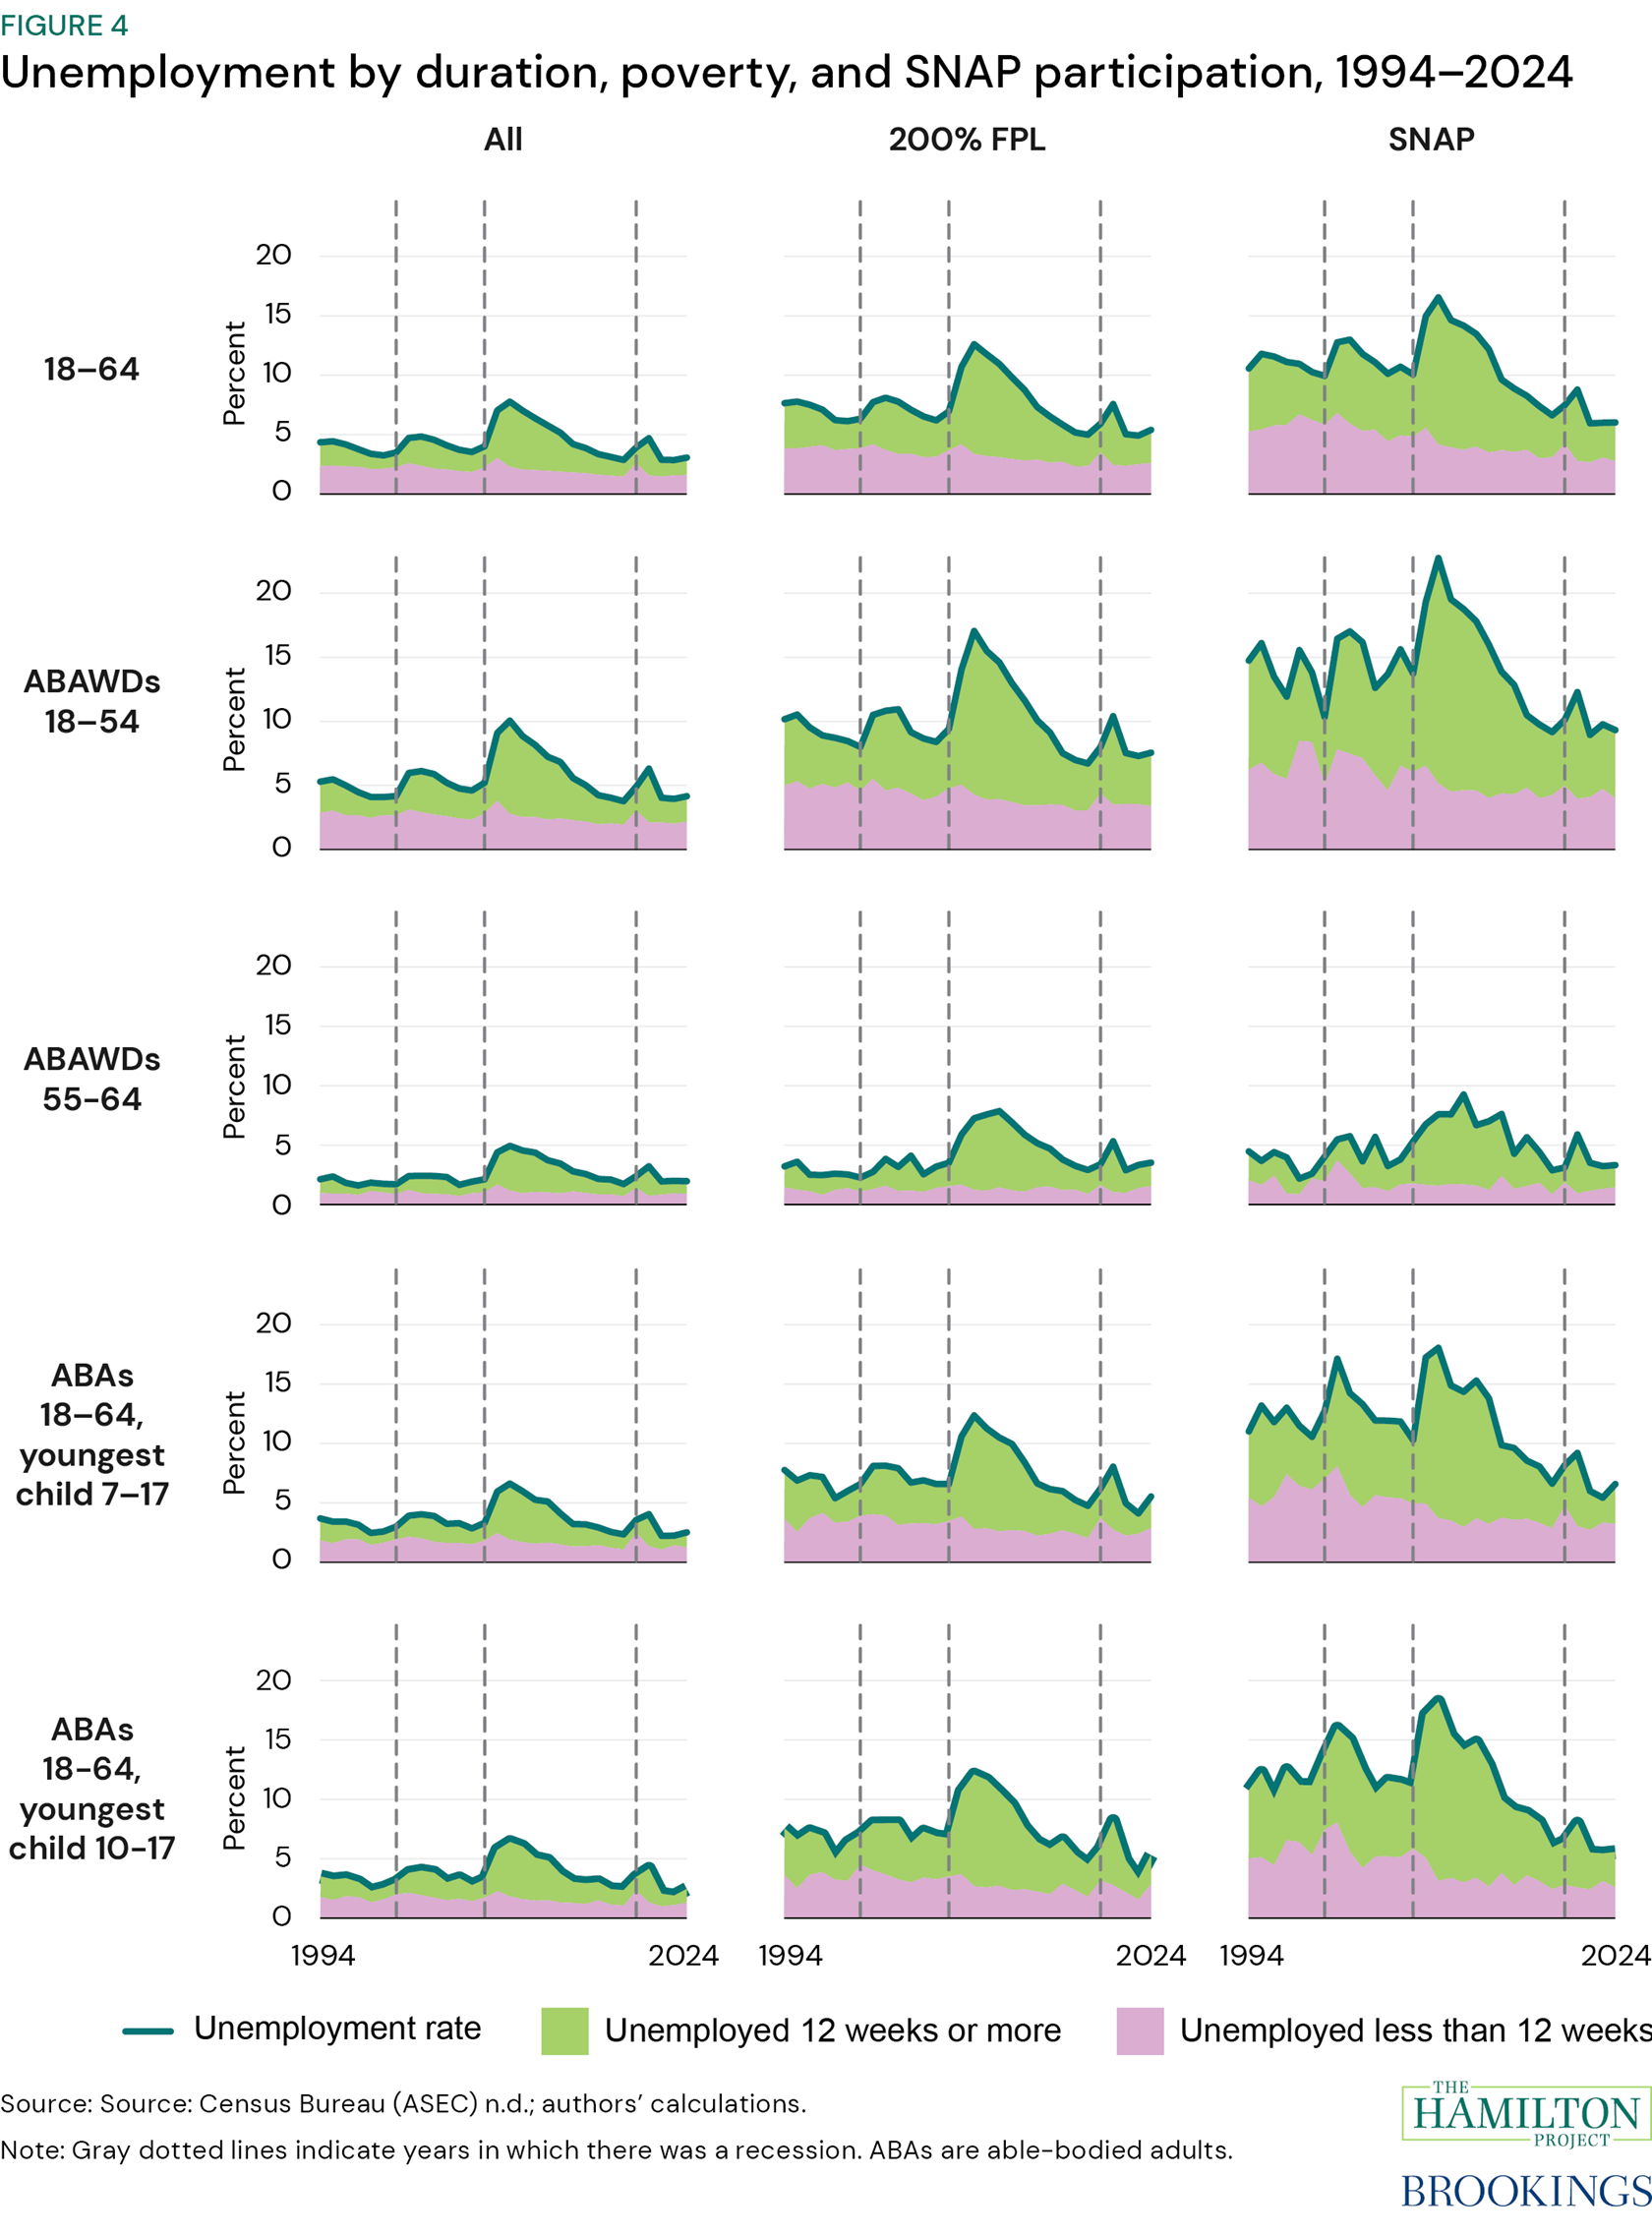
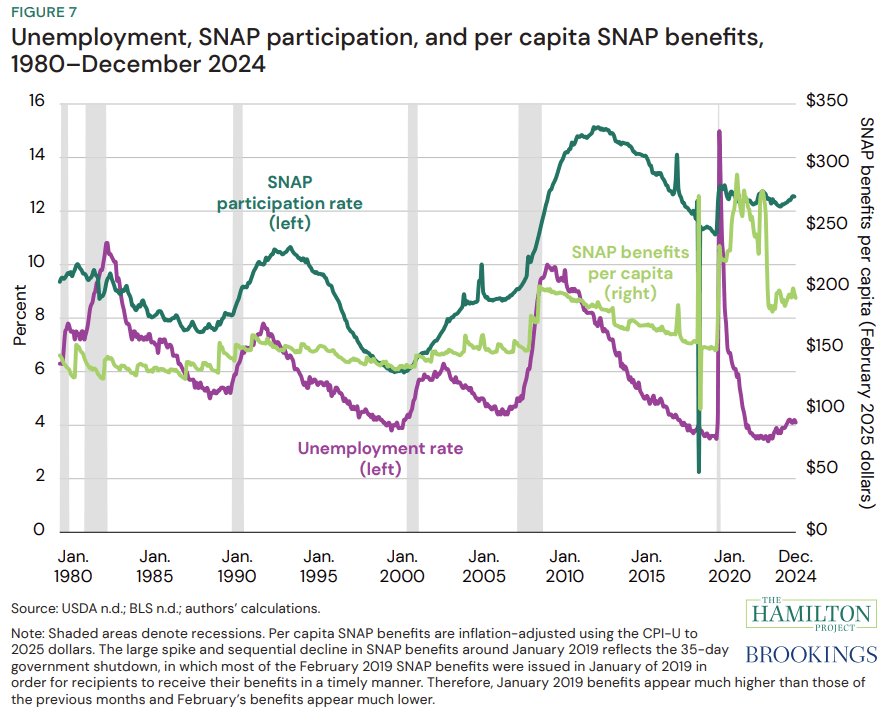
"SNAP cuts in the One Big Beautiful Bill Act will significantly impair recession response"
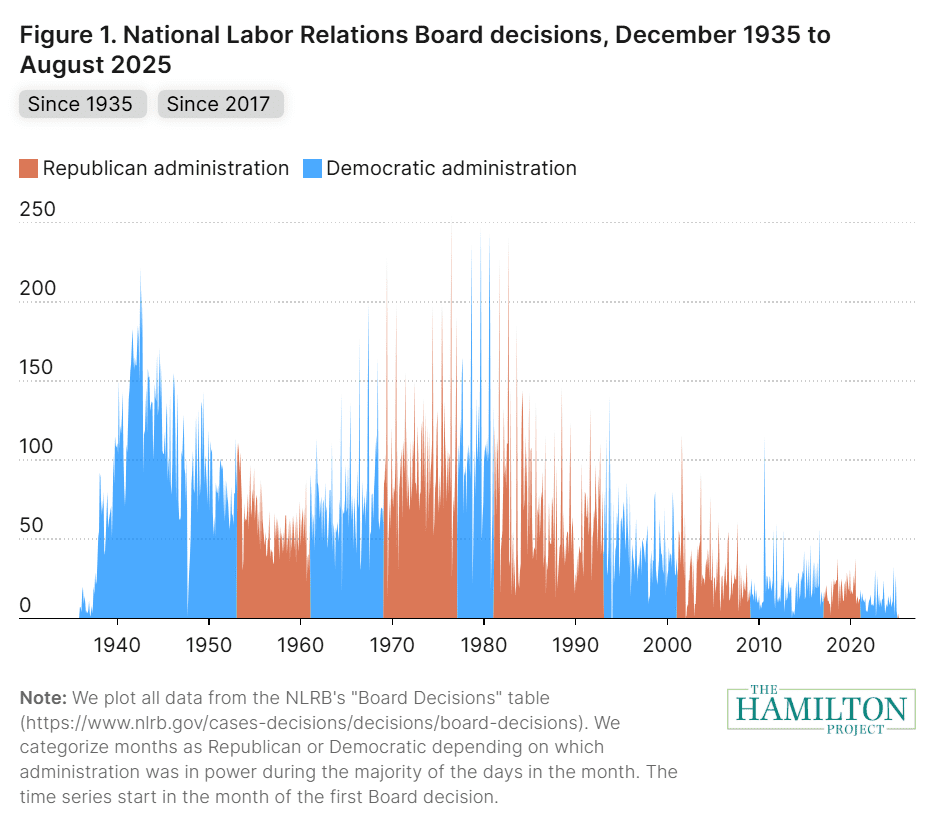
"Tracking National Labor Relations Board actions through its administrative data"
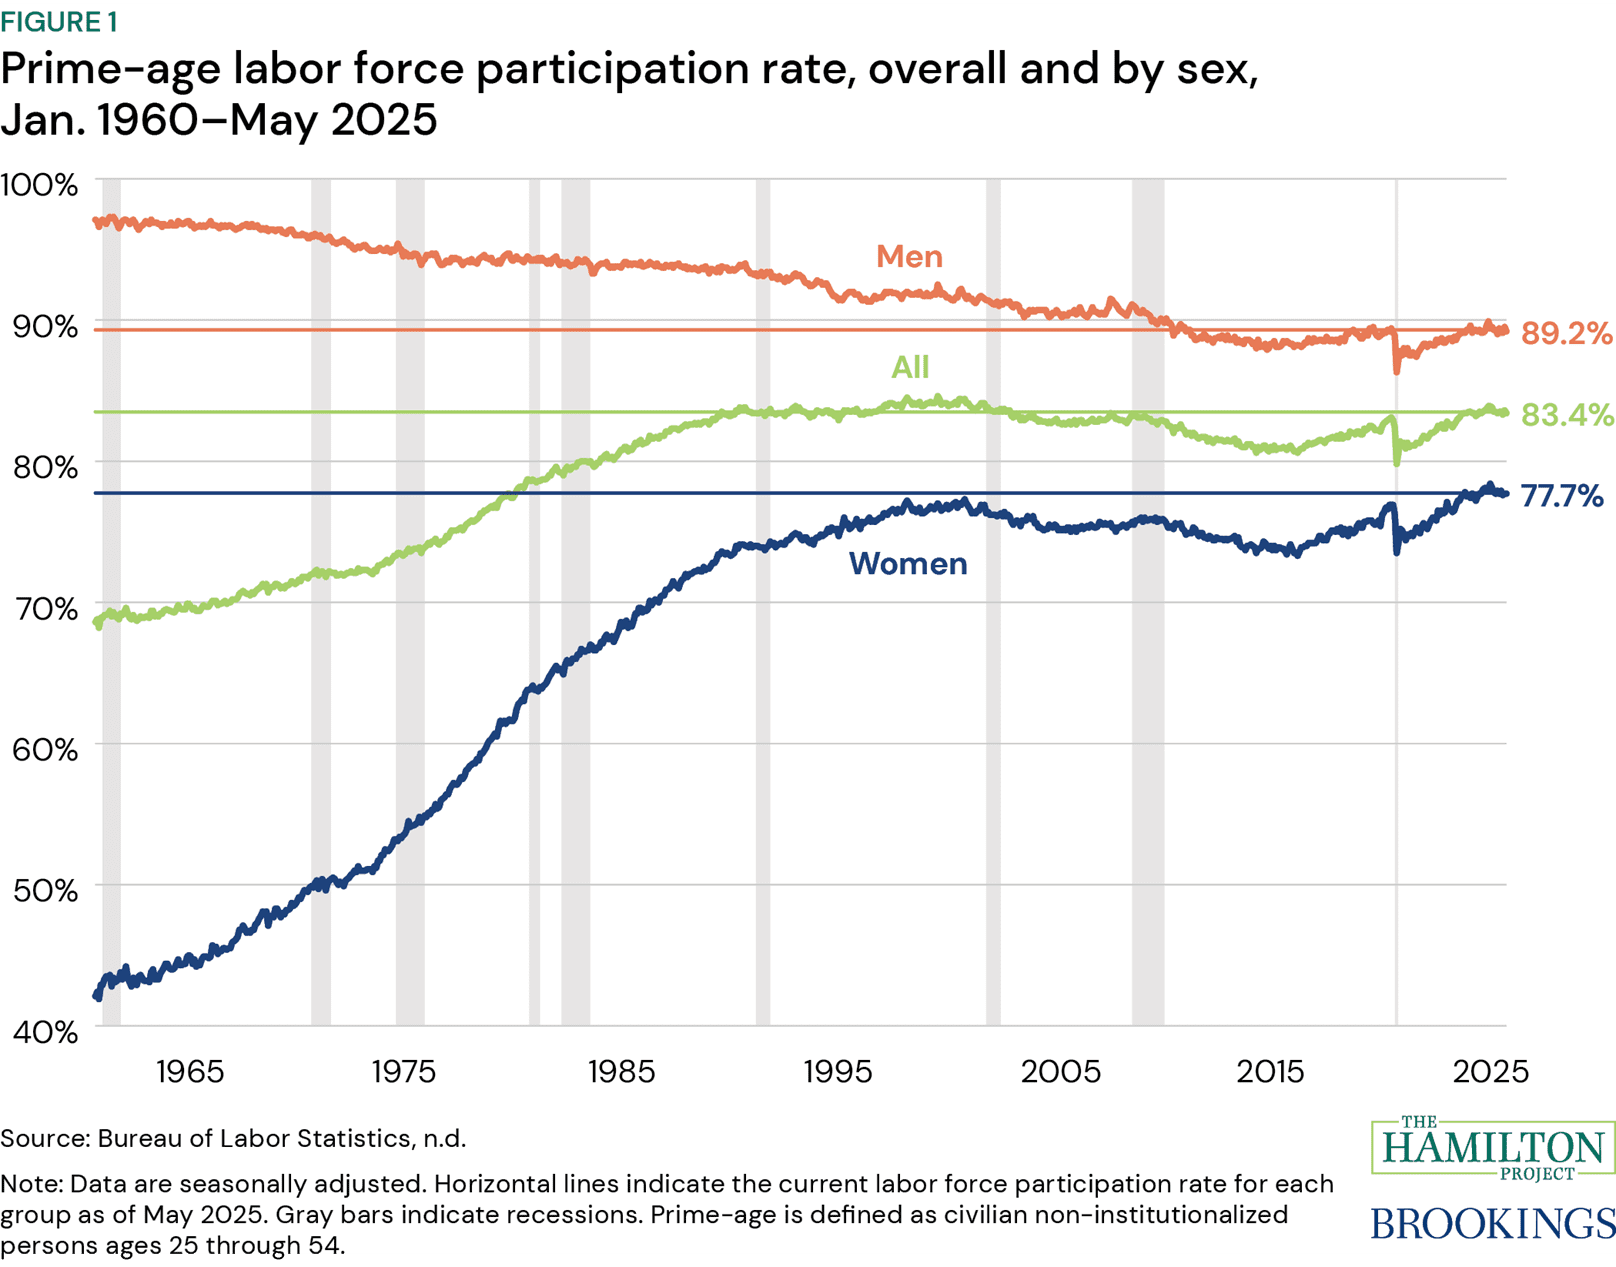
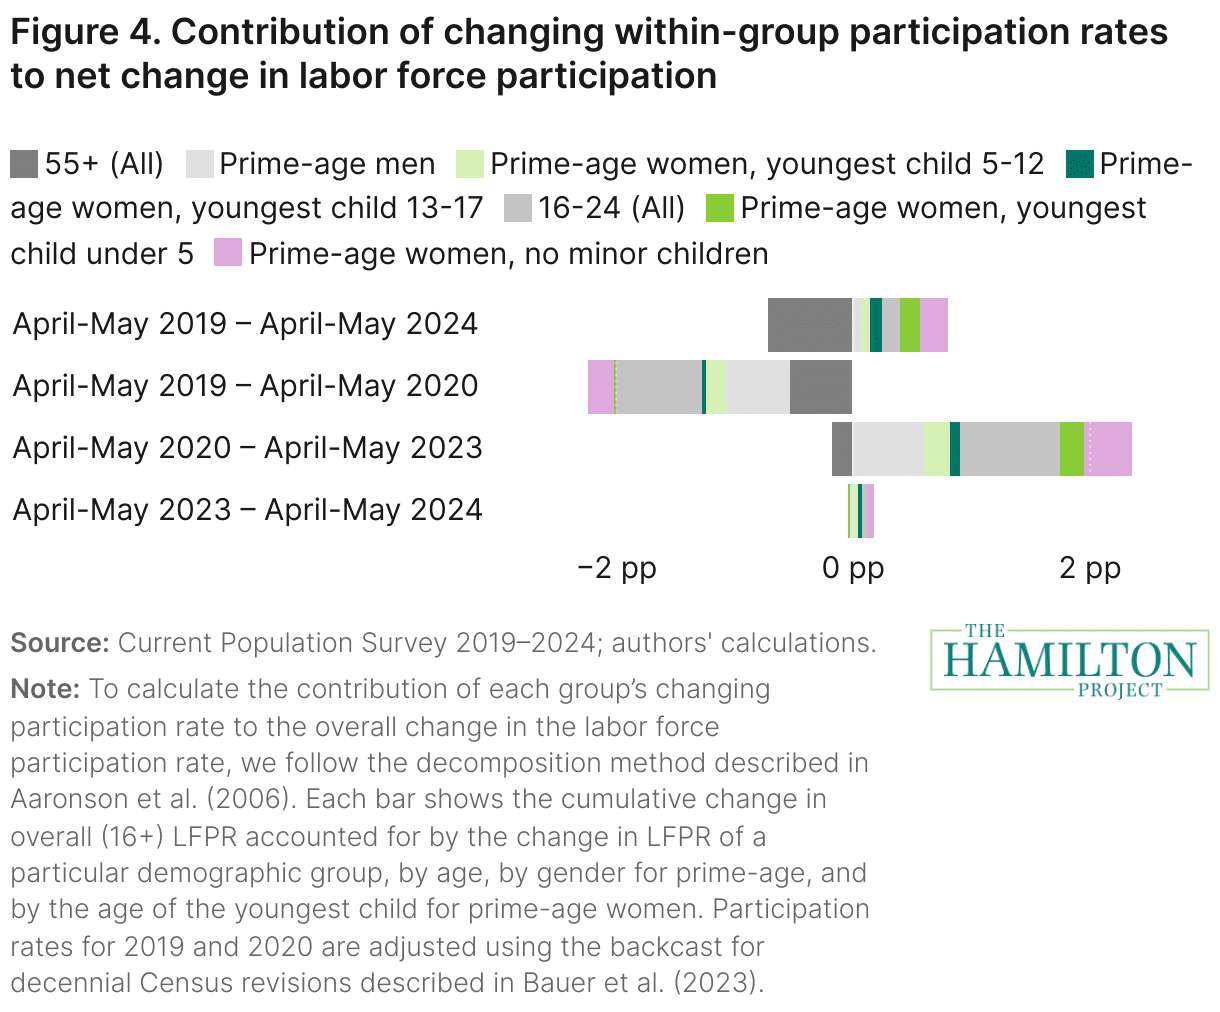
"Seven economic facts about prime-age labor force participation"
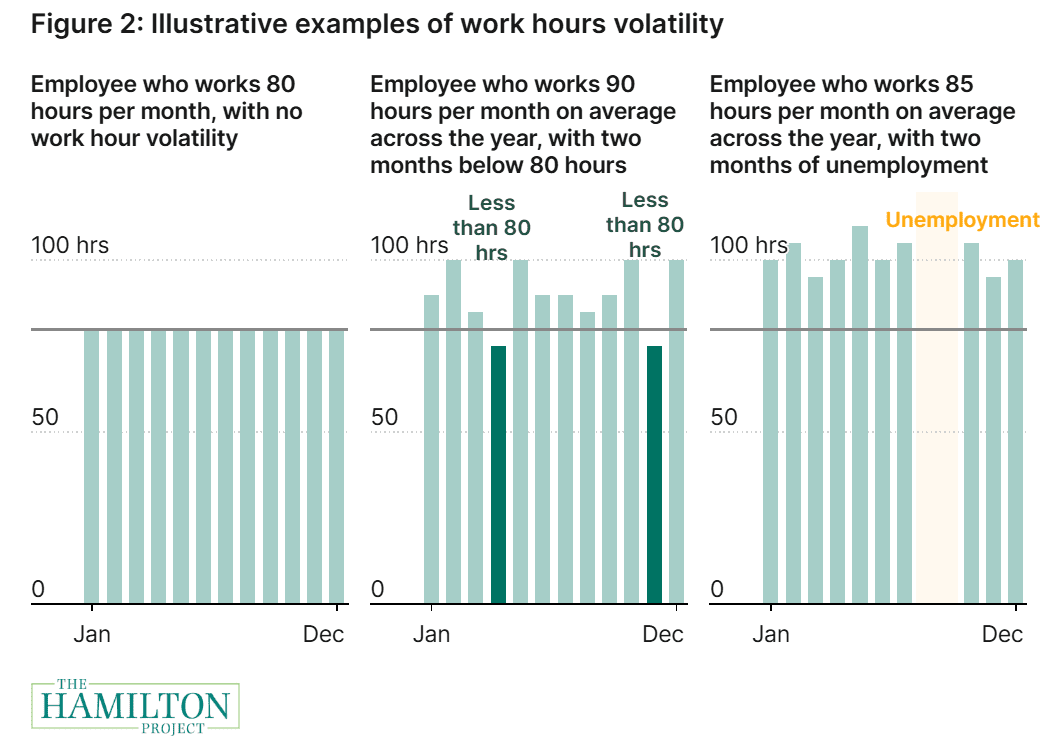
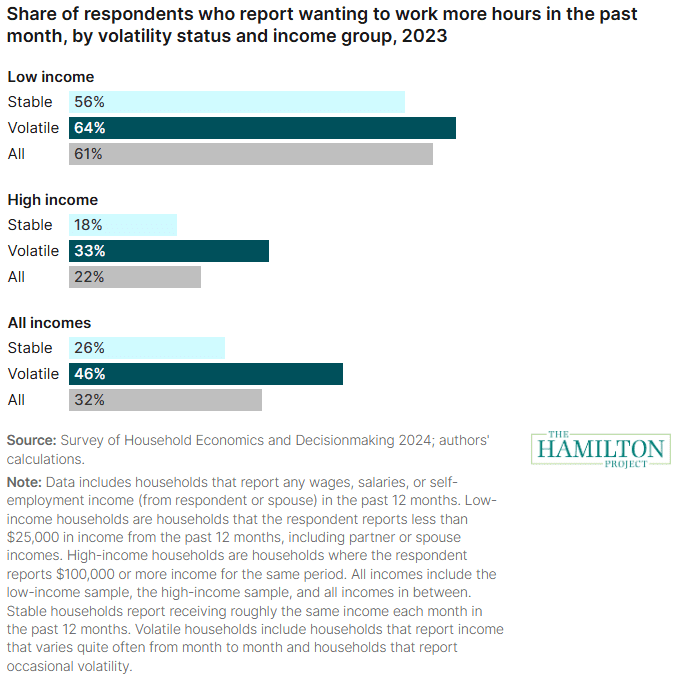
"Work requirements penalize workers in volatile occupations"
"A primer on SNAP work requirements"
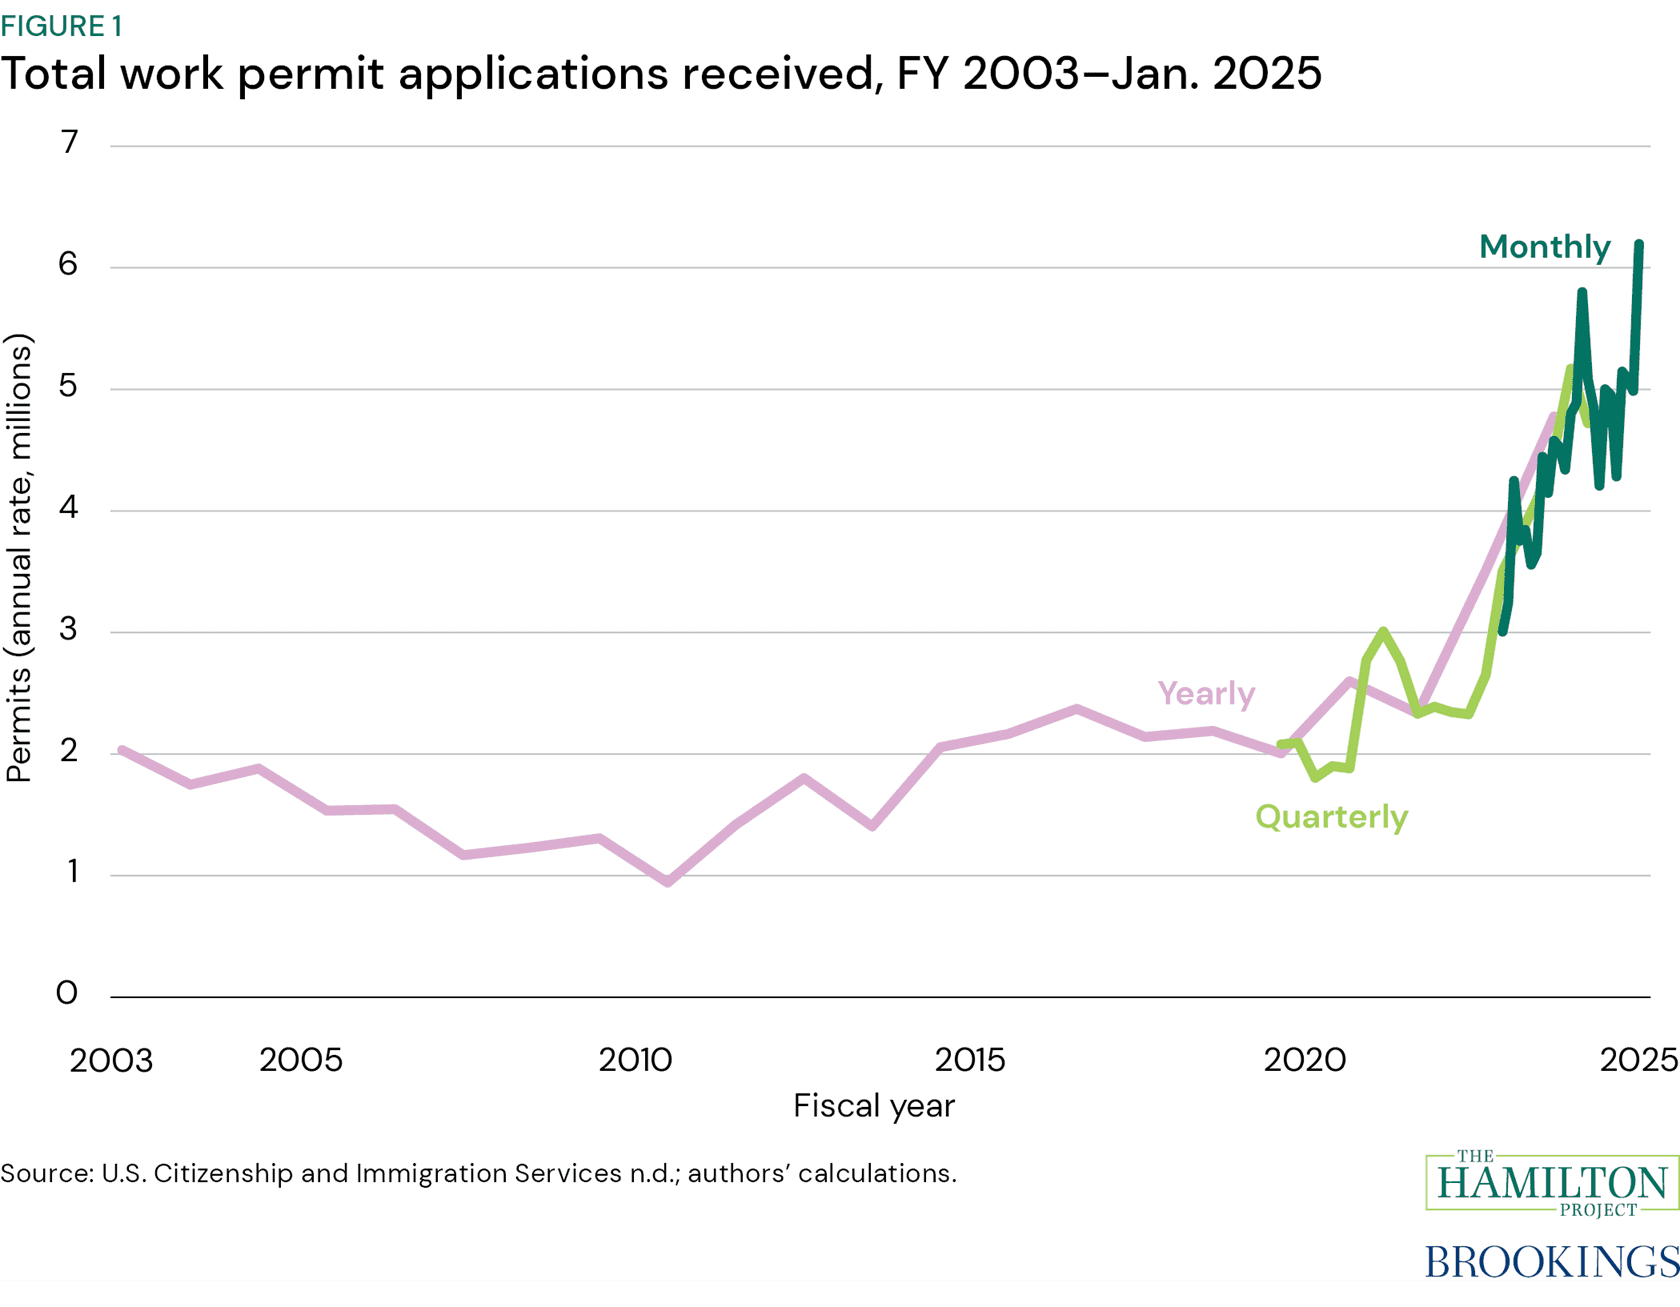
"Work permit applications suggest prior immigration is still pushing up labor supply—for now"
"Low-income workers experience—by far—the most earnings and work hours instability"
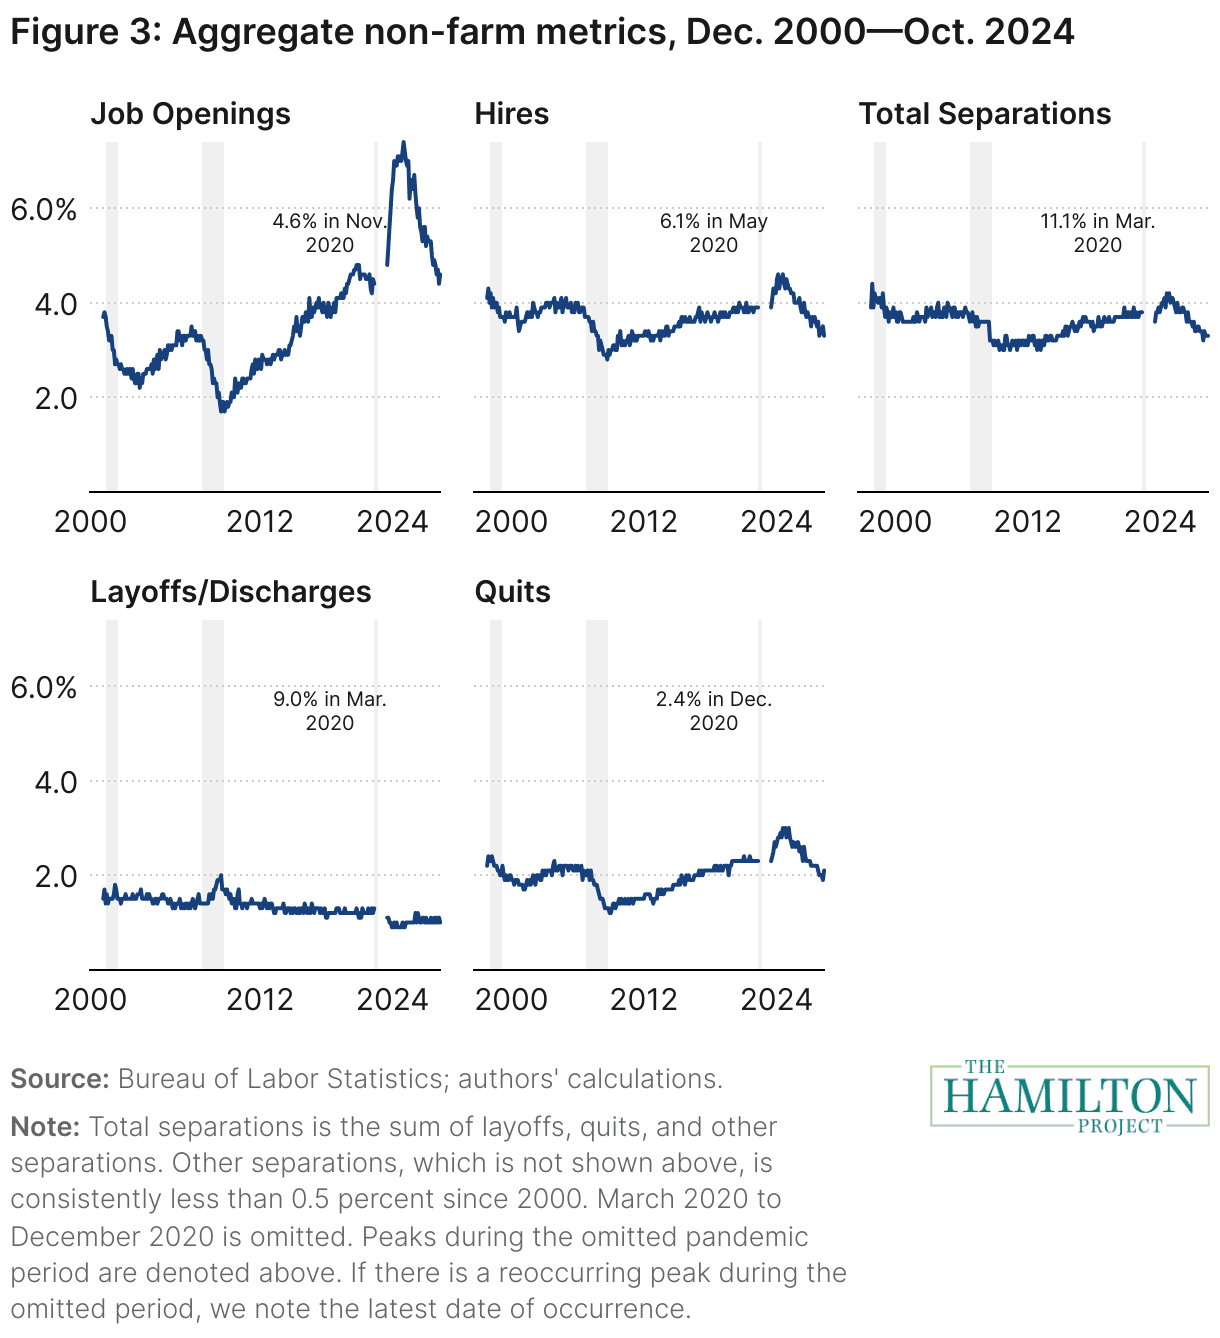
"The softening labor market is still growing"
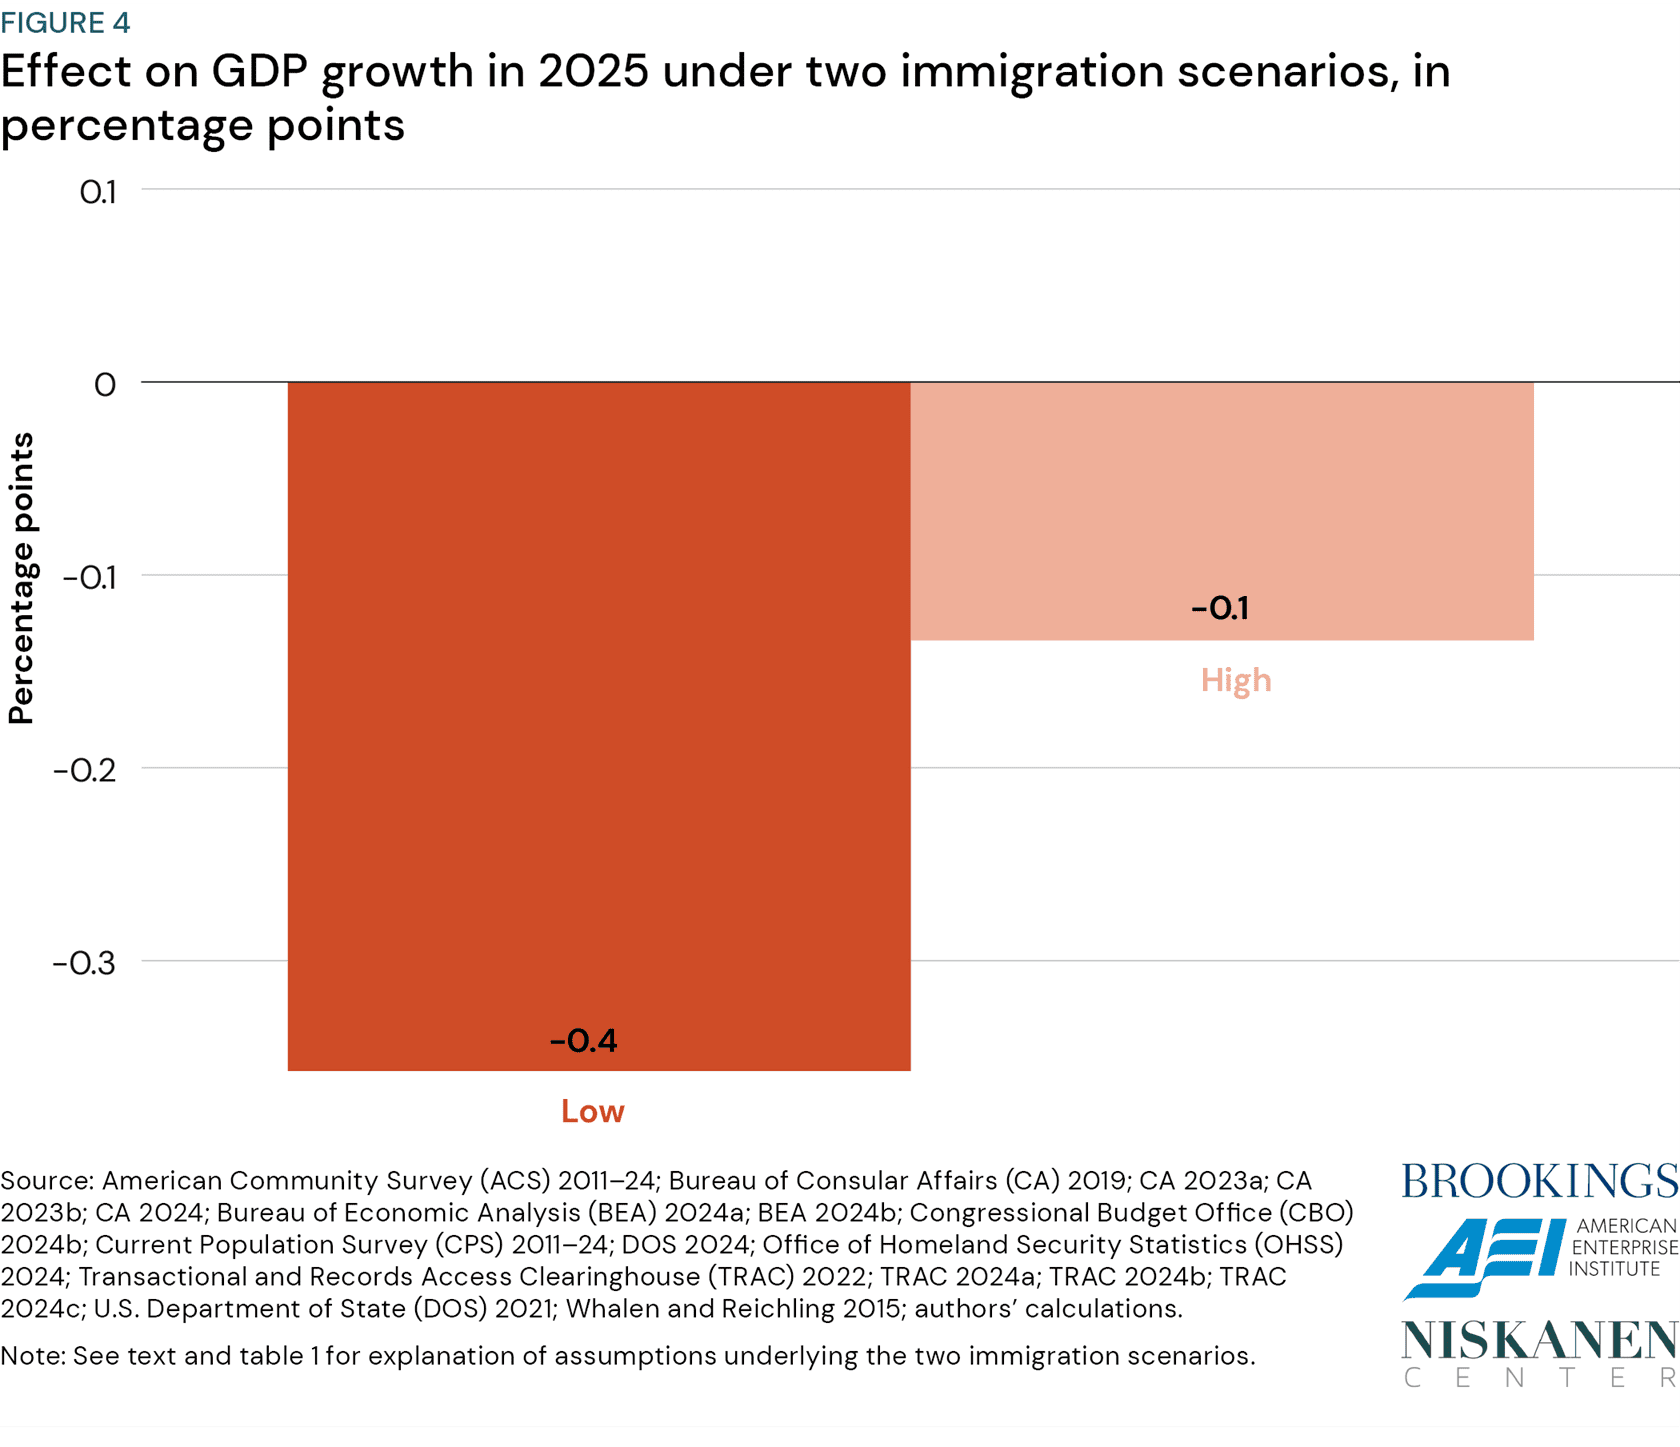
"Immigration and the macroeconomy in the second Trump administration"
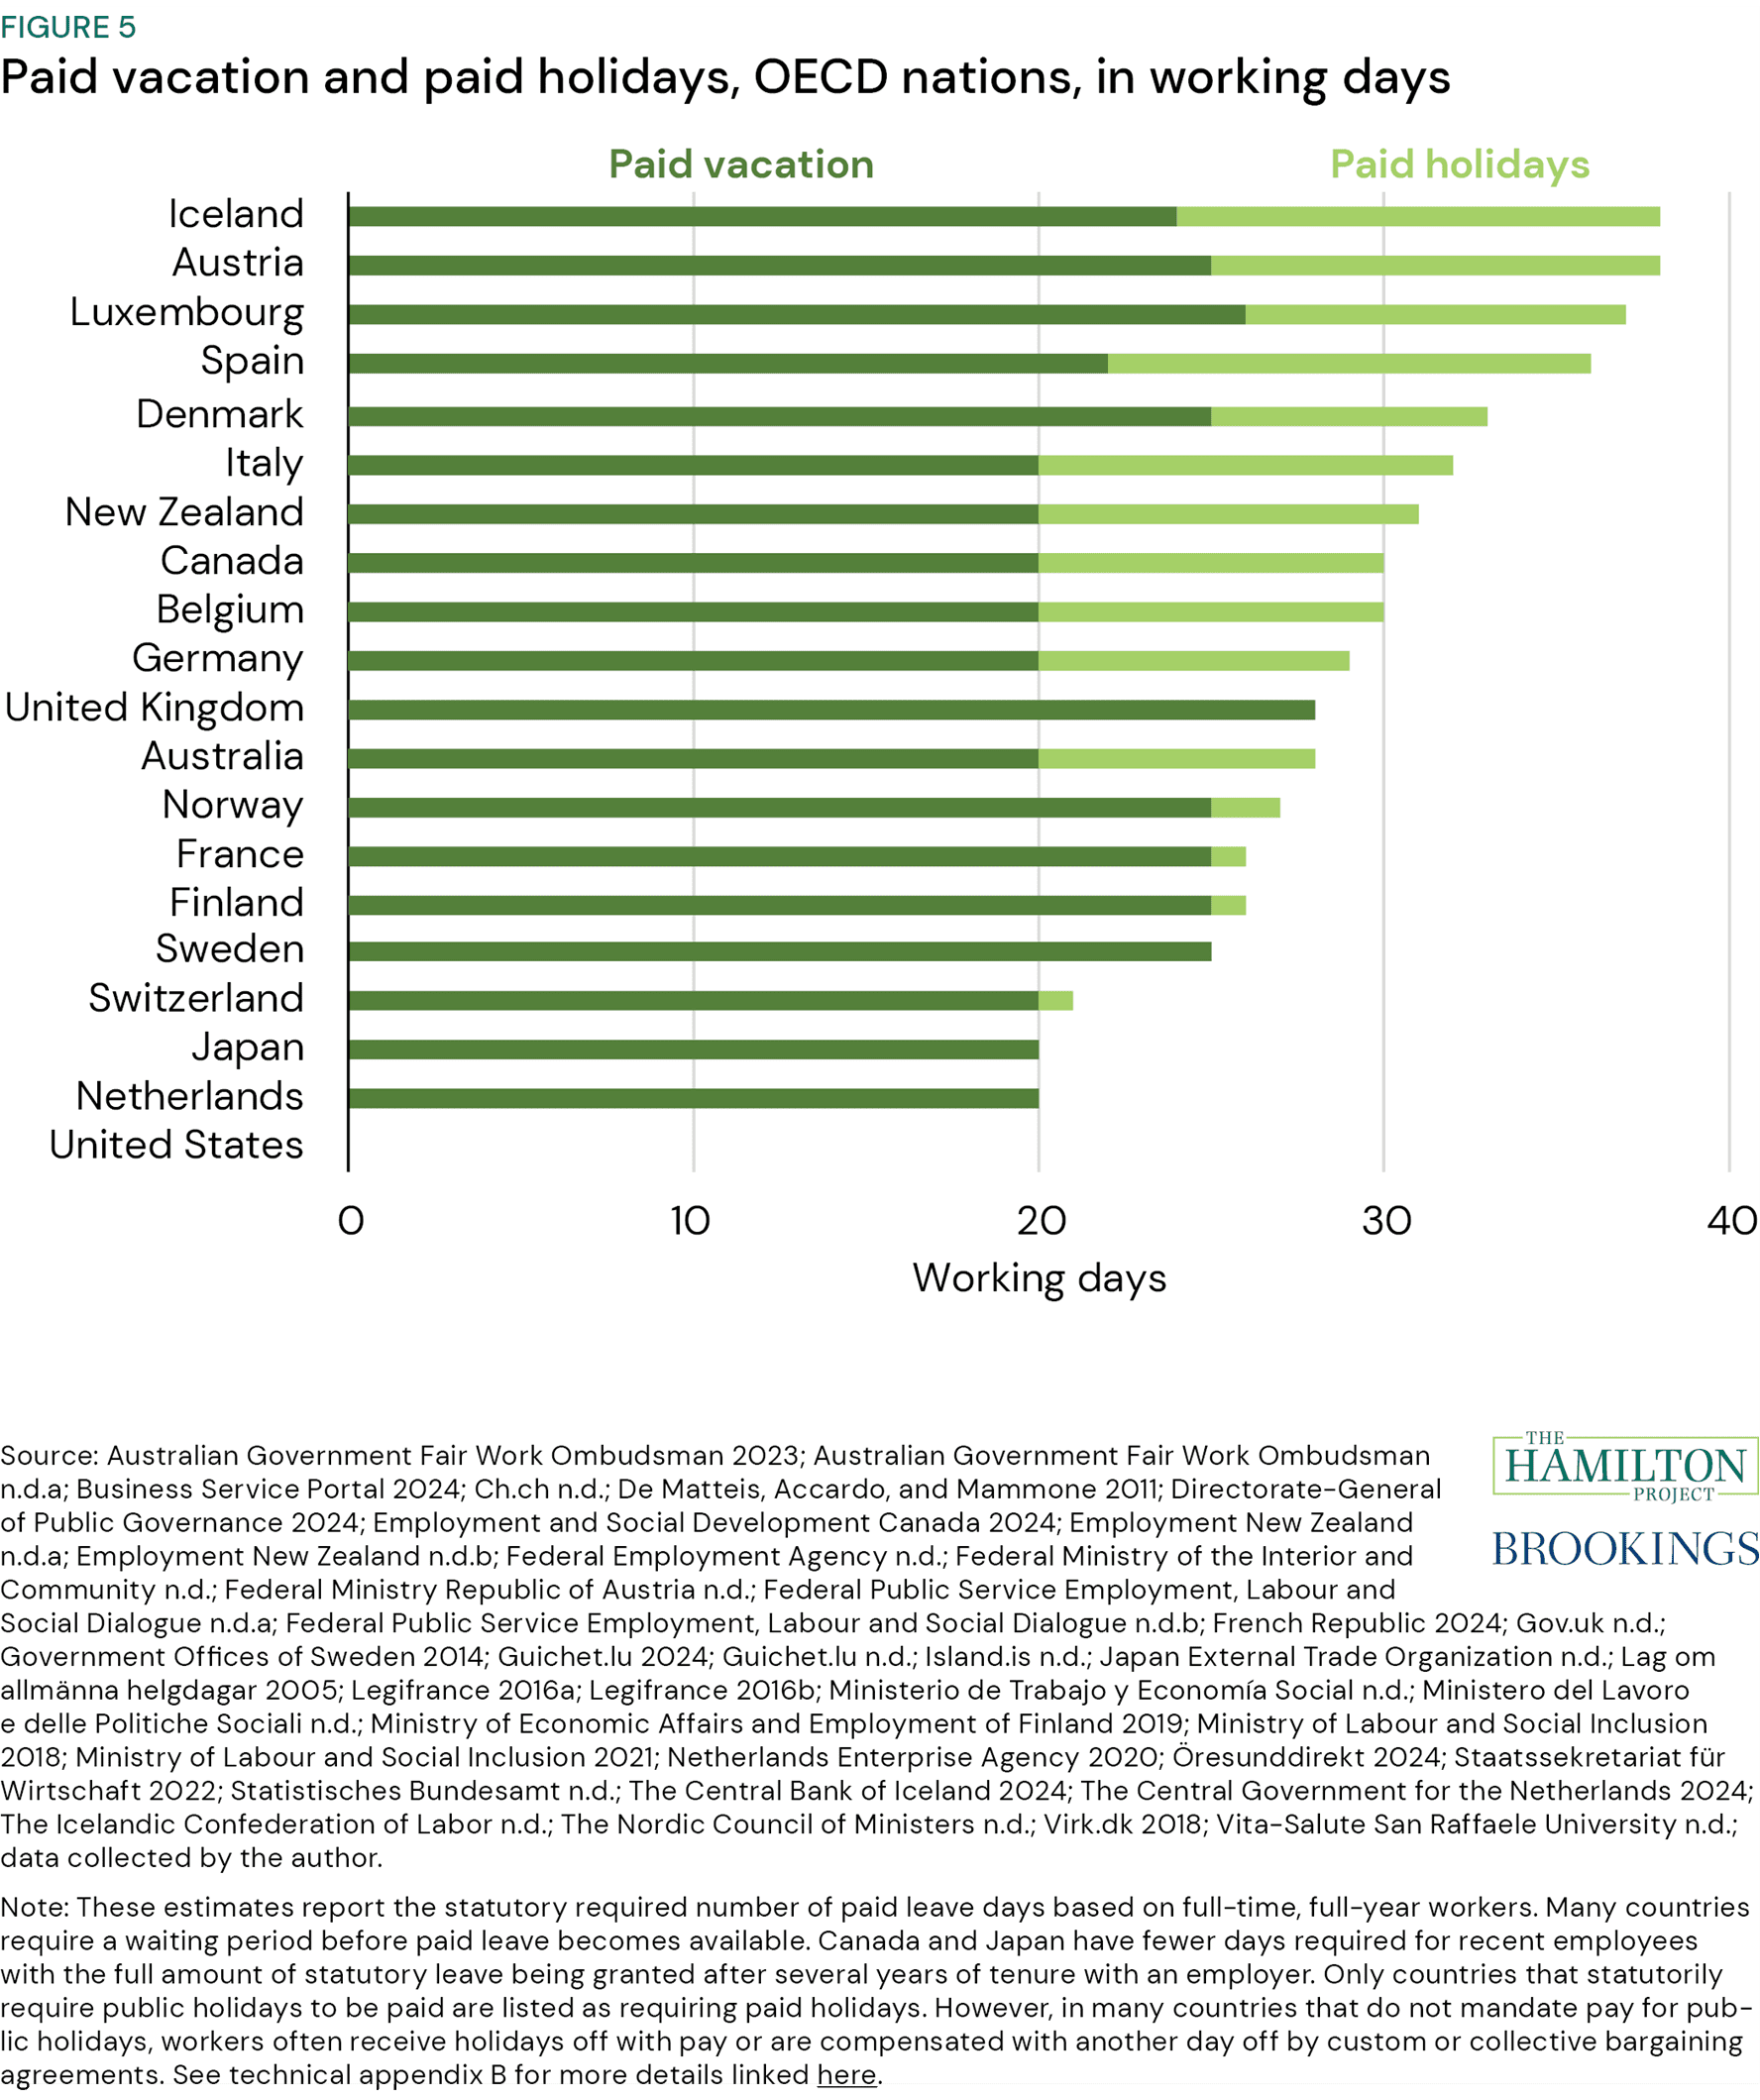
"A federal guarantee for earned paid time off"
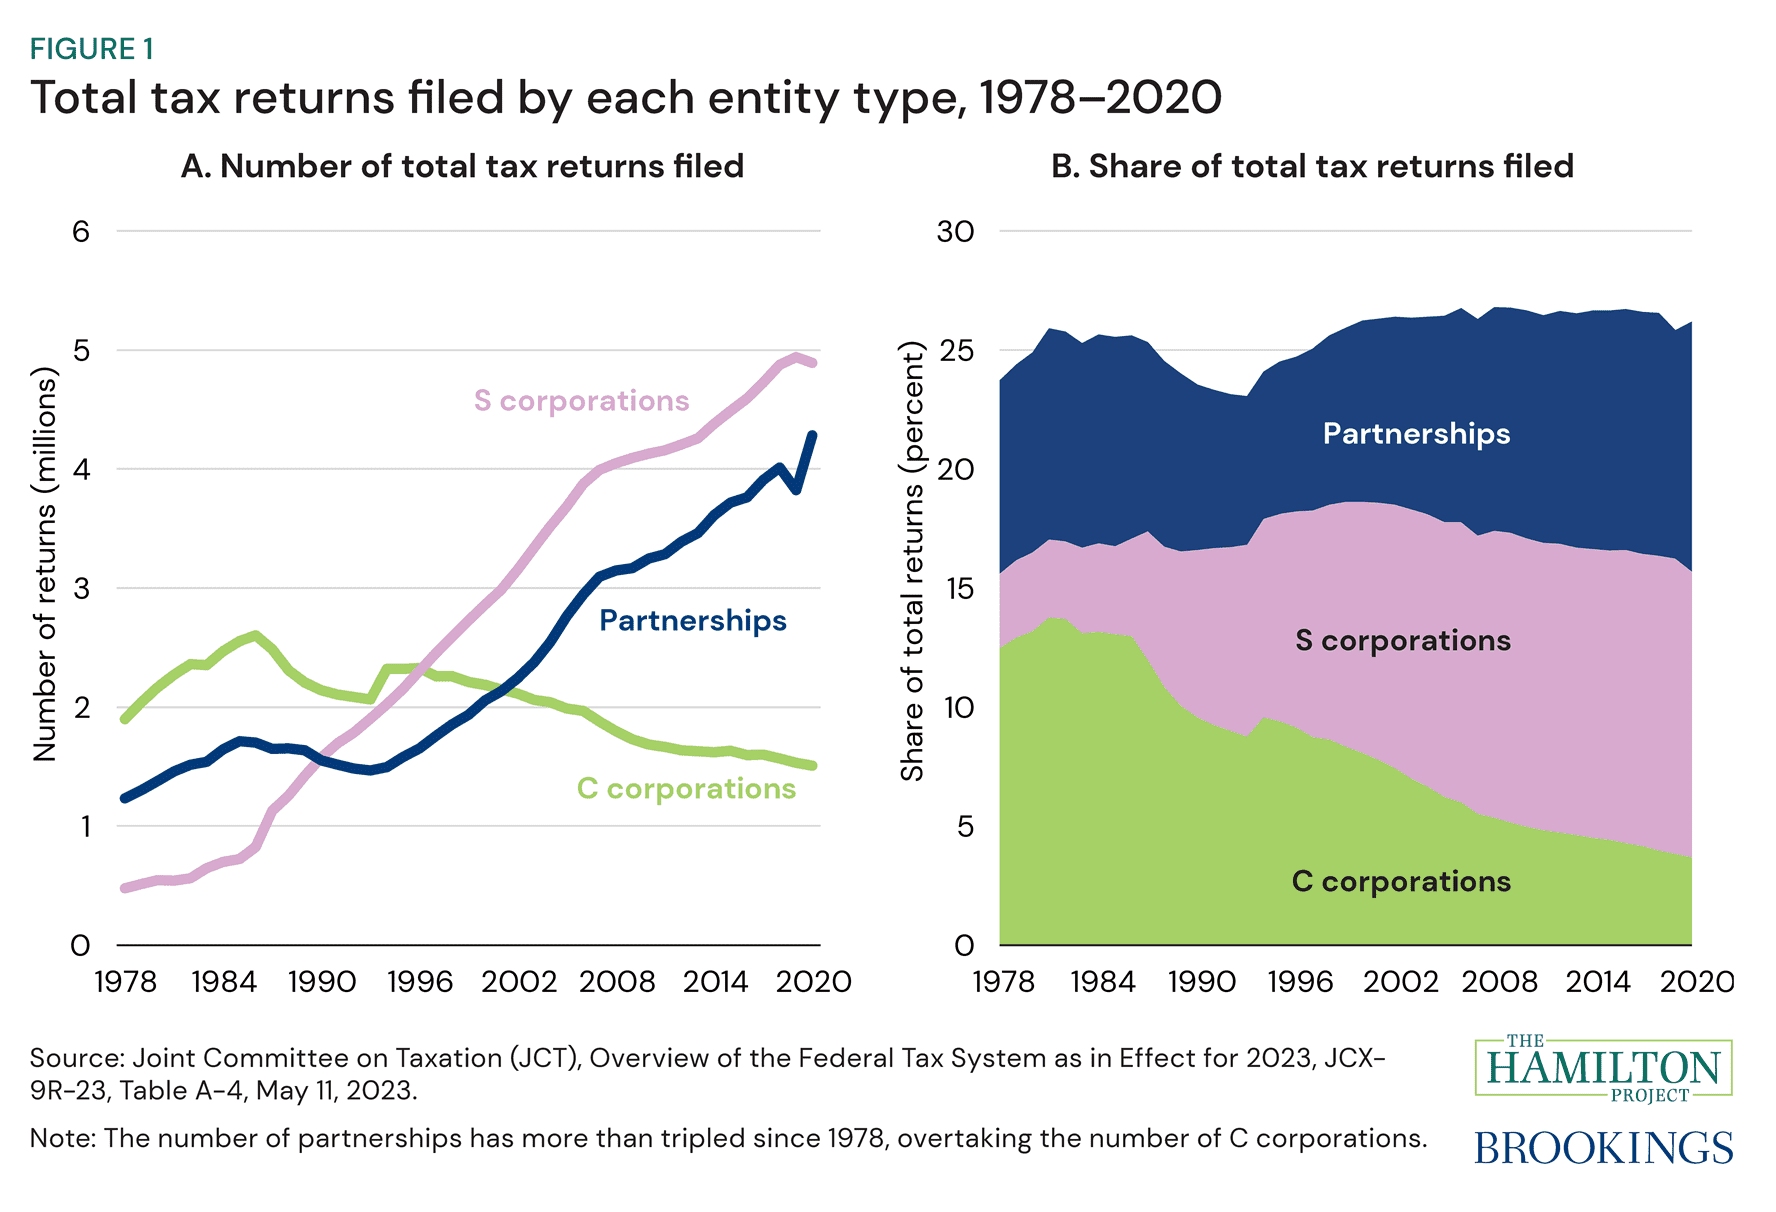
"Modernizing partnership taxation"
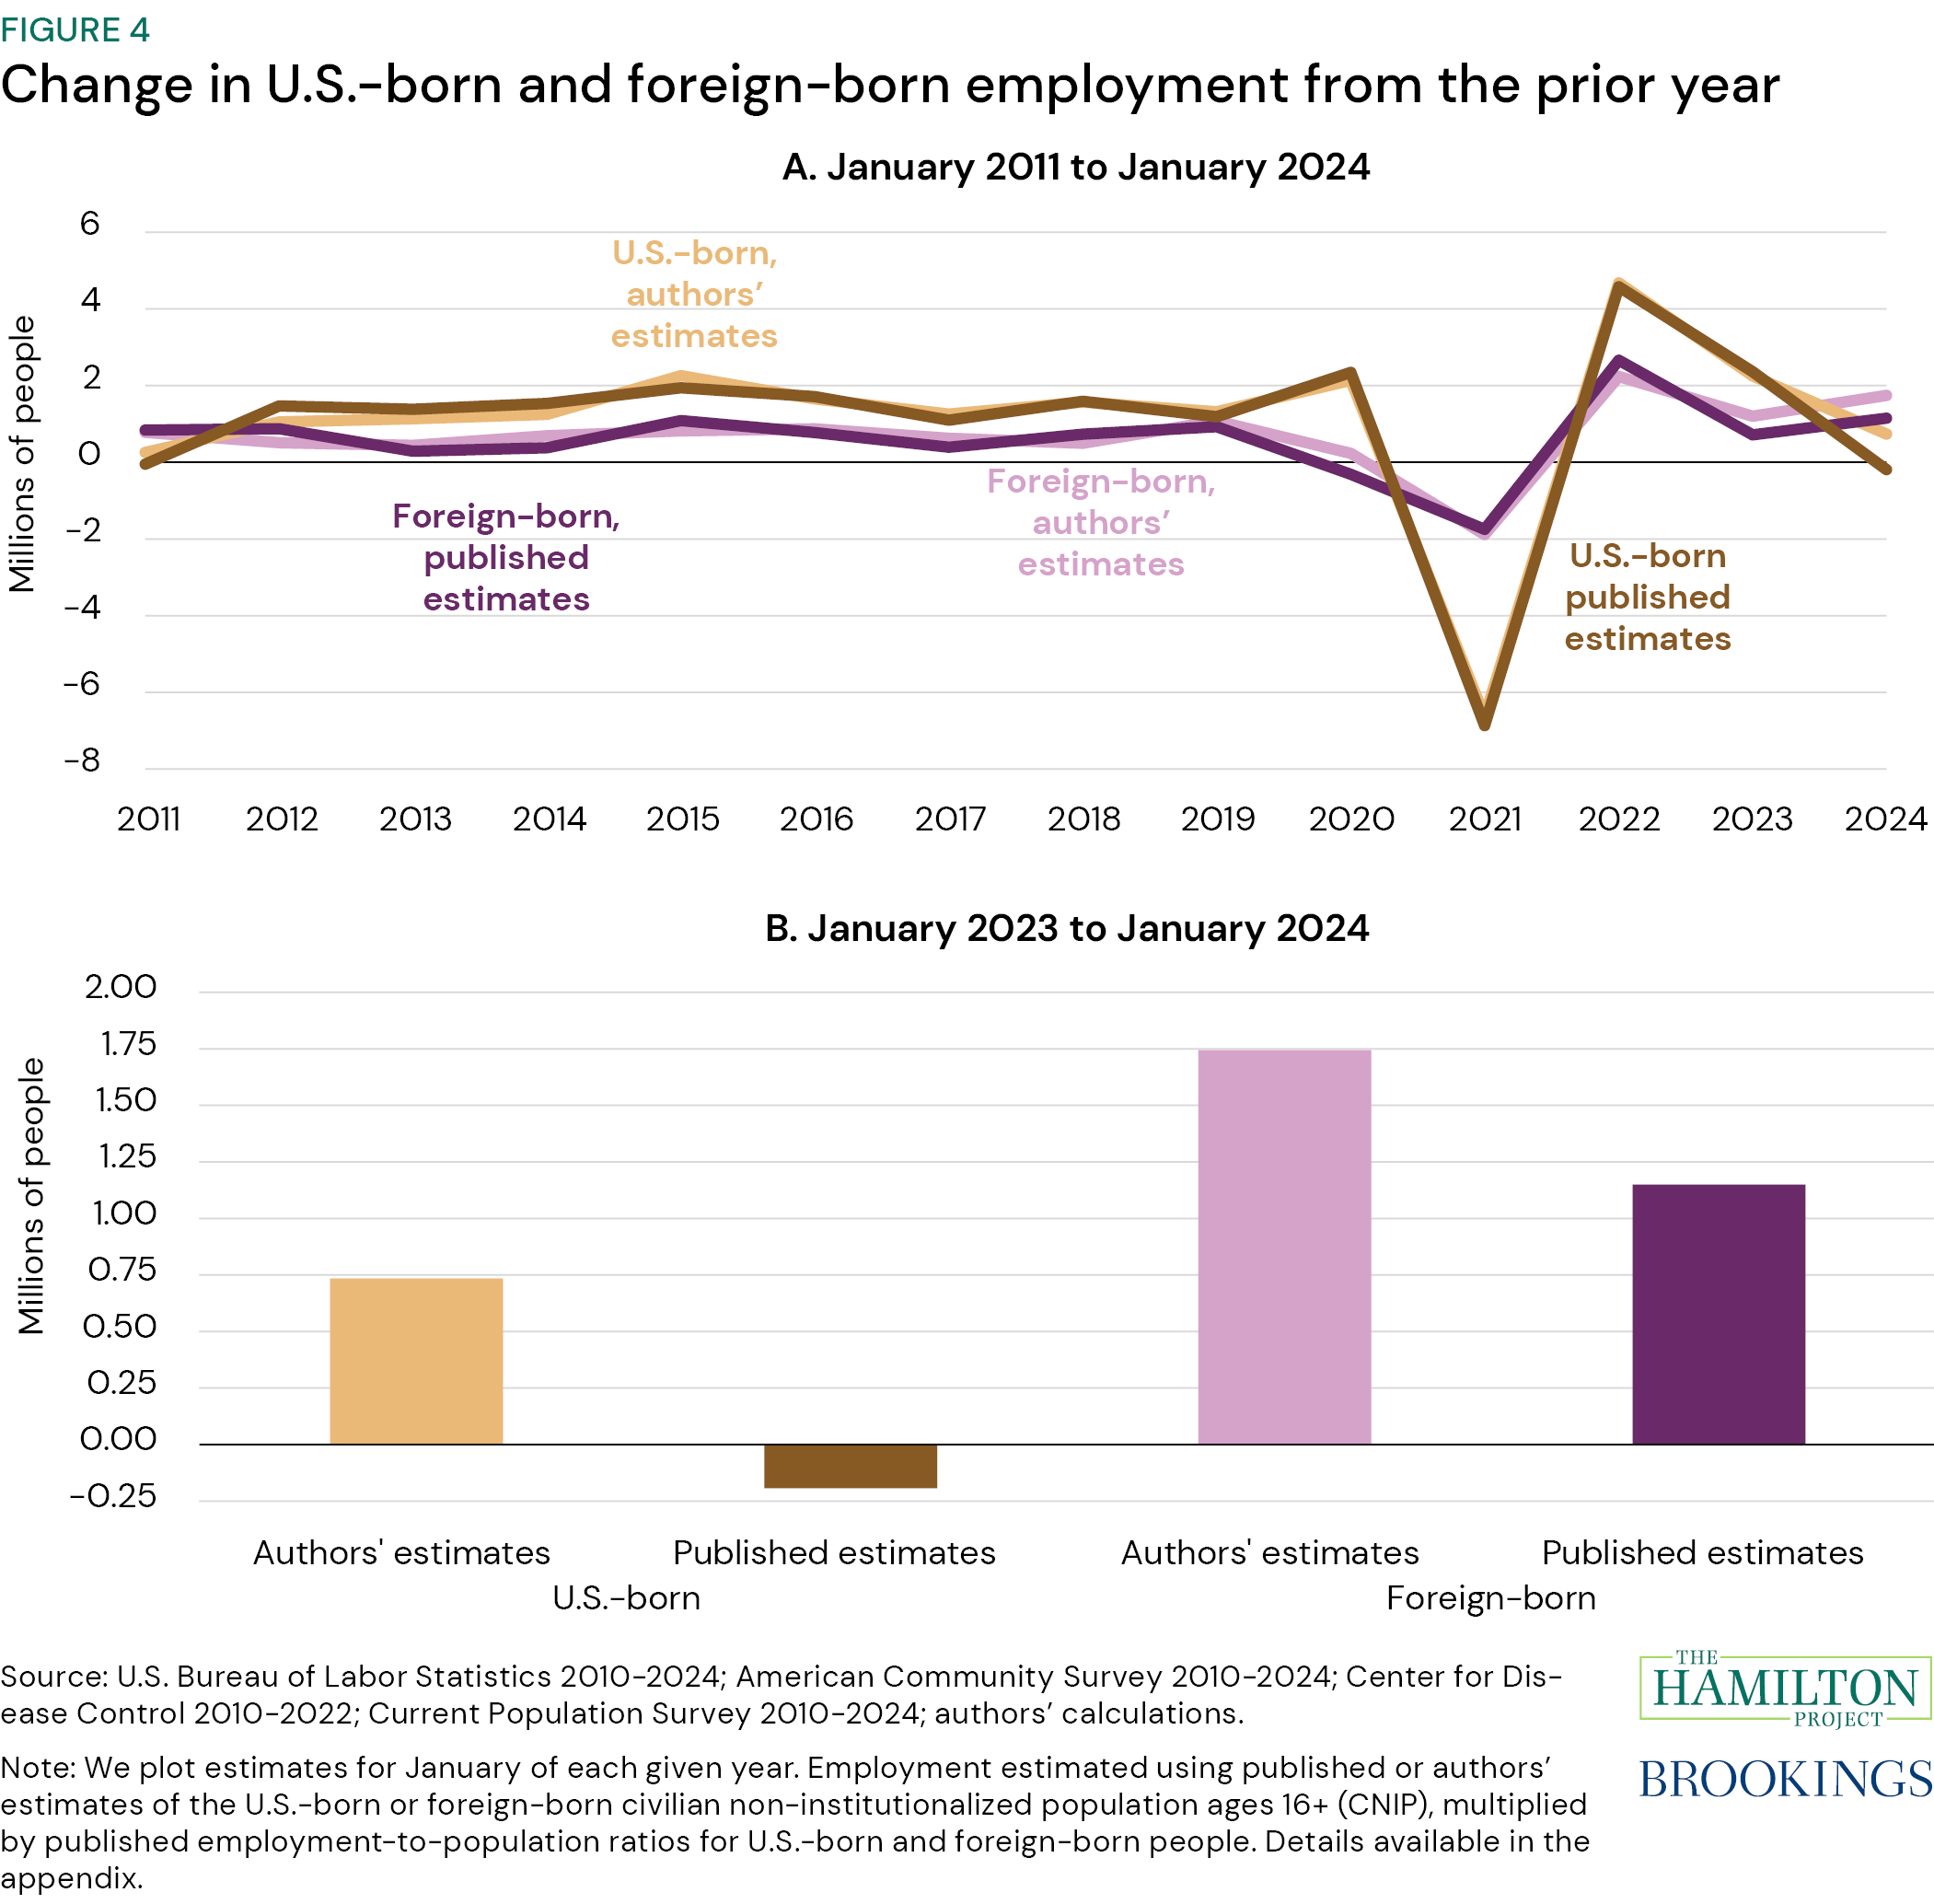
"The strong labor market has boosted US-born employment"
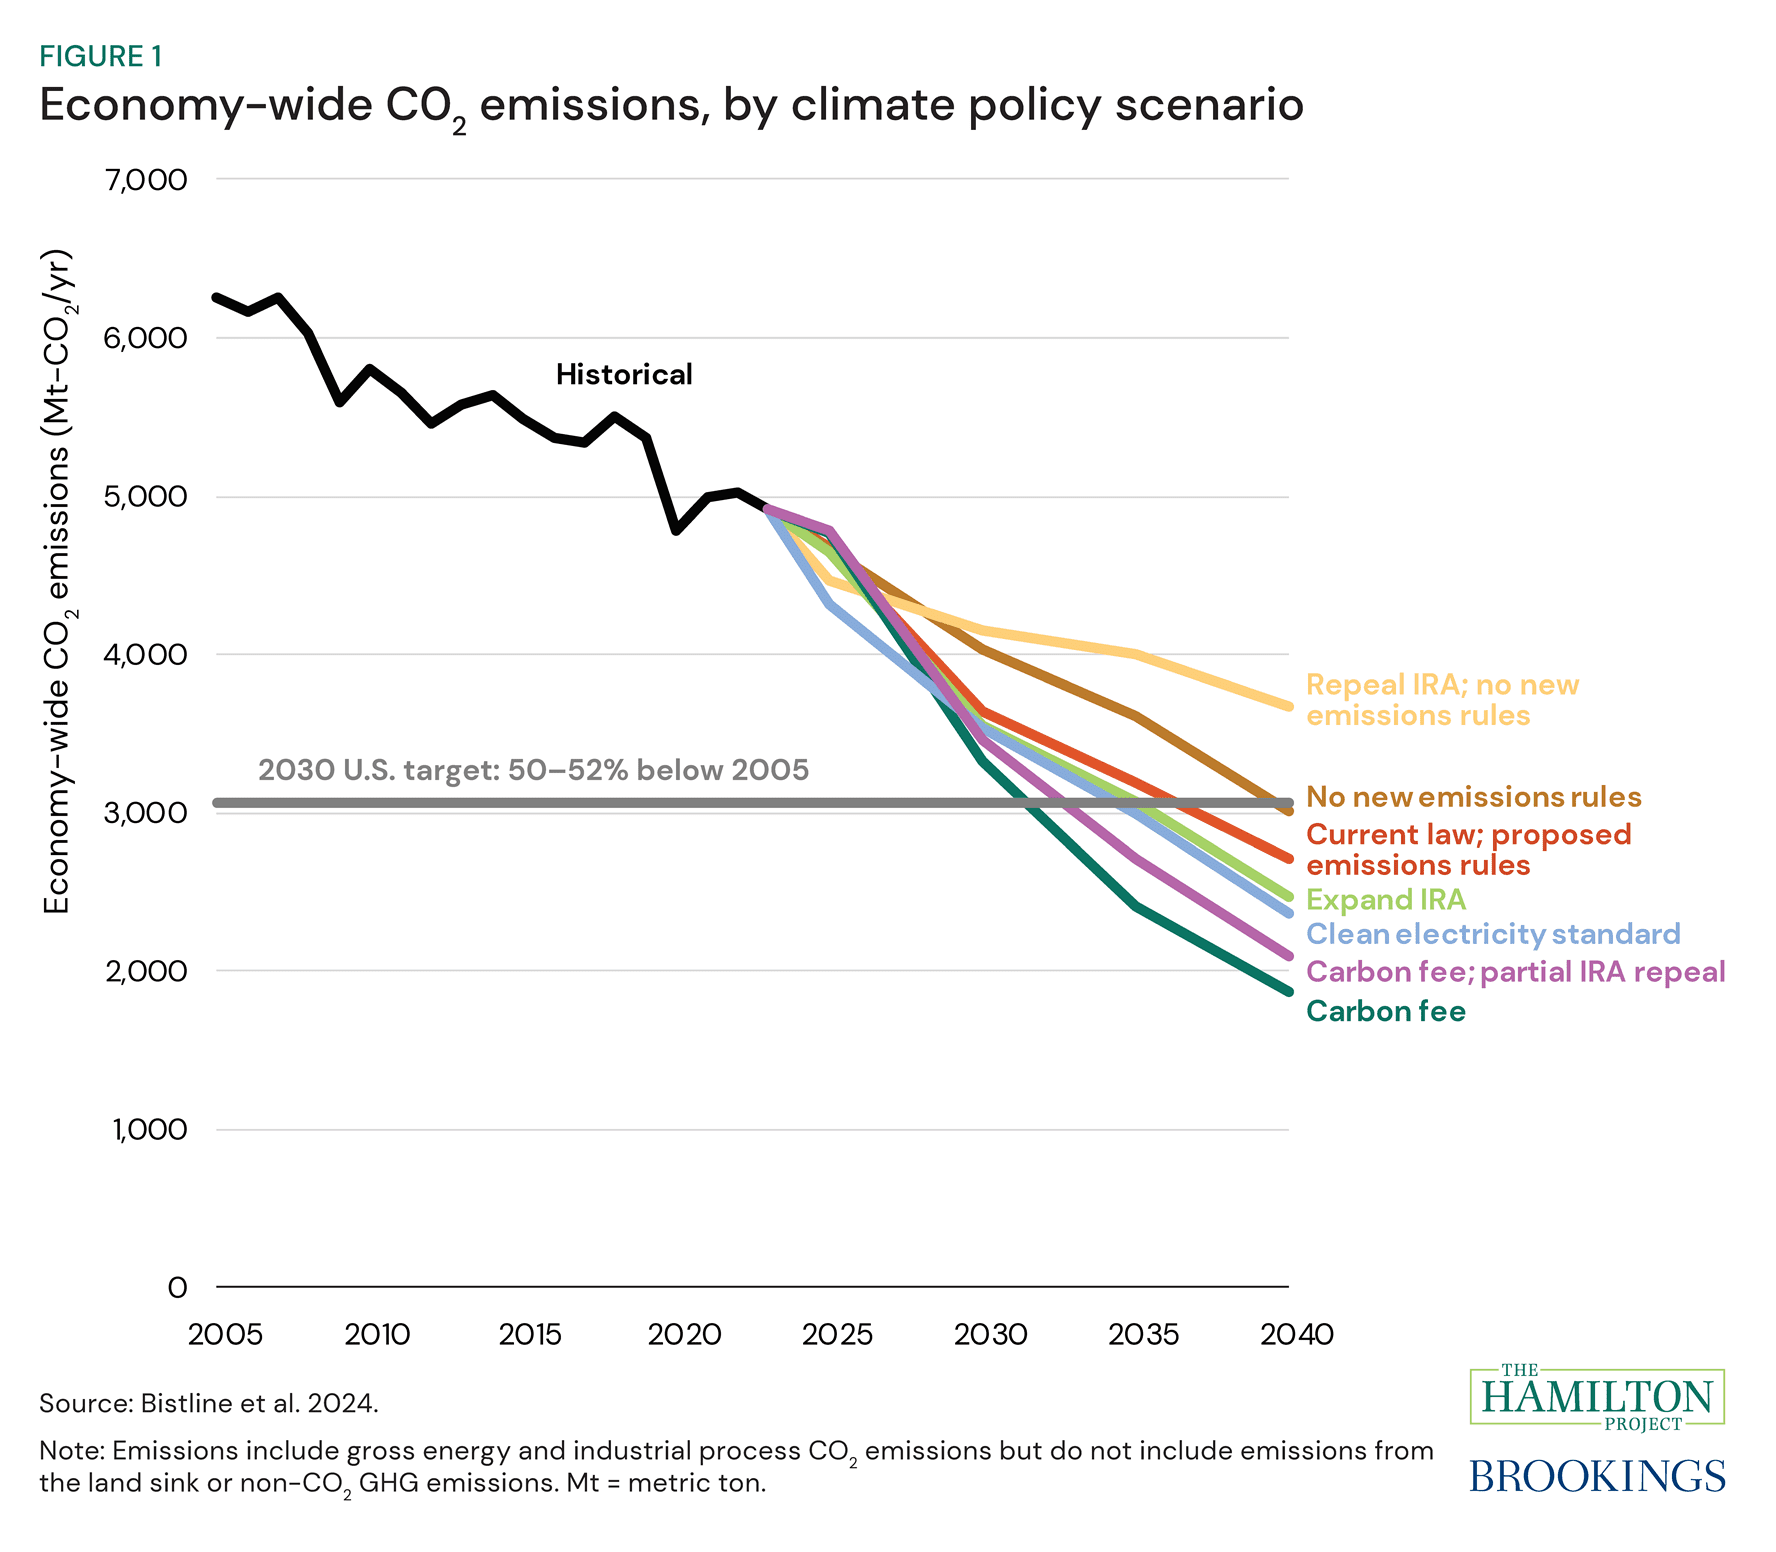
"Climate tax policy reform options in 2025"
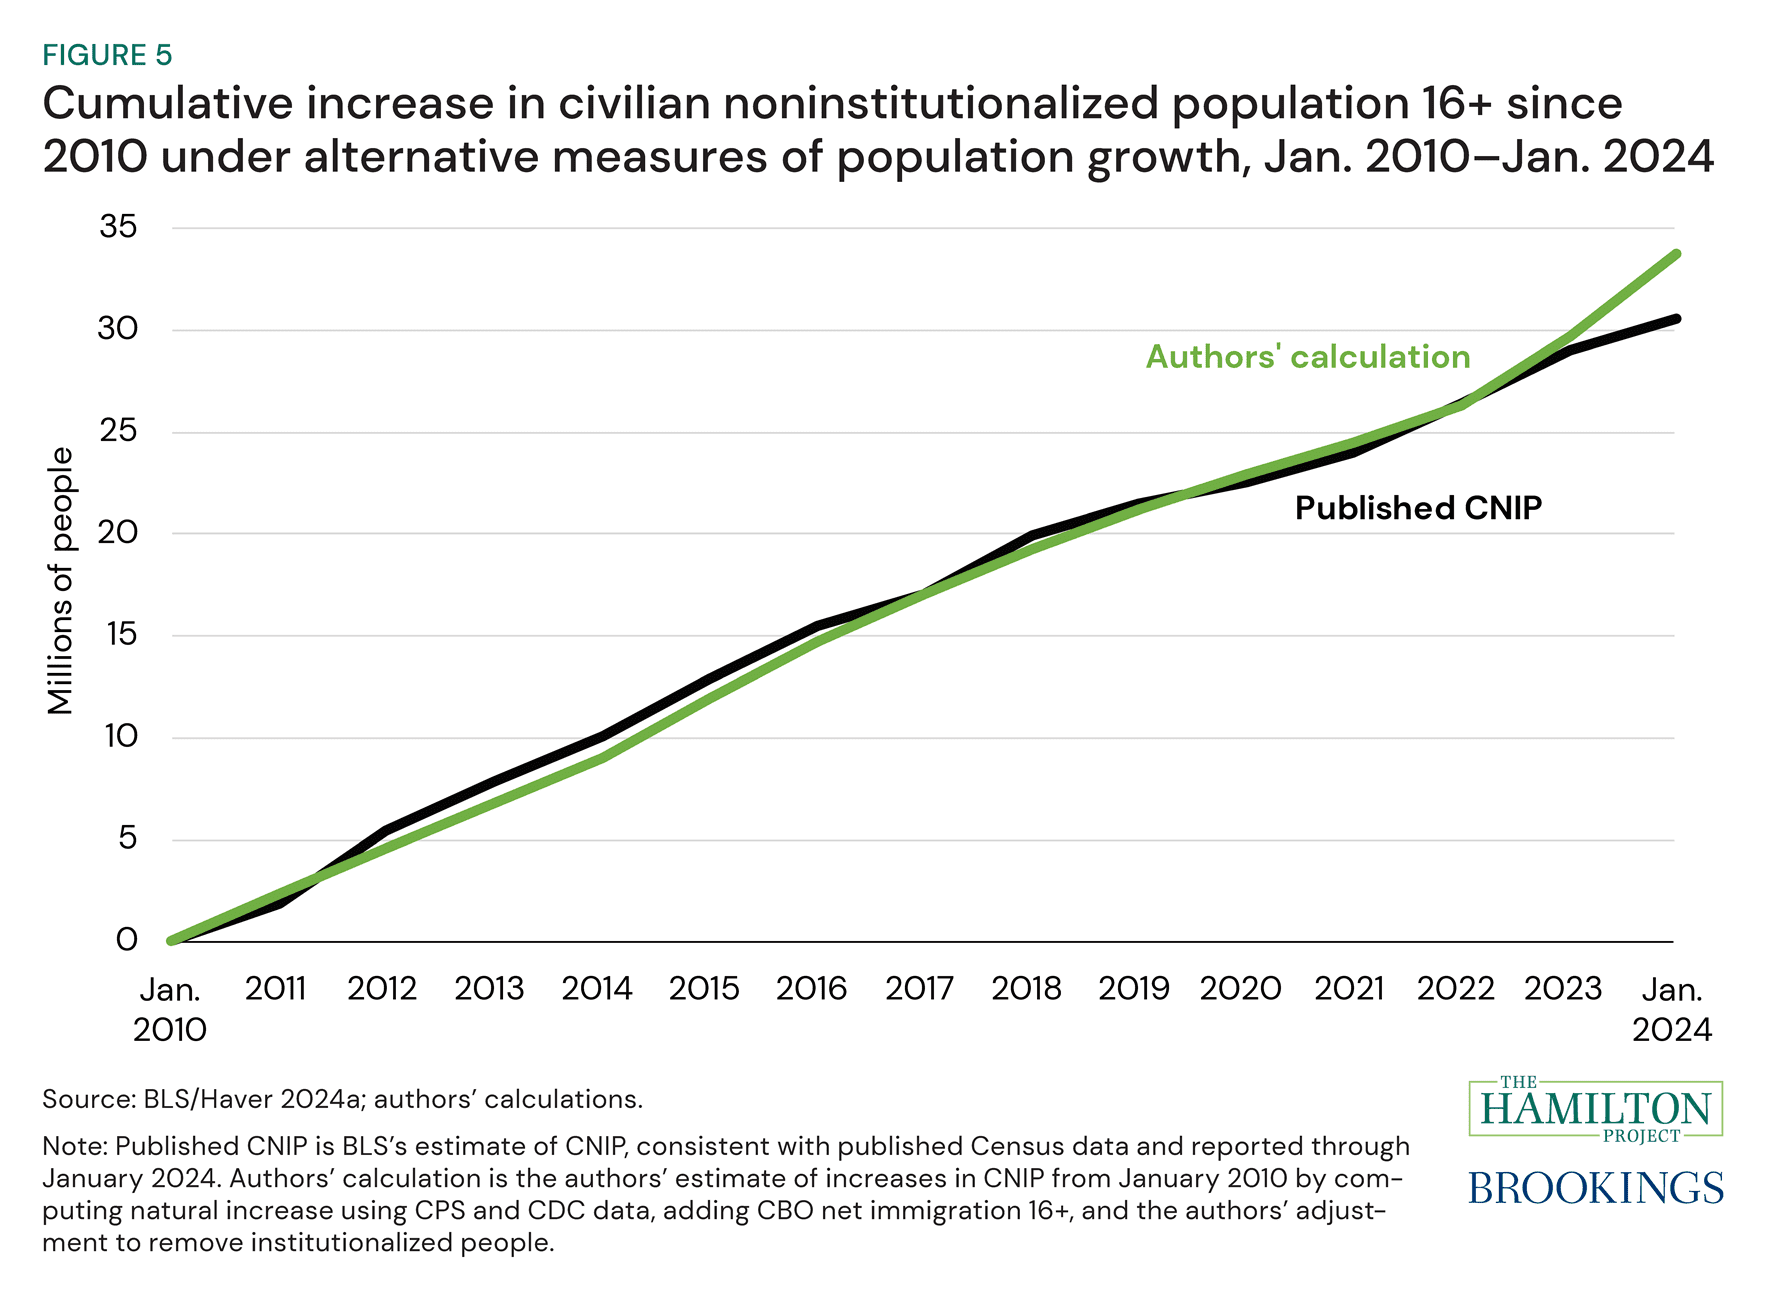
"New immigration estimates help make sense of the pace of employment"
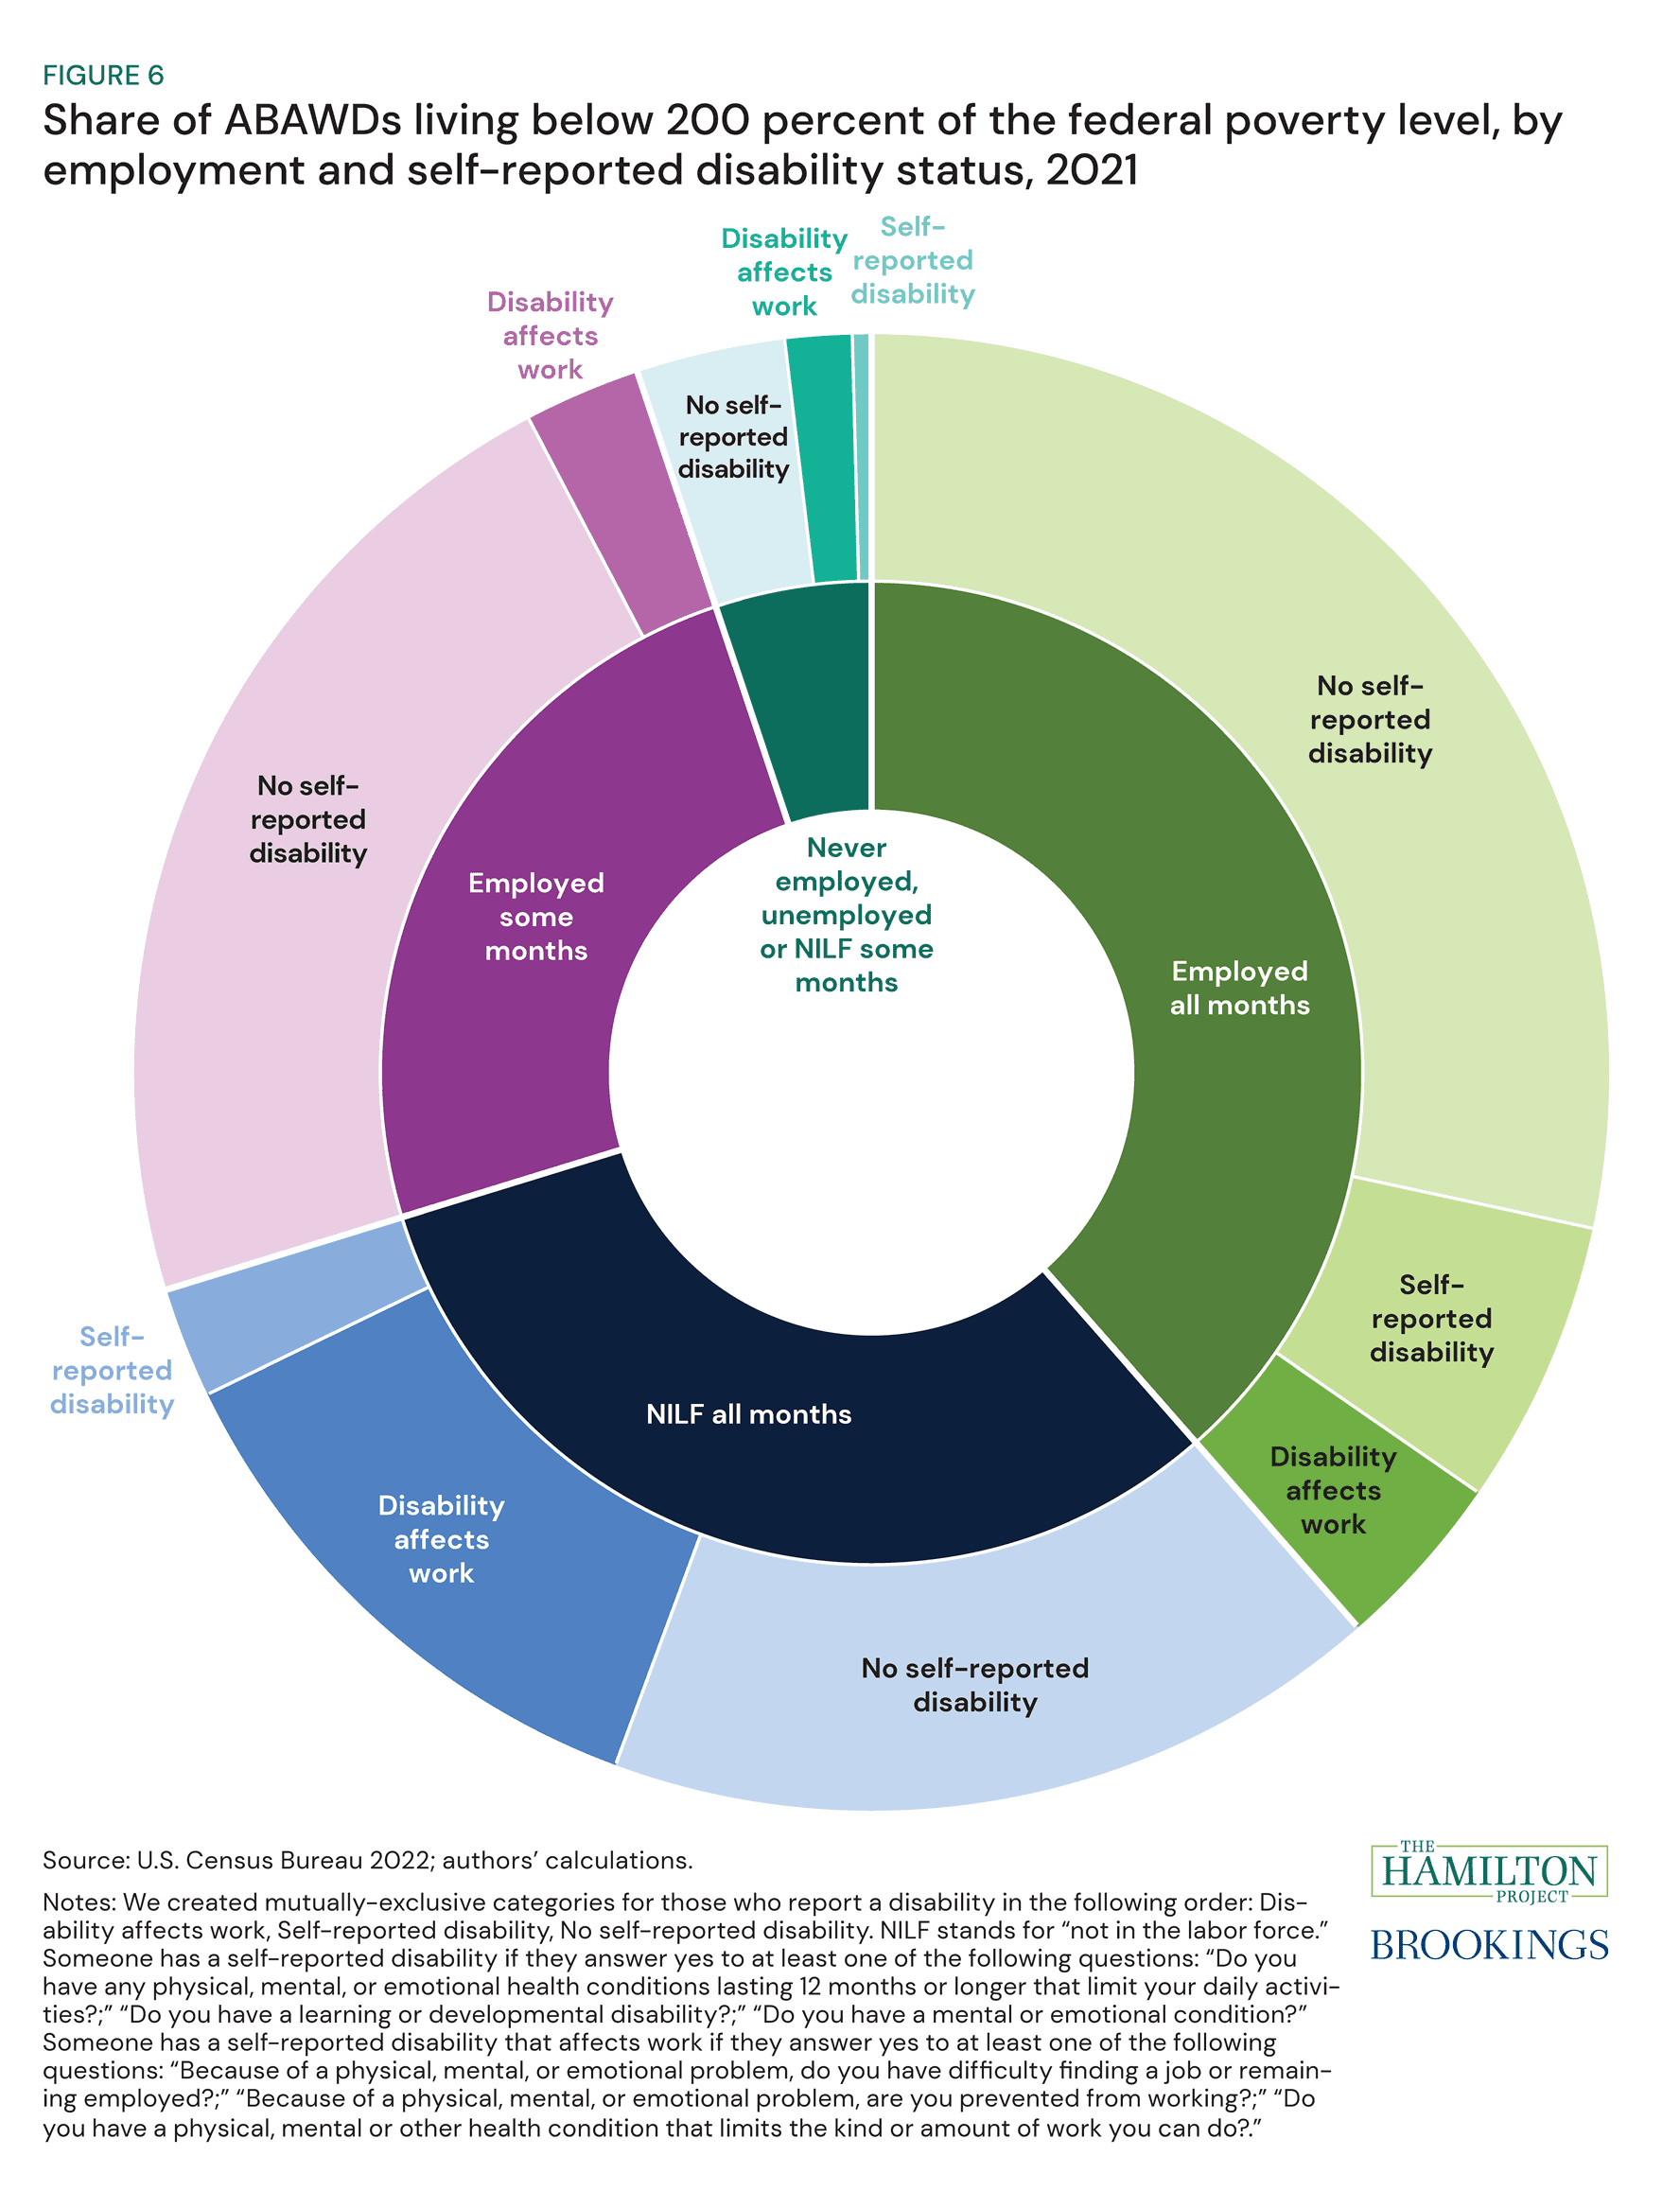
"The safety net should work for working-age adults"
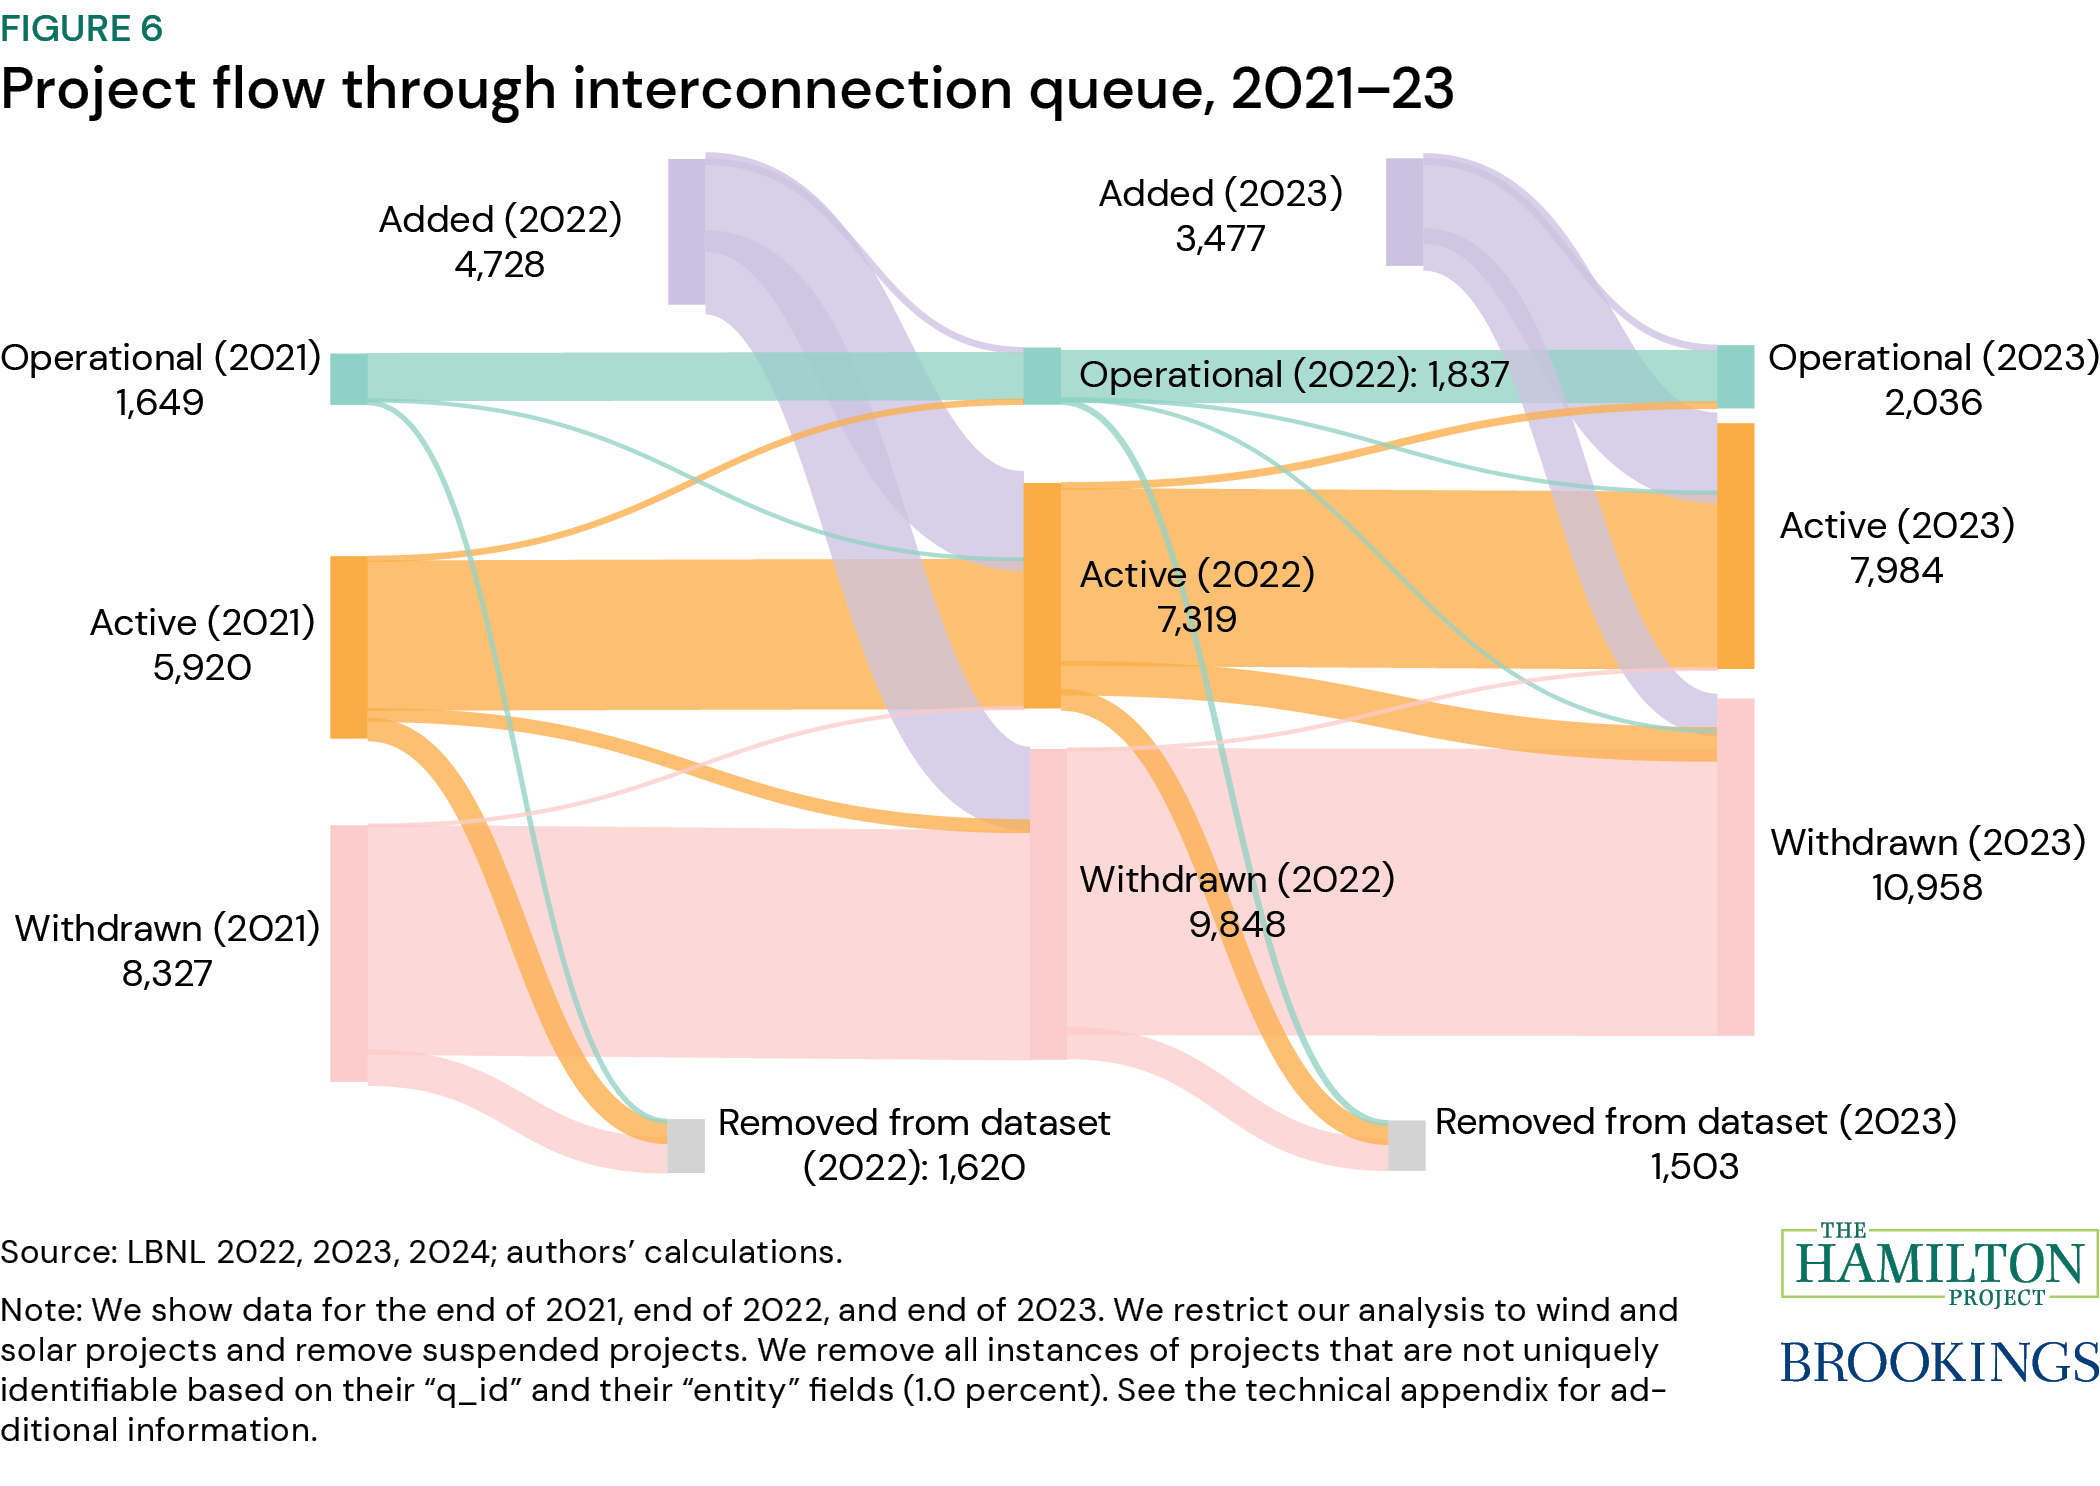
"Eight facts about permitting and the clean energy transition"
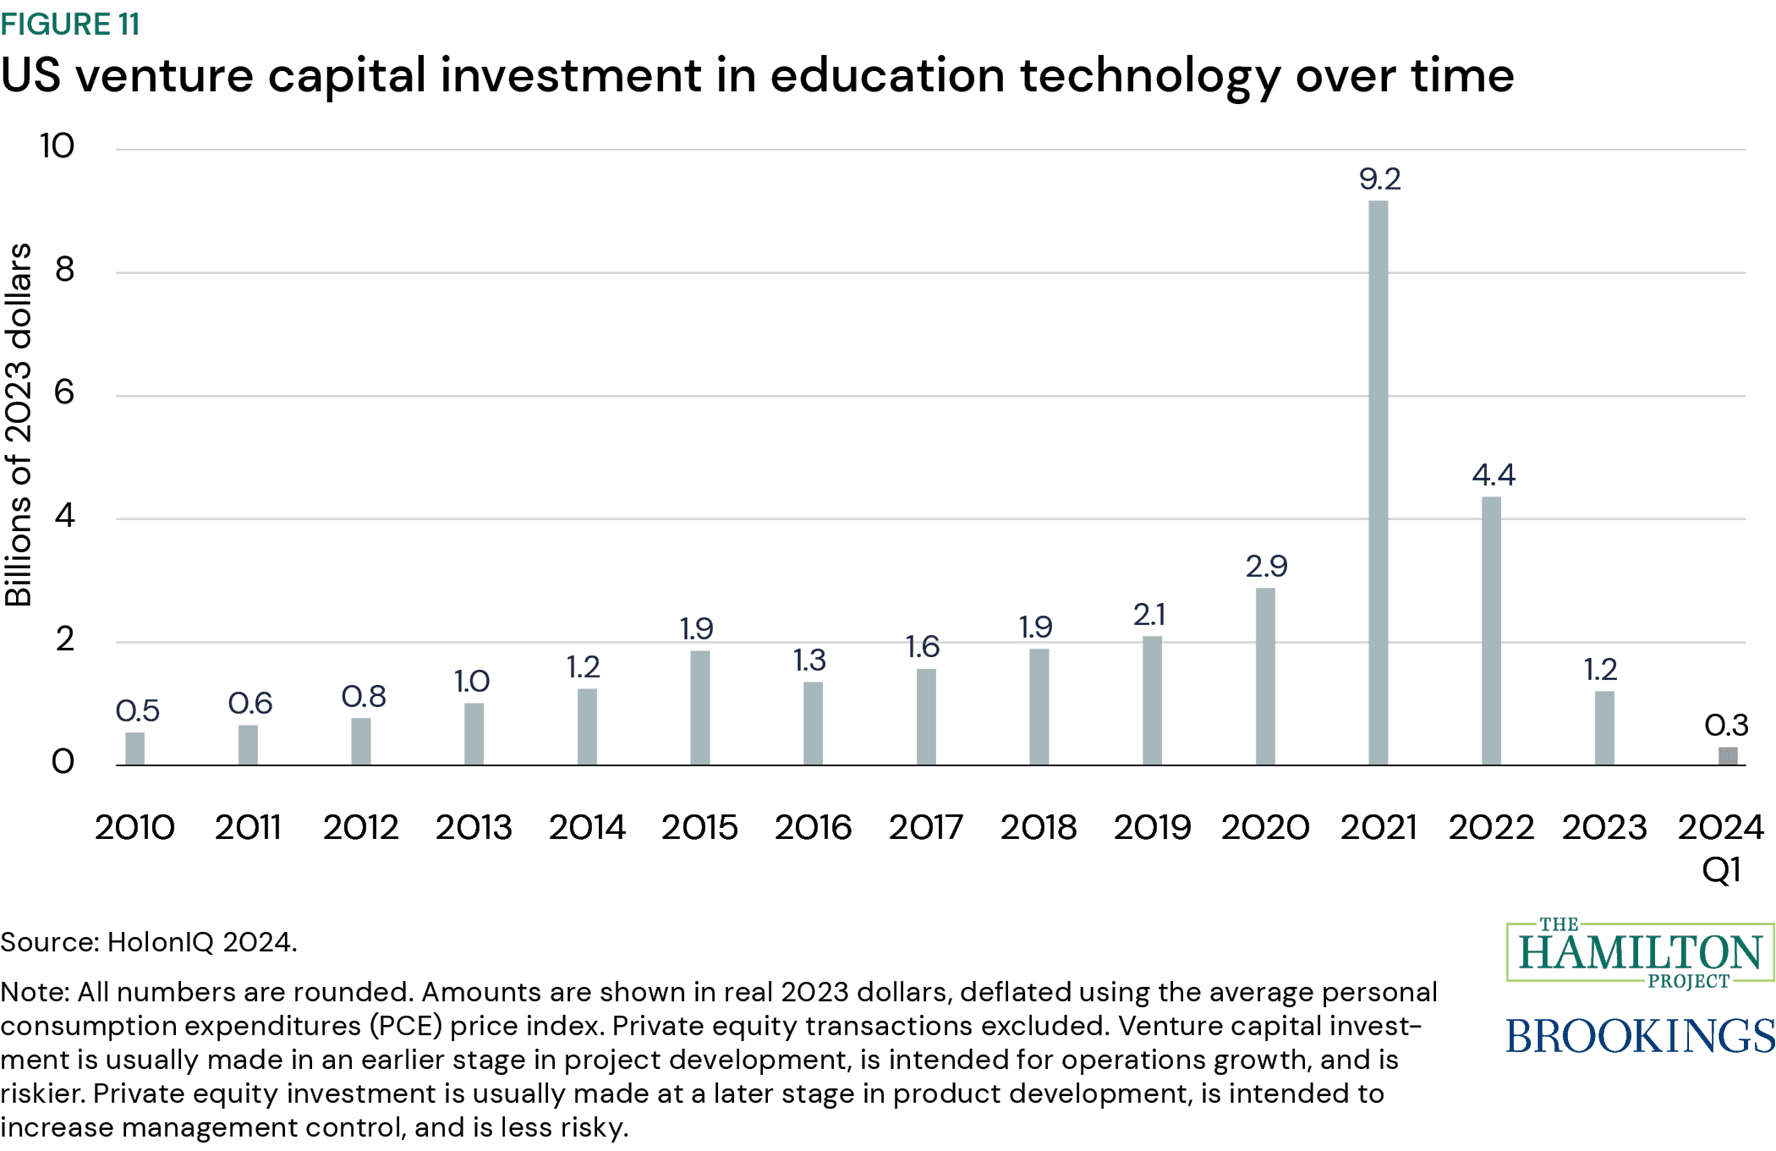
"Twelve facts about the economics of education"
"Prime-age women are still driving the labor market recovery"