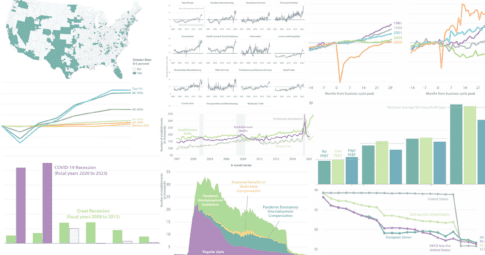
In 2022, The Hamilton Project continued its mission of advancing inclusive economic growth by conducting original research on policy-relevant issues, commissioning policy proposals from leading economic experts, and hosting events that brought together policymakers, academics, and businesspeople. This year, Hamilton Project research evaluated the economic policy response to the pandemic and its effects on inflation, labor market conditions in both the goods and service sectors, social insurance programs including the Child Tax Credit, and more. This review highlights 12 key data visualizations produced by The Hamilton Project that capture the spirit of its work in 2022.
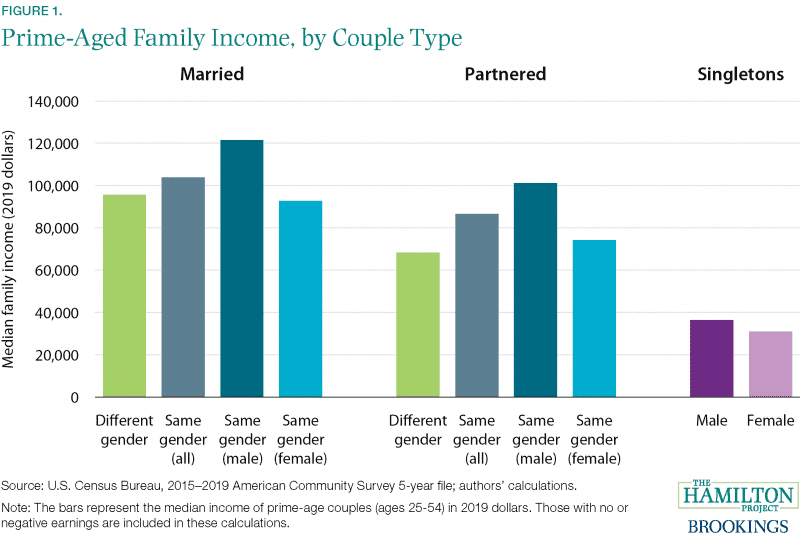
January: Women in same-gender relationships earn less than men in same-gender couples.
To begin the year, The Hamilton Project analyzed the first Census Bureau data that can identify same-gender relationship households in the U.S. Taking a deep dive into the median incomes of same-gender families, the analysis found that overall, same-gender couples earn more than opposite-gender couples—but the numbers for male and female couples are quite different, with female same-gender households having a lower median income than their male counterparts.
Related coverage includes “A COVID-19 Labor Force Legacy: The Drop in Dual-Worker Families” by Ryan Nunn and Katherine Lim.
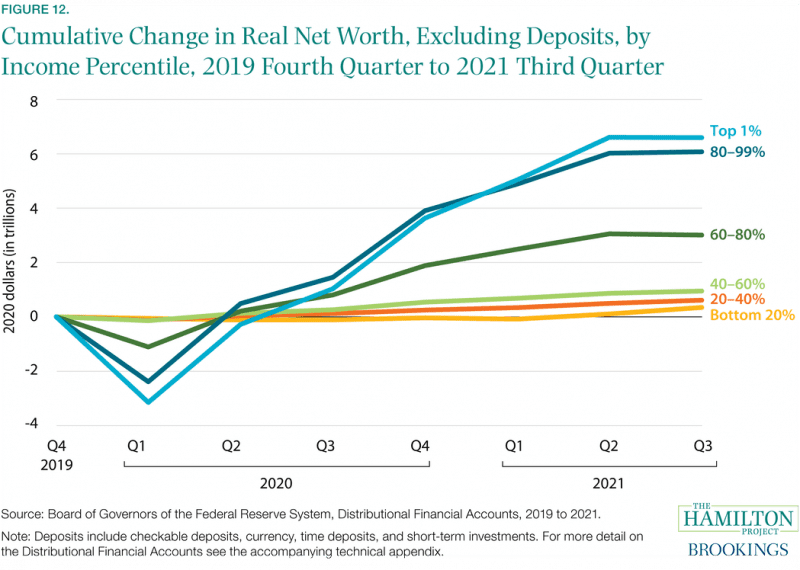
February: Higher-income households have seen the largest gains in net worth after the pandemic.
A Hamilton Project economic analysis of household balance sheets found that, in aggregate, households’ financial positions were remarkably improved in 2021 relative to 2019. The improvements stand in stark contrast to the years following the Great Recession, attesting to the strength of the federal aid that households received and of the economic recovery. But despite households’ overall gains, longstanding inequities have persisted, with households in the highest income bracket experiencing the largest cumulative change in real net worth.
Related work includes “Women, Work, and Families: Recovering from the Pandemic-Induced Recession” by Betsey Stevenson.
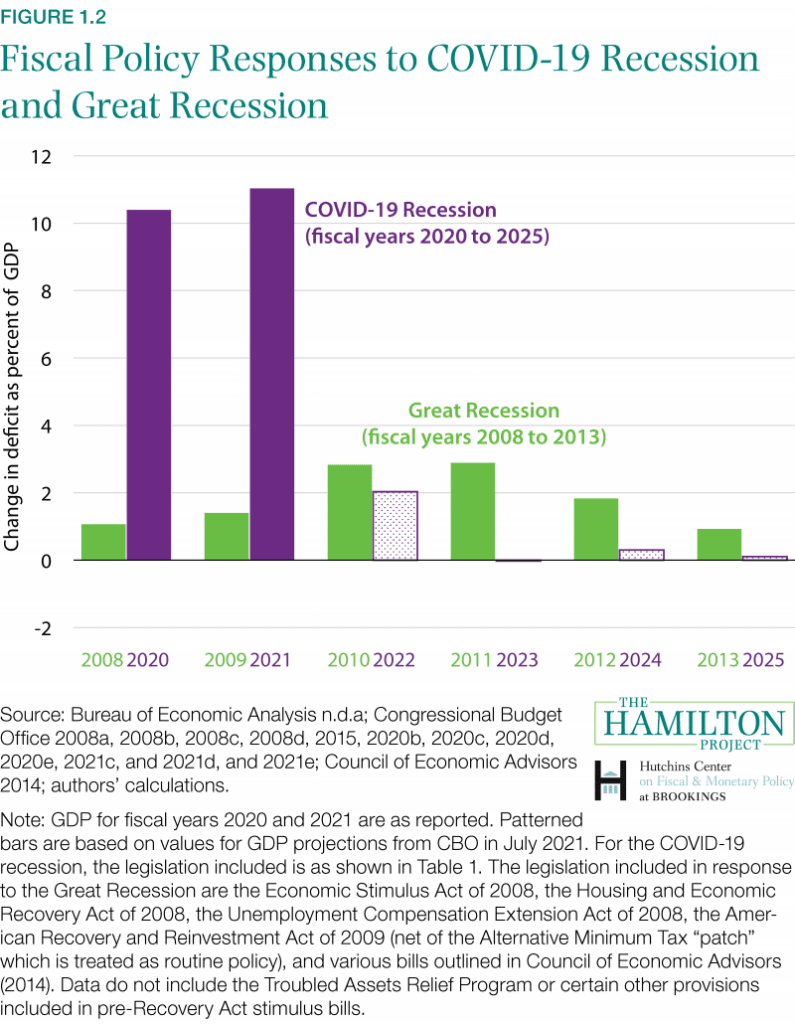
March: COVID-19 holds lessons for the next recession.
This spring, The Hamilton Project and the Hutchins Center on Fiscal and Monetary Policy published Recession Remedies, a policy book evaluating the breadth of the economic policy response to the pandemic. The recovery from COVID-19’s economic downturn was faster and stronger than expected, due in part to the swift and sustained response of fiscal and monetary policy. Recession Remedies investigates the lessons learned from the pandemic response, identifying the policies that are worth repeating in future recessions.
Find the full Recession Remedies policy book here, and check out “A Closer Look at a Hot Labor Market” for an updated look at job openings and hires in the United States.
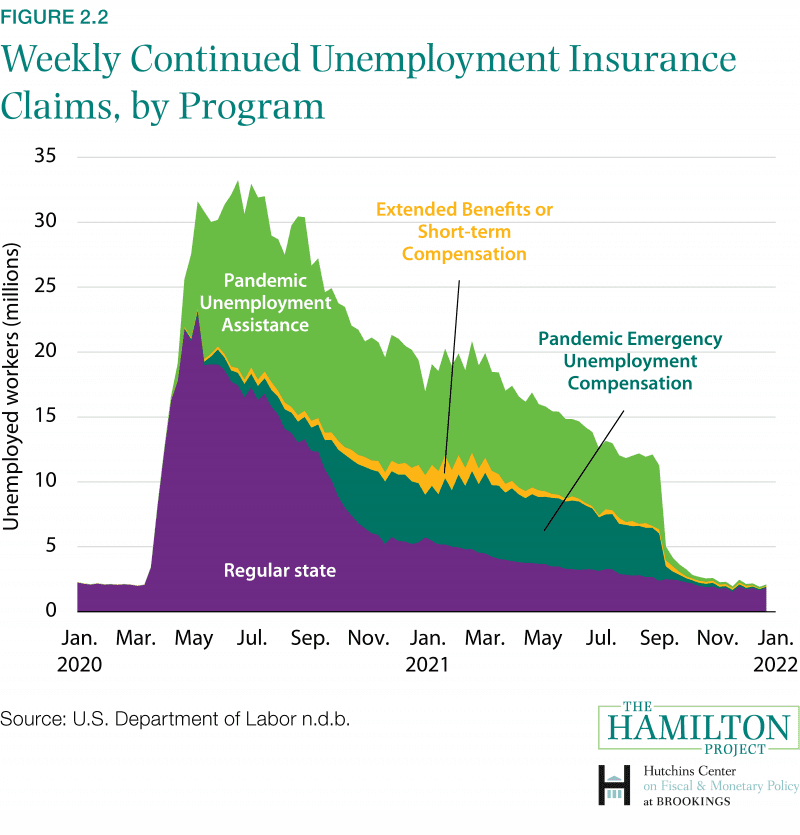
April: During the pandemic, the U.S. expanded unemployment insurance.
In the second chapter of Recession Remedies, the authors review the expansion of Unemployment Insurance (UI) during COVID-19. UI expansions more than offset income losses and boosted consumption, but rapid changes brought a host of administrative challenges. Regular unemployment claims surged at the start of the pandemic, with Pandemic Emergency Unemployment Compensation claims increasing steadily to extend the number of weeks of coverage as workers faced longer-term unemployment.
Related work includes Chapter 3 of Recession Remedies, “Lessons Learned from Economic Impact Payments During COVID-19.” Check out the full Recession Remedies policy book for more.
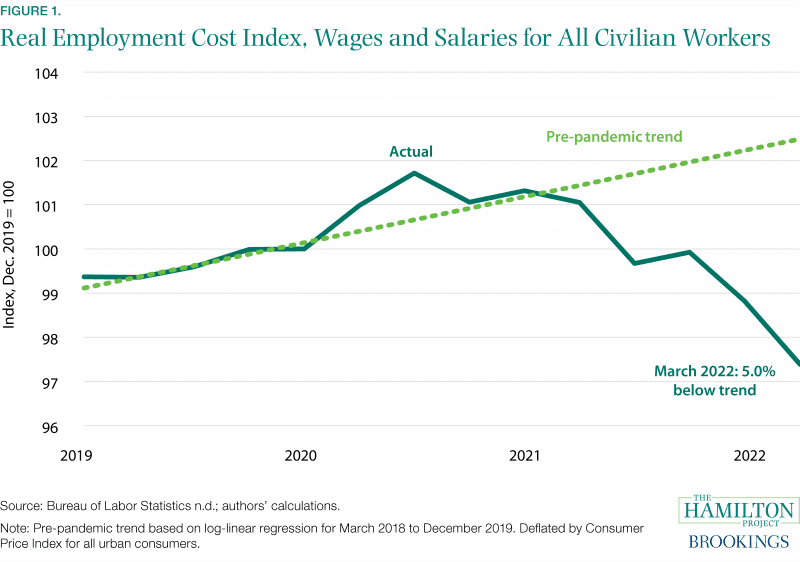
May: Real wages have fallen below trend as inflation continues.
The array of policies implemented since early 2020 to support the economy were largely successful—but the persistent rise in inflation that began in 2021 suggests that consumer demand continues to outpace the capacity of businesses and their global supply chains. In May, The Hamilton Project released “Inflation-Related Updates to Recession Remedies,” evaluating the inflationary consequences of the COVID-19 policy response. The figure below shows the decline in real wages that has accompanied rising inflation.
Related work includes “Recession Remedies in the Face of High Inflation” by Wendy Edelberg.
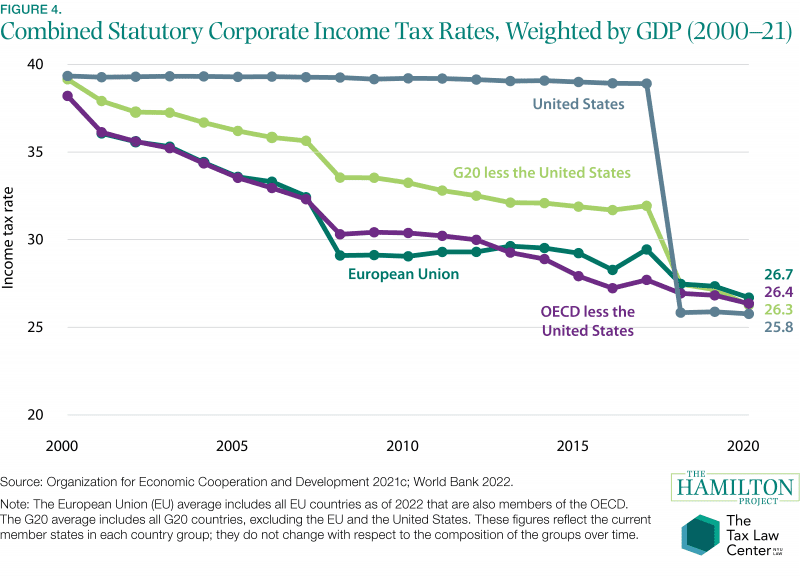
June: Competition between countries has created a race to the bottom in corporate taxes.
In June, The Hamilton Project and the Tax Law Center at NYU Law published a set of six economic facts on goals for reform in the international tax system. Decades of tax competition between countries to attract multinationals’ business has led to declining statutory corporate tax rates, as well as to income untaxed by any country. Possible reforms include a global minimum tax rate of 15 percent, which would eliminate the use of tax havens, the authors write.
The release of the facts document coincided with an event that explored changes to the taxing of international corporate income. Read a recap and watch the recording here. For more on tax policy, check out Tackling the Tax Code: Efficient and Equitable Ways to Raise Revenue.
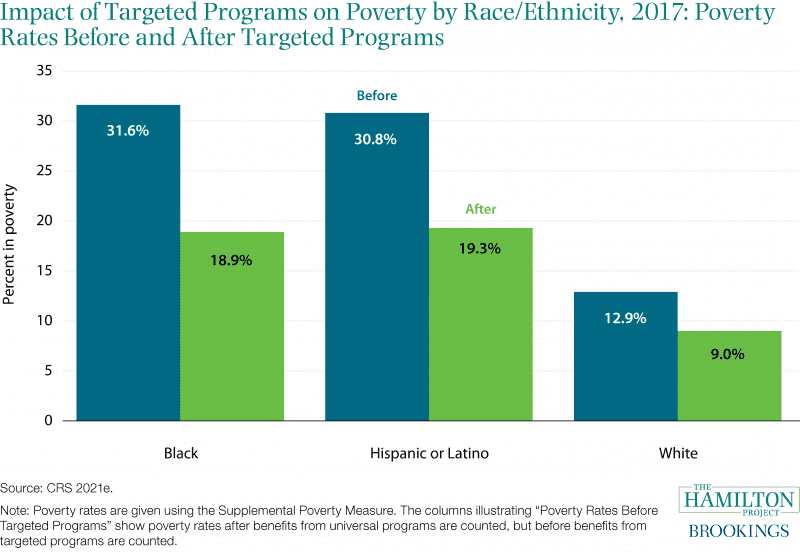
July: Government programs, especially targeted programs, reduce disparities in poverty by race.
A longstanding narrative holds that social programs targeted by income fare poorly politically and tend to be cut or eliminated over time—but the experience of recent decades casts doubt on this assumption. A framing paper by Robert Greenstein investigates the features that affect social programs’ political strength, finding that programs’ success depends on multiple factors. Targeted programs reduce racial disparities in poverty, as the figure below shows, though those disparities remain wide.
For more analysis of social programs, check out “Next Steps on the Child Tax Credit” by Robert Greenstein.
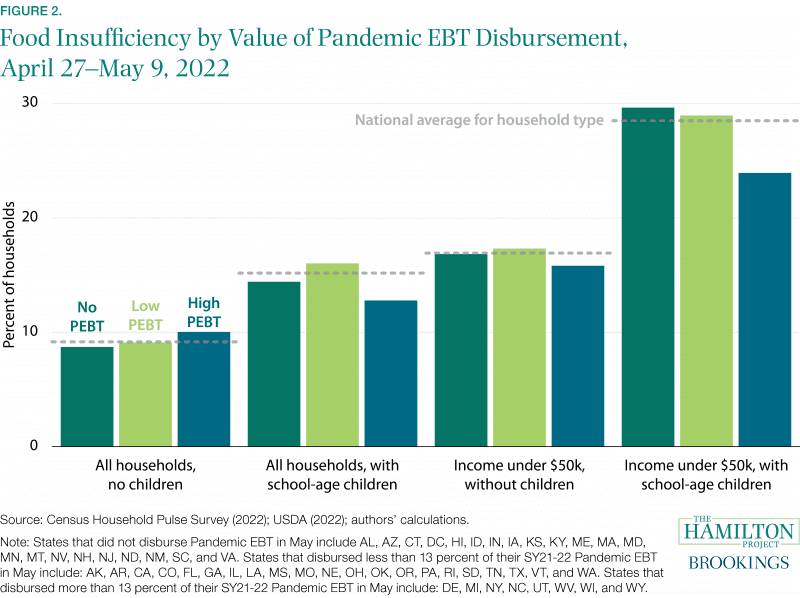
August: Food insufficiency was lower in states that distributed substantial Pandemic EBT benefits.
In “Food Security Shouldn’t Take a Summer Vacation,” the authors identify the Pandemic EBT program as a vital policy tool to fight food insufficiency among children when schools are closed. The figure below displays rates of food insufficiency among households that received different amounts of Pandemic EBT aid, showing that higher Pandemic EBT corresponded with lower food insufficiency among households with children.
Related work includes “An Update on the Effect of Pandemic EBT on Measures of Food Hardship” by Lauren Bauer, Krista Ruffini, and Diane Whitmore Schanzenbach.
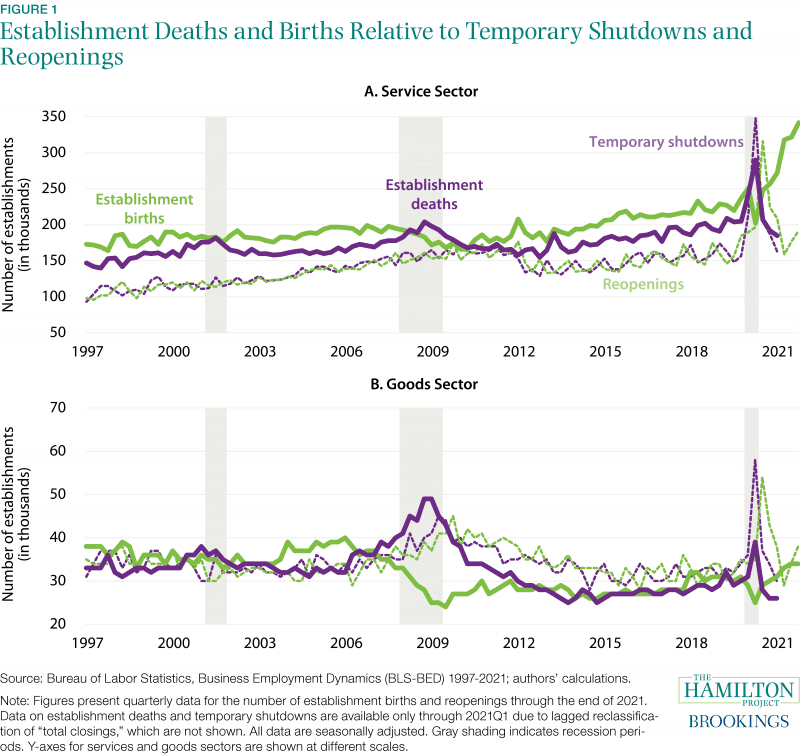
September: New businesses have opened at a record pace since the pandemic.
In a September 2022 report, The Hamilton Project analyzed the recovery of the business sector since the start of the pandemic in 2020. Although establishment deaths in the service sector reached their peak in 2020 and were the largest since 2010 in the goods sector, many more businesses were shut down only temporarily. In addition, a record number of new businesses were established in the service sector: as of 2021, 107,000 more establishments were created than destroyed since 2019.
In addition to this analysis of the business sector, The Hamilton Project also released “Building the Analytic Capacity to Support Critical Technology Strategy” by Erica Fuchs in September.
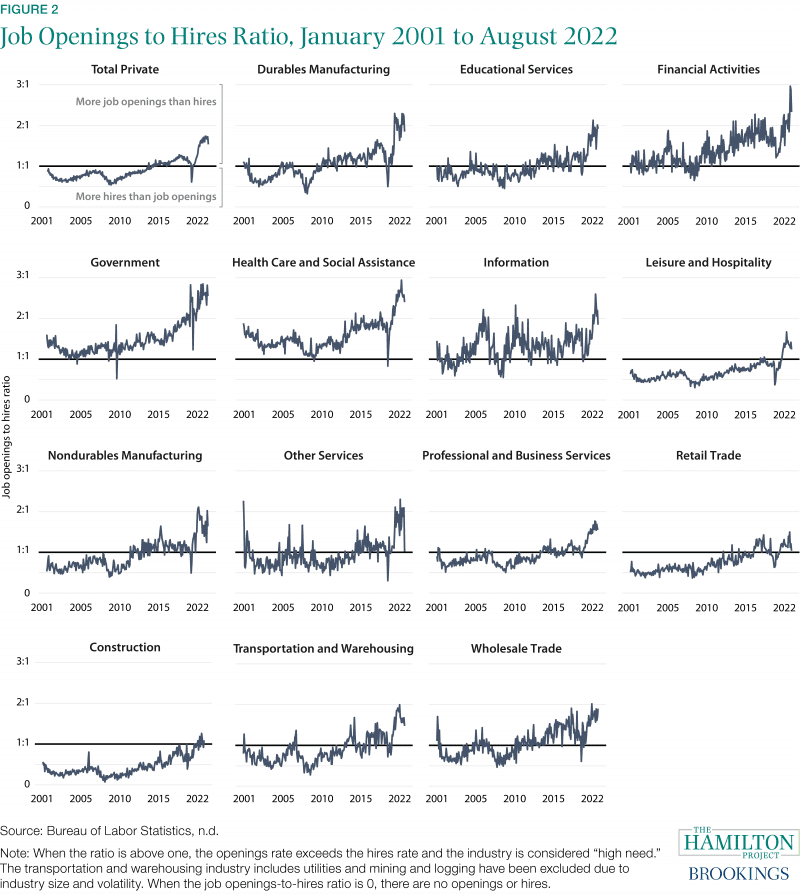
October: Job openings are high relative to hires in most industries.
The job openings-to-hires ratio is a worthwhile indicator of the state of the labor market, according to an October Hamilton Project analysis. While only six industries had a job openings-to-hires ratio above one in 2014, every industry has entered this range—characterized as “high need”—following the pandemic. The ratios vary across industries, with the construction and retail trade industries just recently entering the “high-need” stage, while health care and social assistance have been high for most of the series.
Related work includes “The Labor Market Needs to Soften—but Not as Much as Some Think” by Mitchell Barnes, Lauren Bauer, Wendy Edelberg, and Sara Estep.
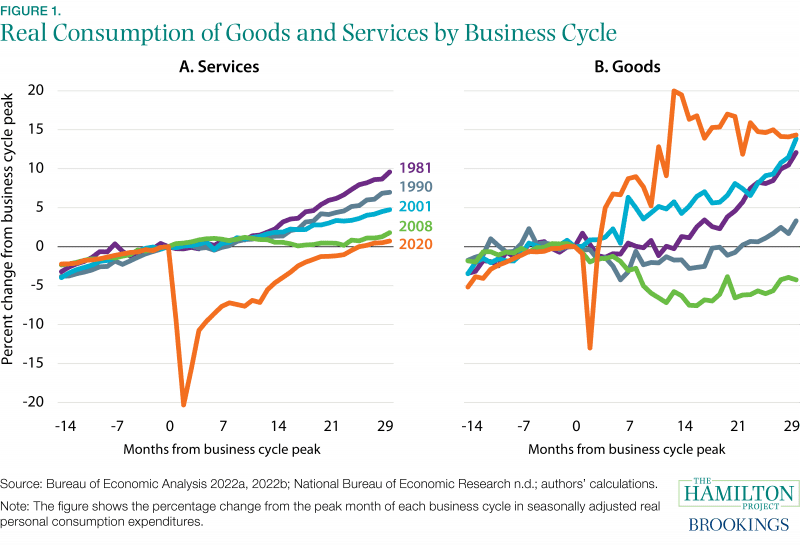
November: Recovery in the demand for services after COVID-19 has lagged behind recent business cycles.
During and in the aftermath of the COVID-19 recession, there was significantly dampened demand for face-to-face services. The service sector is recovering, but activity is still well below where it was expected to be in the absence of the pandemic, according to a Hamilton Project facts document. Real spending on services in summer 2022 was roughly 3 percent below its pre-existing trend, according to the report.
Related work includes “An Industrial Policy for Good Jobs” by Dani Rodrik.
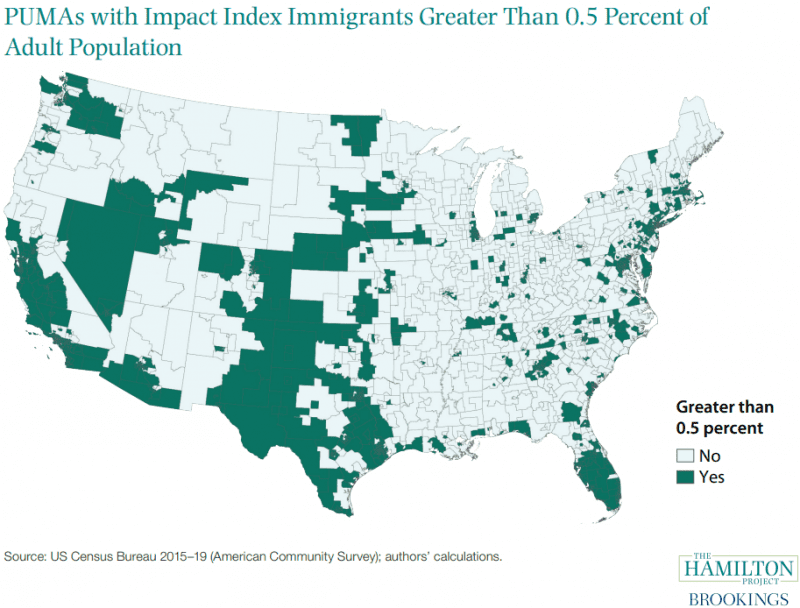
December: The federal government enjoys more of the fiscal gains from immigration than states and localities.
Immigration is good for the U.S. economy, but some local areas face adverse fiscal impacts when new immigrants arrive. A December policy proposal from The Hamilton Project outlines a system for shifting resources from the federal government to the local areas in which there are immediate negative costs to immigration, enabling state and local governments to share more equitably in its net benefits. A related interactive maps the areas most impacted by immigration.
Related work includes “A Dozen Facts about Immigration” by Ryan Nunn, Jimmy O’Donnell, and Jay Shambaugh.
To stay up to date on all of The Hamilton Project’s new research in the upcoming year, sign up for our newsletter:

