In 2025, The Hamilton Project produced research and analysis on key economic policy challenges and developments, including sweeping changes to federal government operations, the safety net, and U.S. trade policy. These nine data visualizations illustrate The Hamilton Project’s work throughout the year.
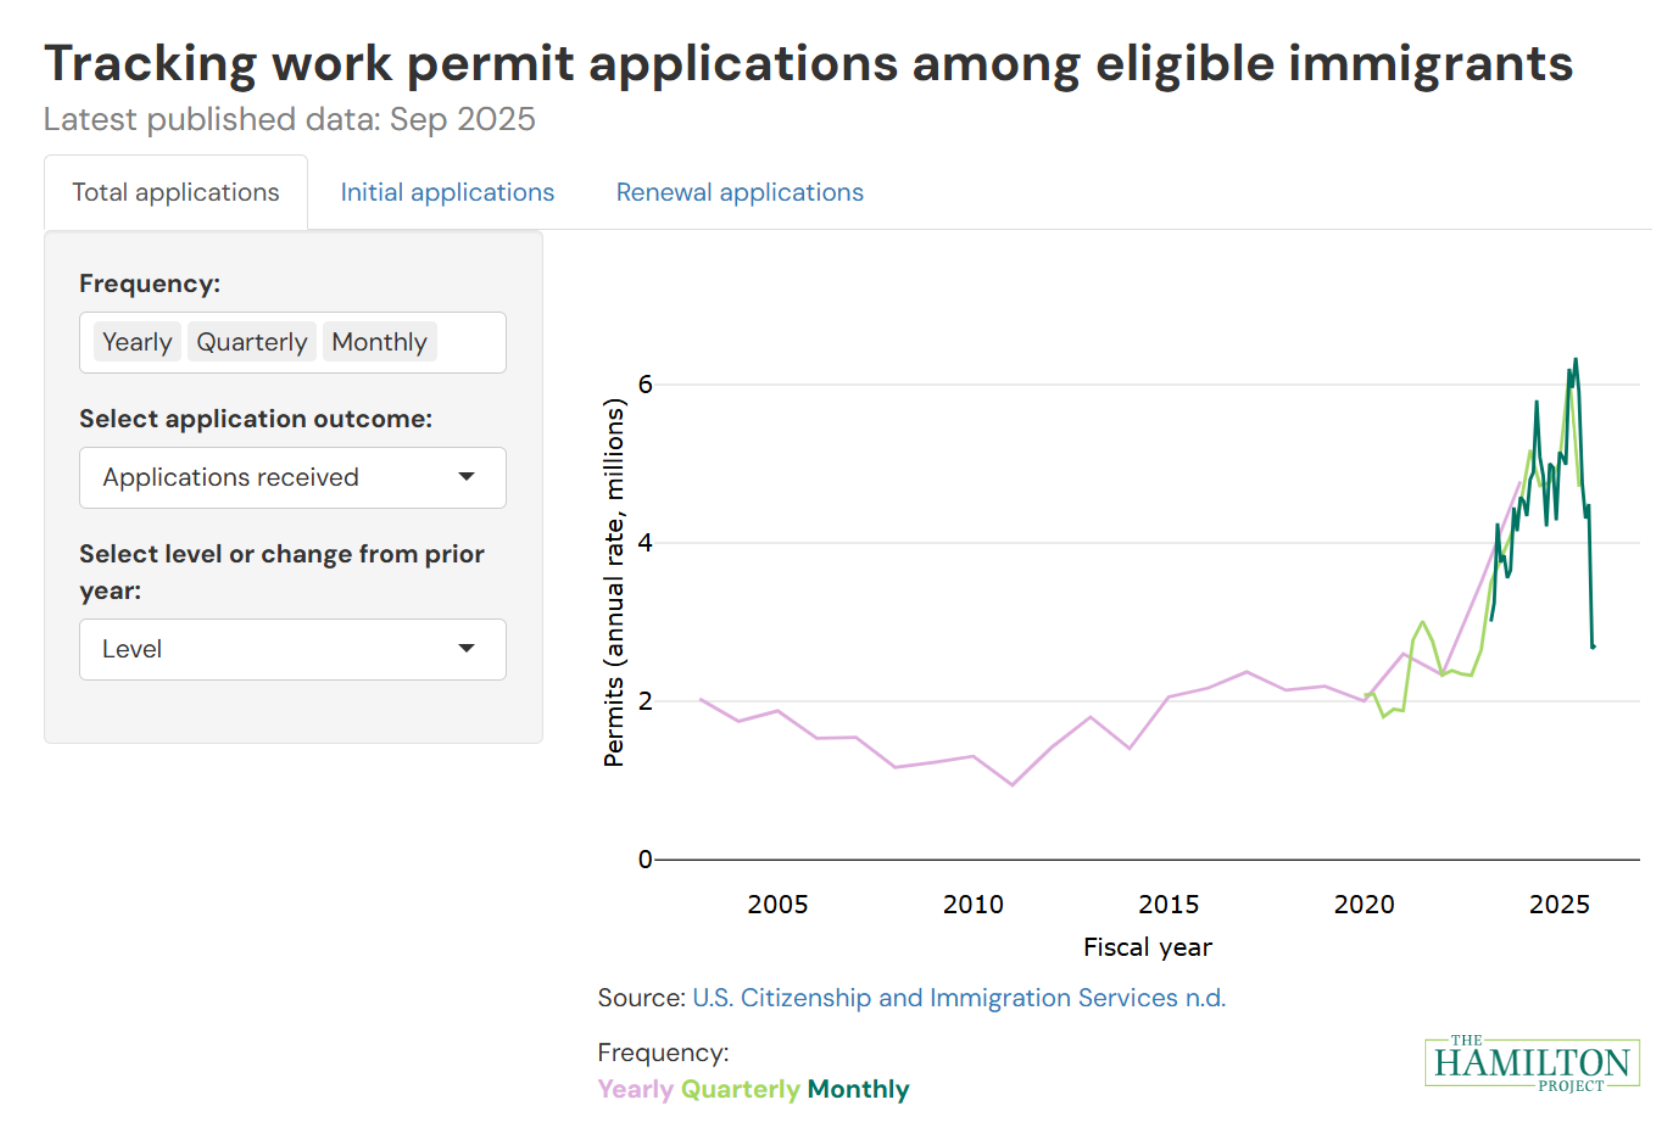
1. Tracking work permit applications informs how changes in the pace of immigration are affecting labor supply.
In March, The Hamilton Project released an interactive tool with data on work permit applications, approvals, and denials, as well as pending applications and processing times.
In an accompanying analysis, Wendy Edelberg and Eileen Powell explore trends in work permit applications, approval rates, pending applications, and wait times through January 2025 and point out that work permit applications can provide one early indicator of how changes in immigration will affect labor supply.
2. Over the past 50 years, safety net expansions have considerably reduced poverty rates.
In a May 2025 paper, Robert Greenstein finds that poverty rates have fallen over the past 50 years, largely because social programs overall have grown considerably stronger. The figure below—adapted from table 3 of the paper—shows how poverty rates measured using the anchored supplemental poverty measure, after taking government benefits and taxes into account, have fallen substantially over recent decades.

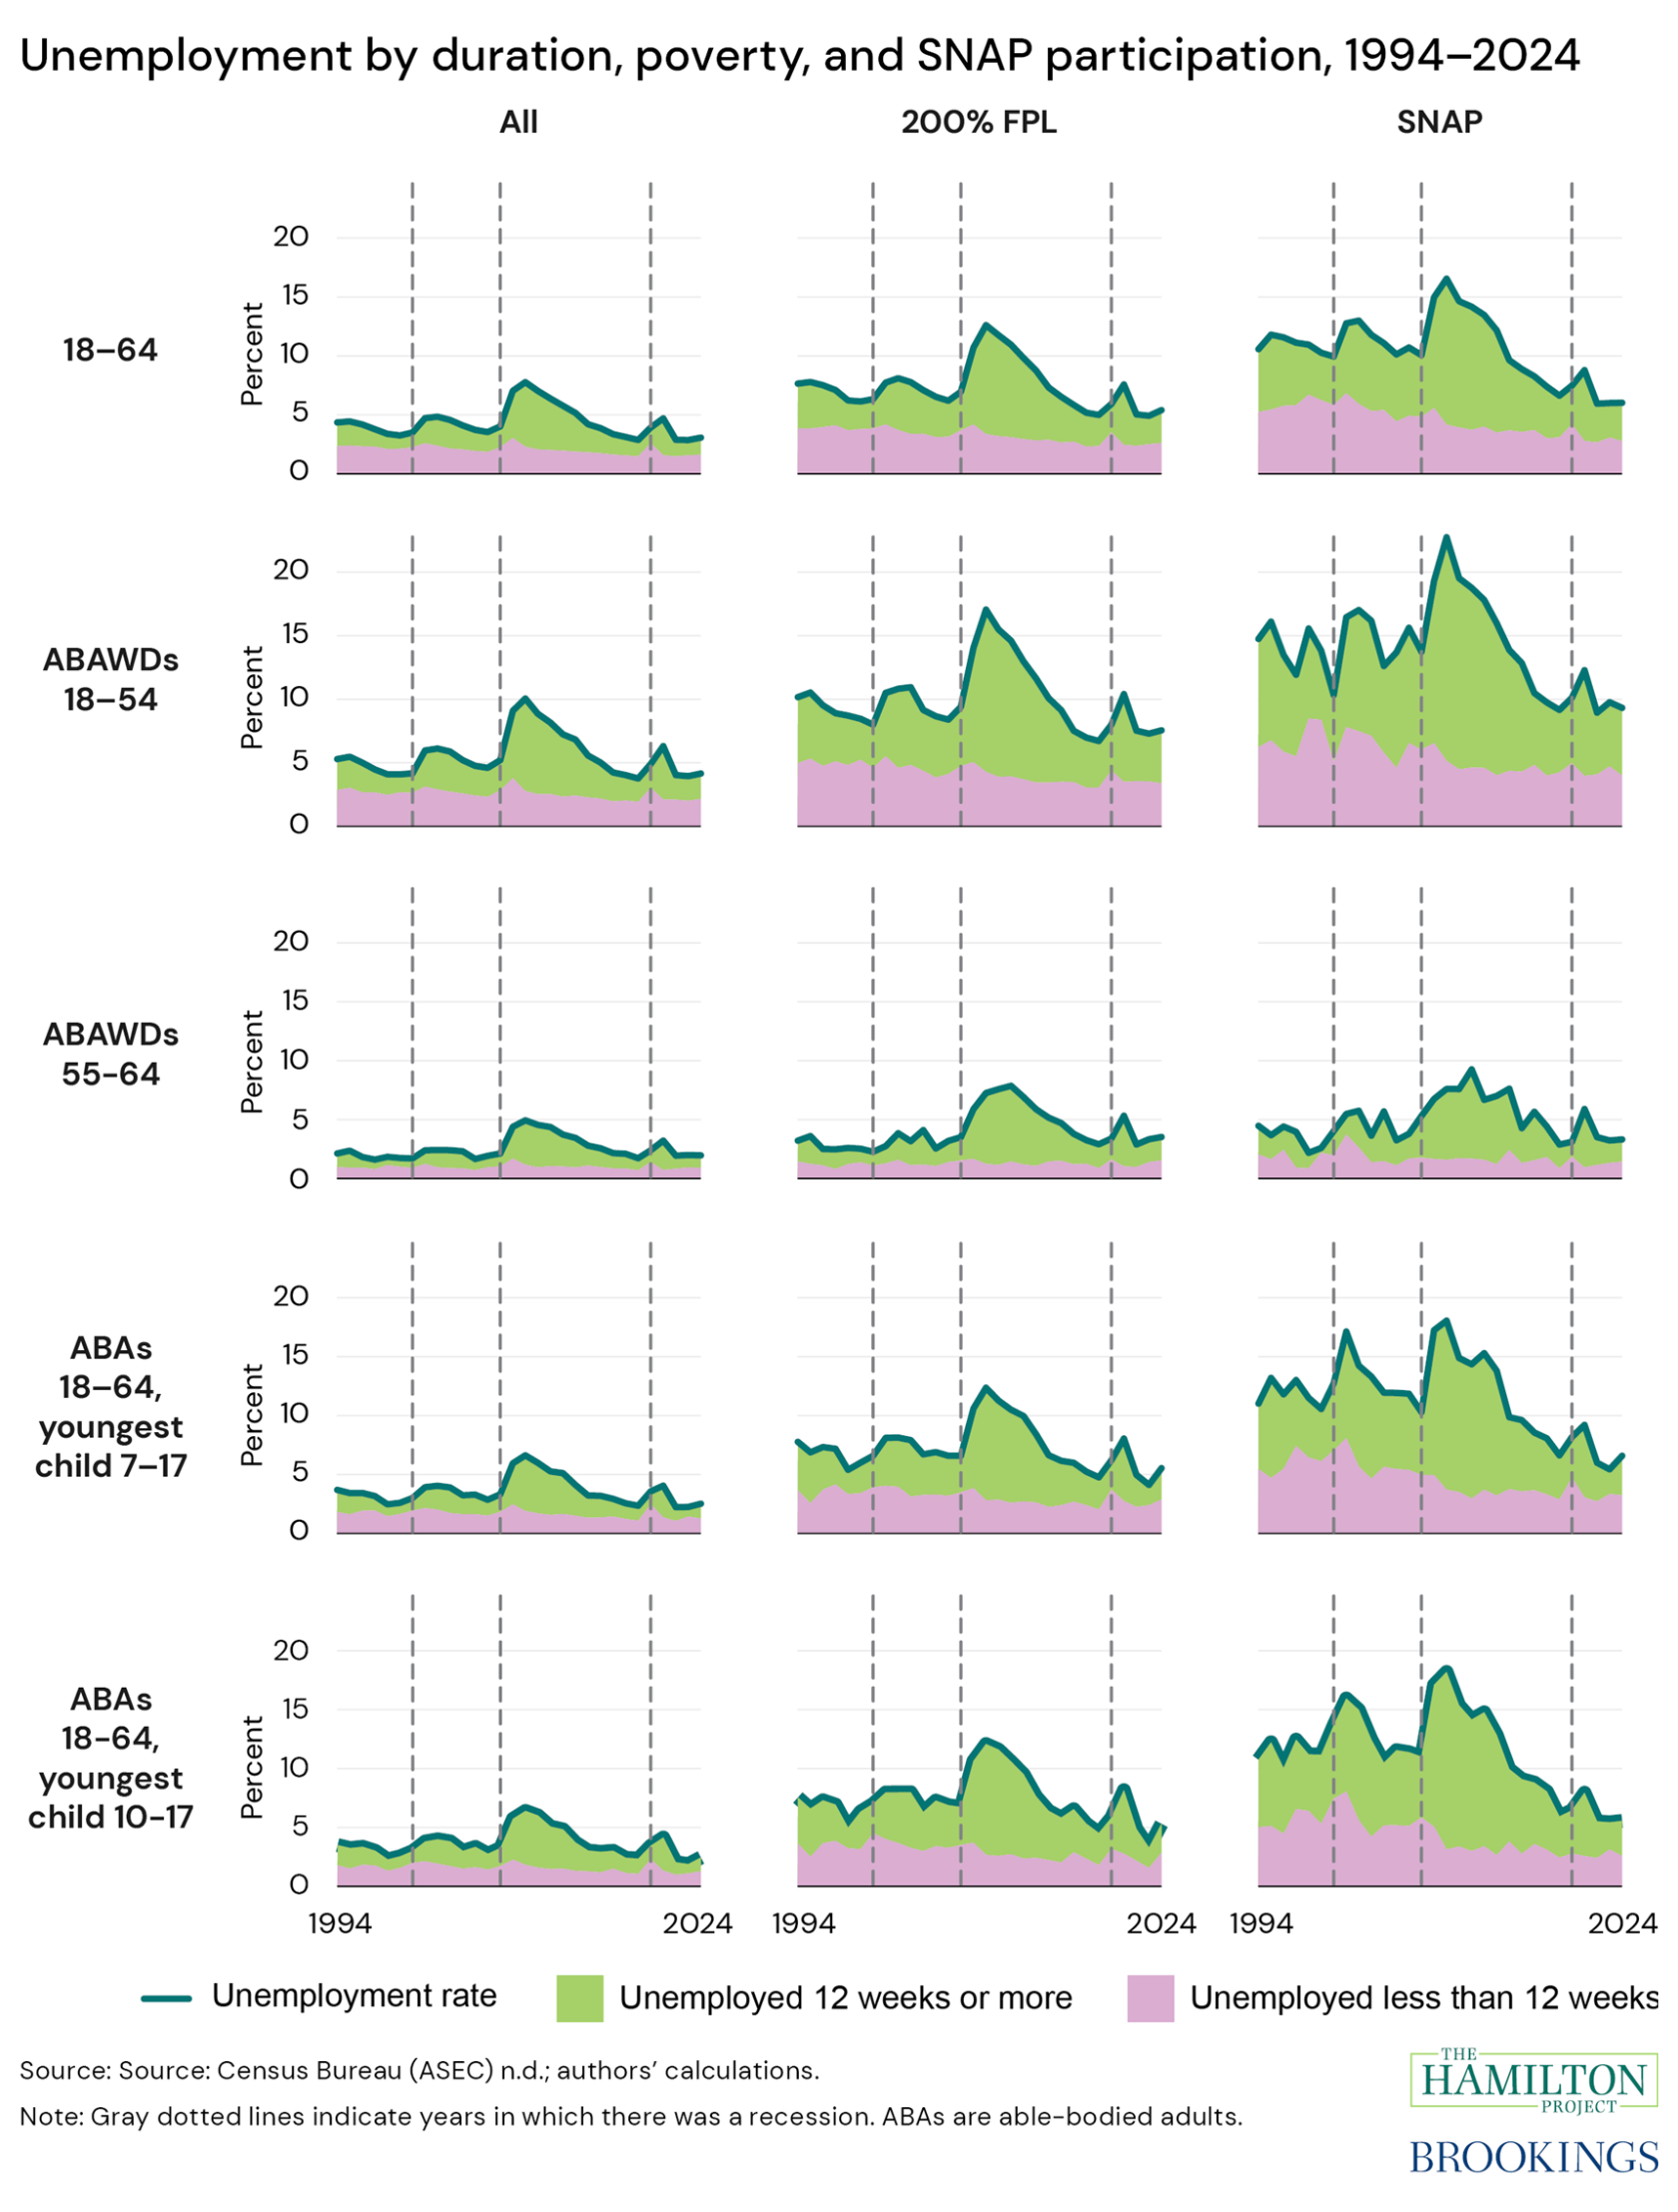
3. Many low-income workers could fail to meet work hours requirements for Medicaid and SNAP because of volatility in monthly hours.
In this May analysis, Elizabeth Ananat, Anna Gassman-Pines, and Olivia Howard show that service sector workers experience substantial month-to-month volatility in hours and earnings, often because their employers don’t provide as many hours as they would prefer.
Given this volatility, work requirements for health care and food assistance penalize many low-income workers. For example, nearly two-thirds of low-income service workers—and more than one-third of those who worked 80 hours per month on average—would have failed to meet an 80-hour per month standard in at least one month of 2022.

For related work, see “Low-income workers experience—by far—the most earnings and work hours instability” and “A primer on SNAP work requirements.”
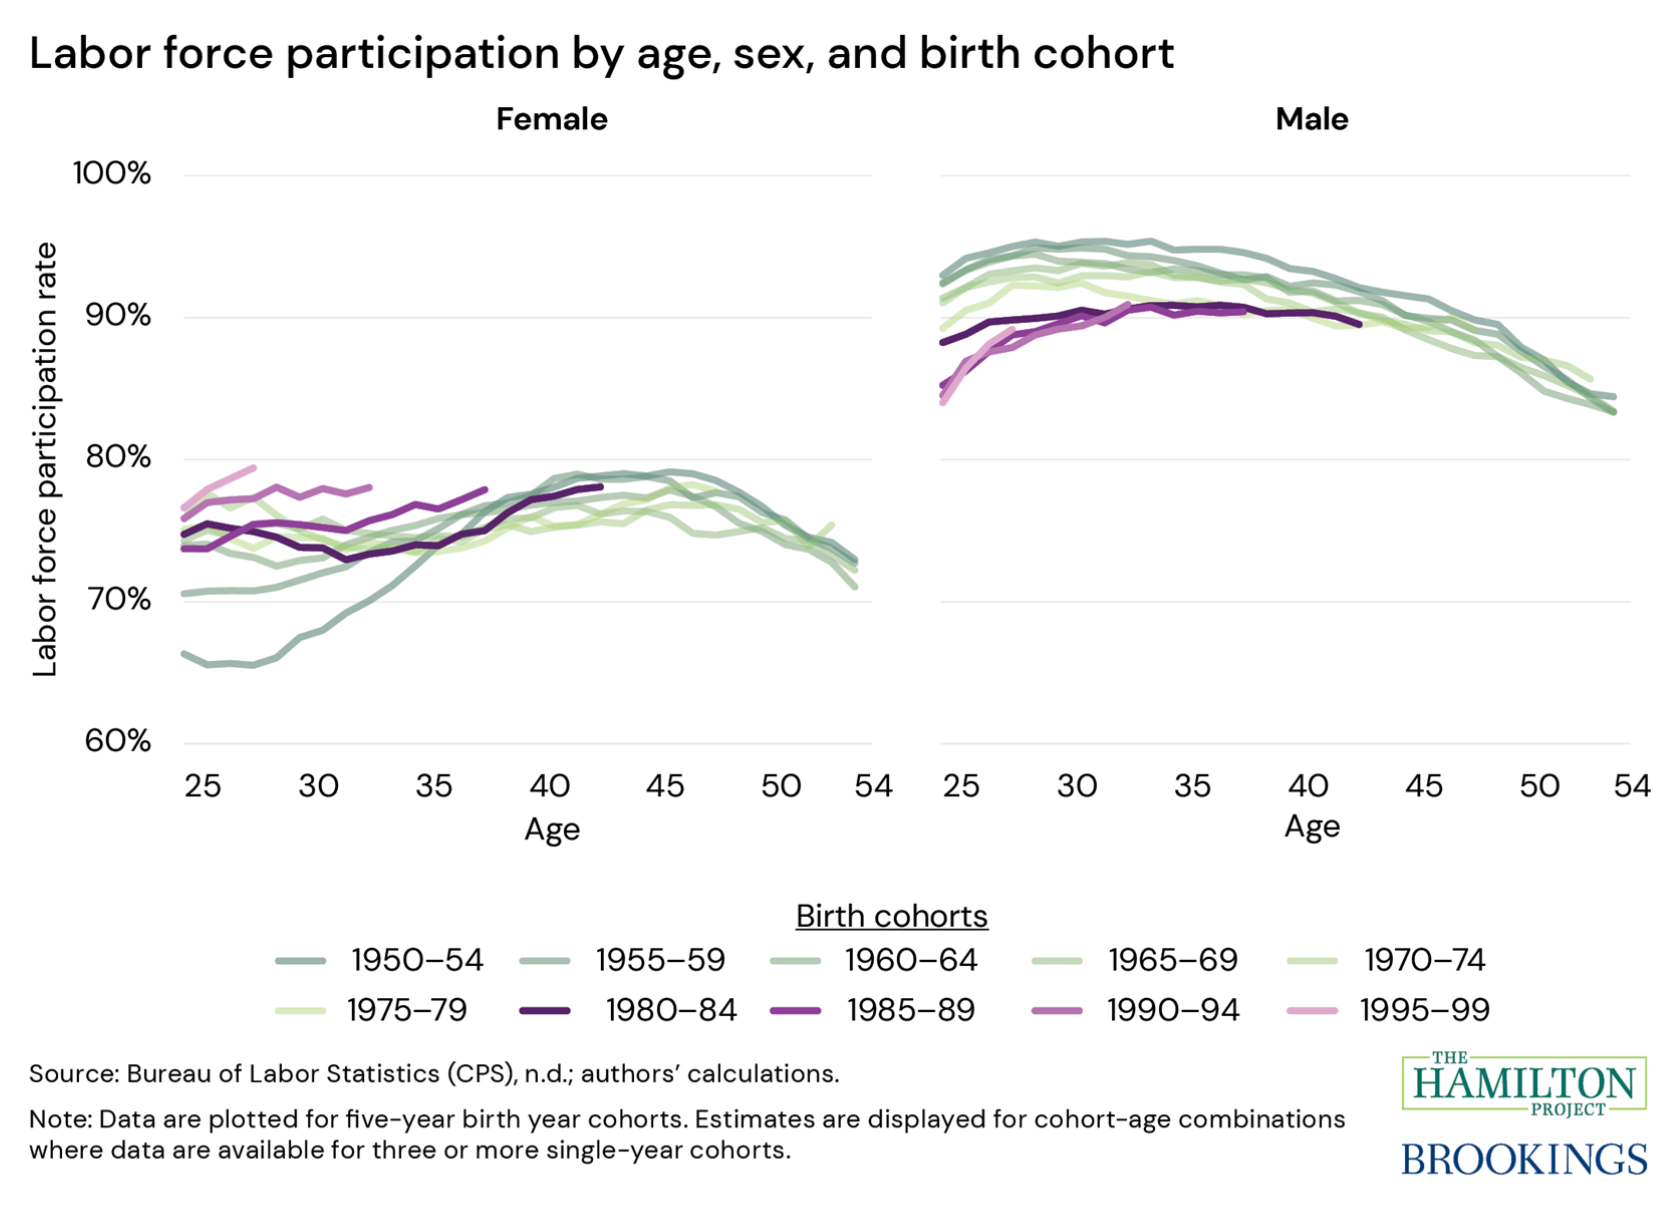
4. Labor force participation has been rising for young women and falling for young men.
In this set of economic facts, Aviva Aron-Dine, Lauren Bauer, and Eileen Powell take stock of the labor market through May 2025, highlighting key trends in prime-age (ages 25–54) labor force participation.
The data show that trends in prime-age participation rates across the life cycle are quite different for men and women and have changed considerably over time. Male labor force participation at age 25 has declined with successive cohorts, though with some signs that the trend may be slowing for the youngest cohorts. Meanwhile, each consecutive birth cohort of women has generally seen increases in labor force participation both at age 25 and across much of their life cycle.
5. National Labor Relations Board administrative data can be used to monitor case closures.
The National Labor Relations Board (NLRB) plays an important role in enforcing employee protections. In this analysis, Olivia Howard, Lauren Bauer, Celine McNicholas, and Margaret Poydock use administrative data from the NLRB to examine NLRB case closures and other actions in 2025 compared to recent years.

6. SNAP cuts in the One Big Beautiful Bill Act will significantly weaken the program’s response to recessions.
In this October analysis, Lauren Bauer and Diane Whitmore Schanzenbach analyze how the OBBBA’s changes to the Supplemental Nutrition Assistance Program (SNAP) will affect the program’s response to recessions. Historically, SNAP has been a key automatic stabilizer, supporting both families and the economy during economic downturns and playing a particularly important role in meeting basic needs for people who lose their jobs.
The OBBBA requires states to pay a portion of SNAP benefits, subjects far more SNAP participants to time limit work requirements, and curtails states’ ability to request waivers from time limit work requirements—policies that will greatly limit the program’s ability to serve this population.
For related work, see “Assessing SNAP work requirement waiver policies by applying OBBBA rules to the Great Recession.”
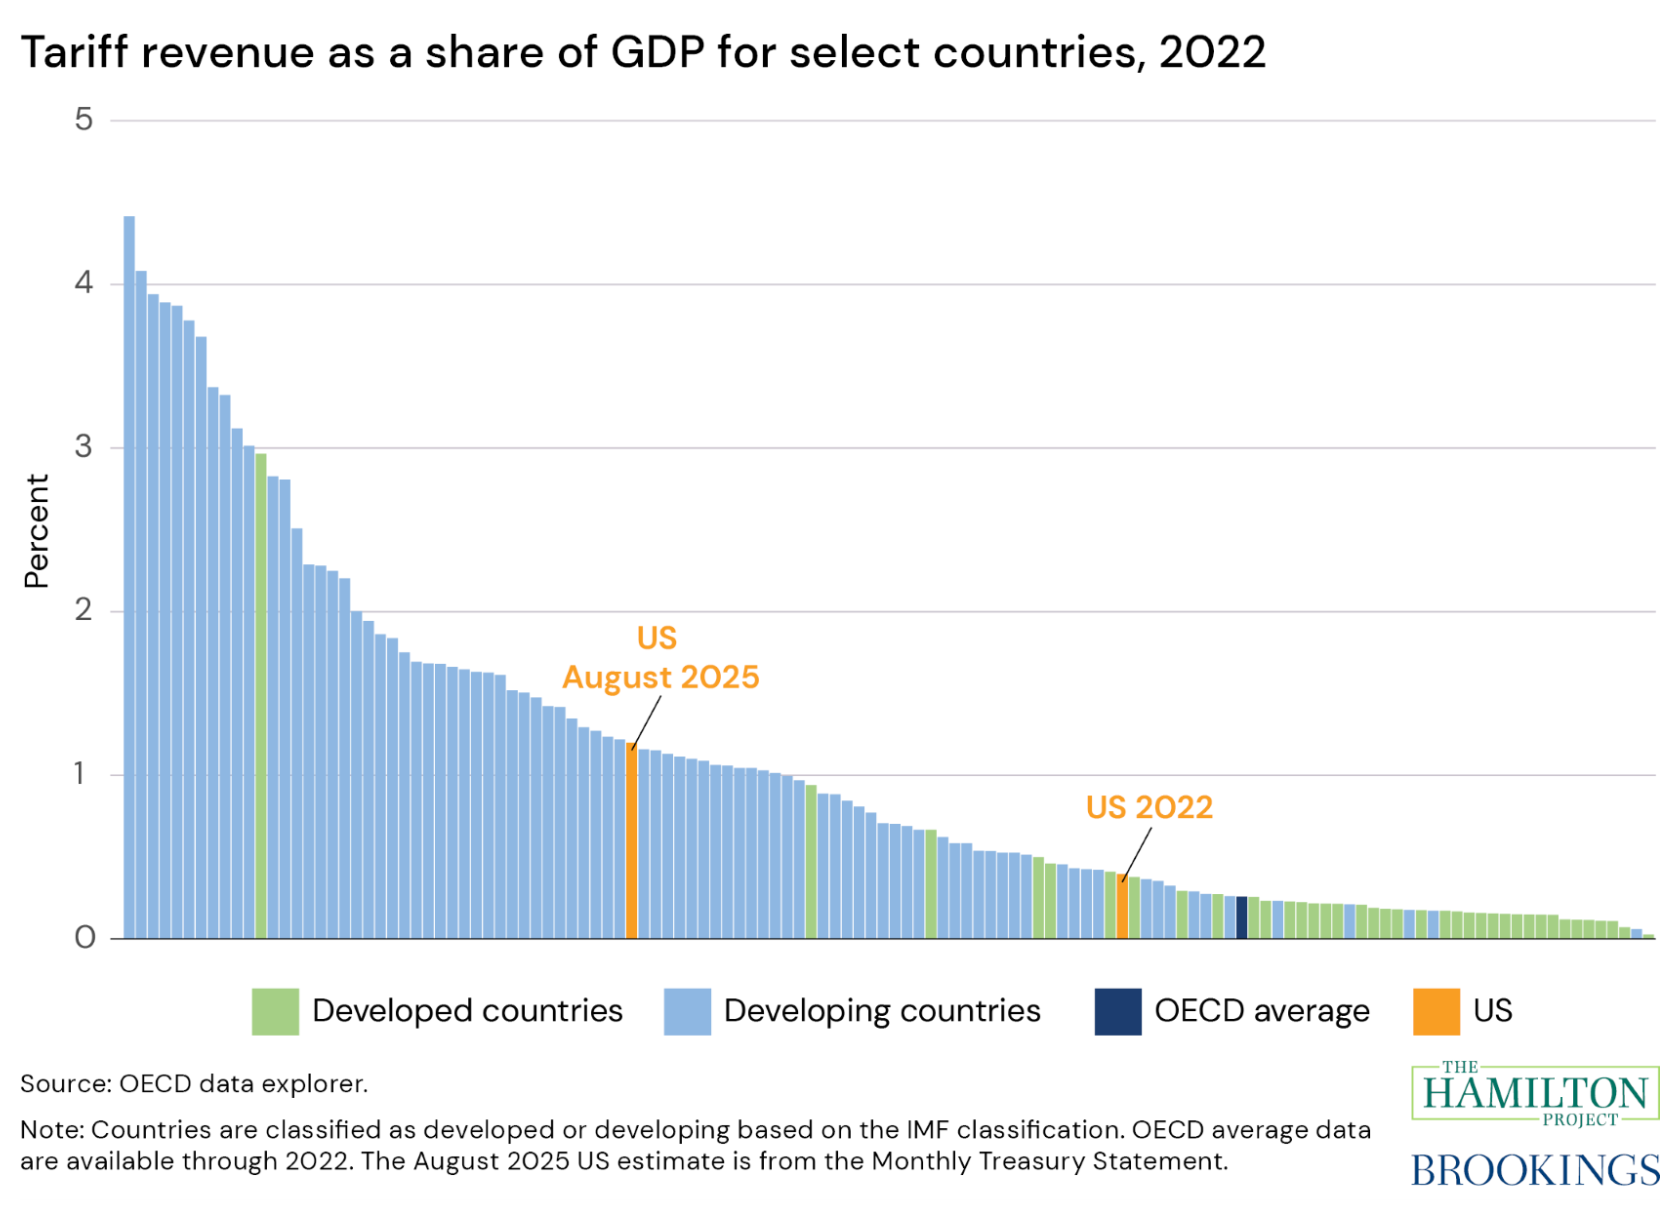
7. Recent increases in tariffs make the US unusual among developed countries.
In 2025, the Trump administration radically reshaped U.S. trade policy with extremely high tariff rates, making the U.S. unusual among its peers. In this explainer, Jay C. Shambaugh argues that making tariffs a permanent revenue stream for the U.S. government will hurt American consumers and the U.S.’ most productive firms, reduce economic growth, and undermine U.S. relationships around the world.
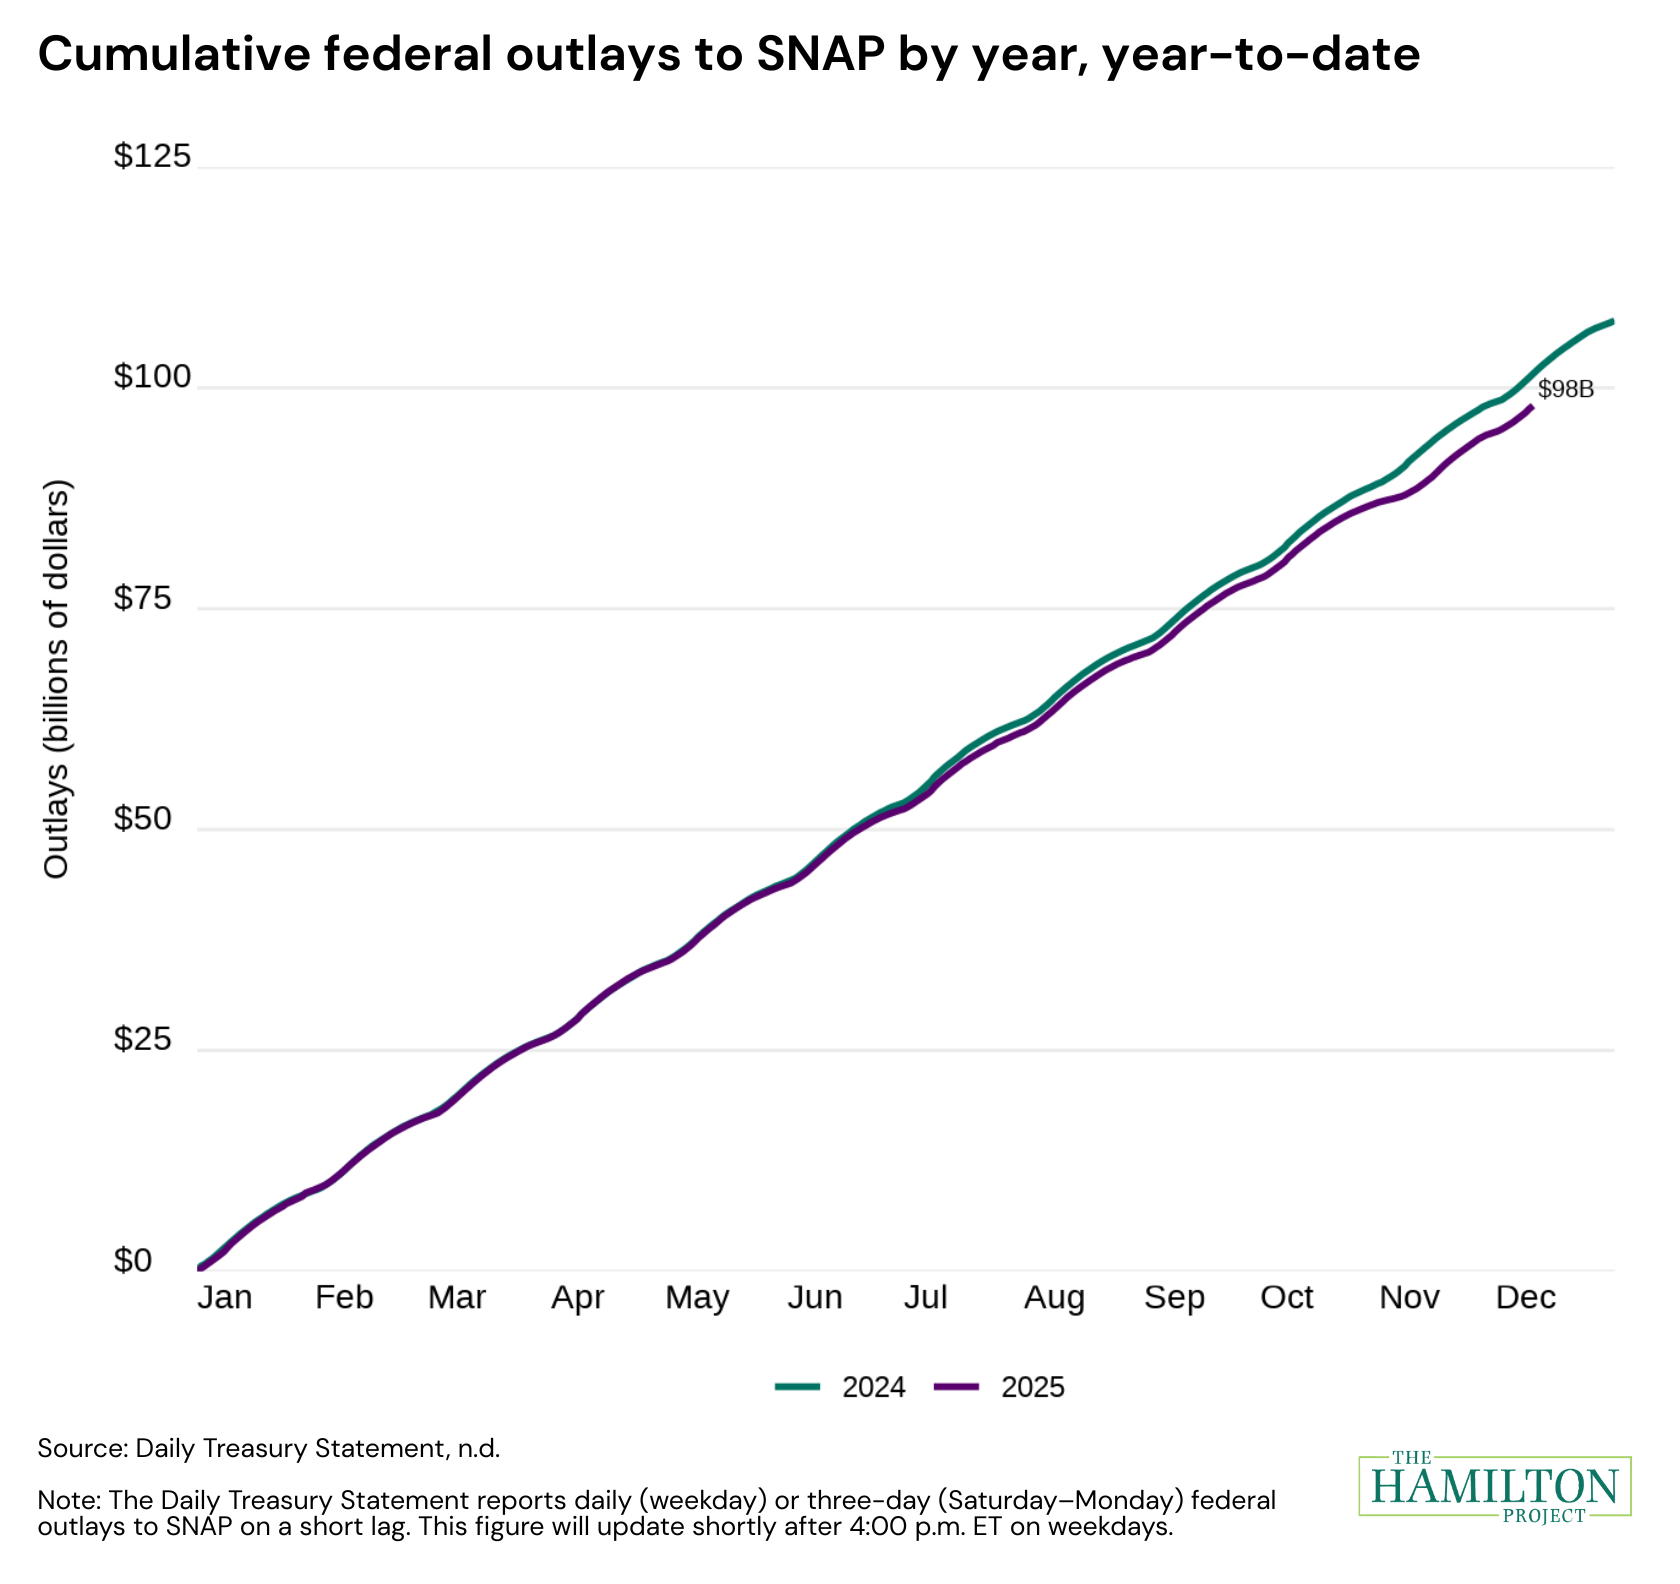
8. The Hamilton Project’s outlays tracker makes detailed, real-time data on federal spending more accessible.
“Tracking federal expenditures in real time” is a data interactive that allows the public to track daily, weekly, monthly, and annual federal outlays to key programs and department with information from the U.S. Treasury’s Daily and Monthly Treasury Statements. In mid-November, the tracker showed how the Trump administration halted federal outlays to SNAP during the government shutdown.
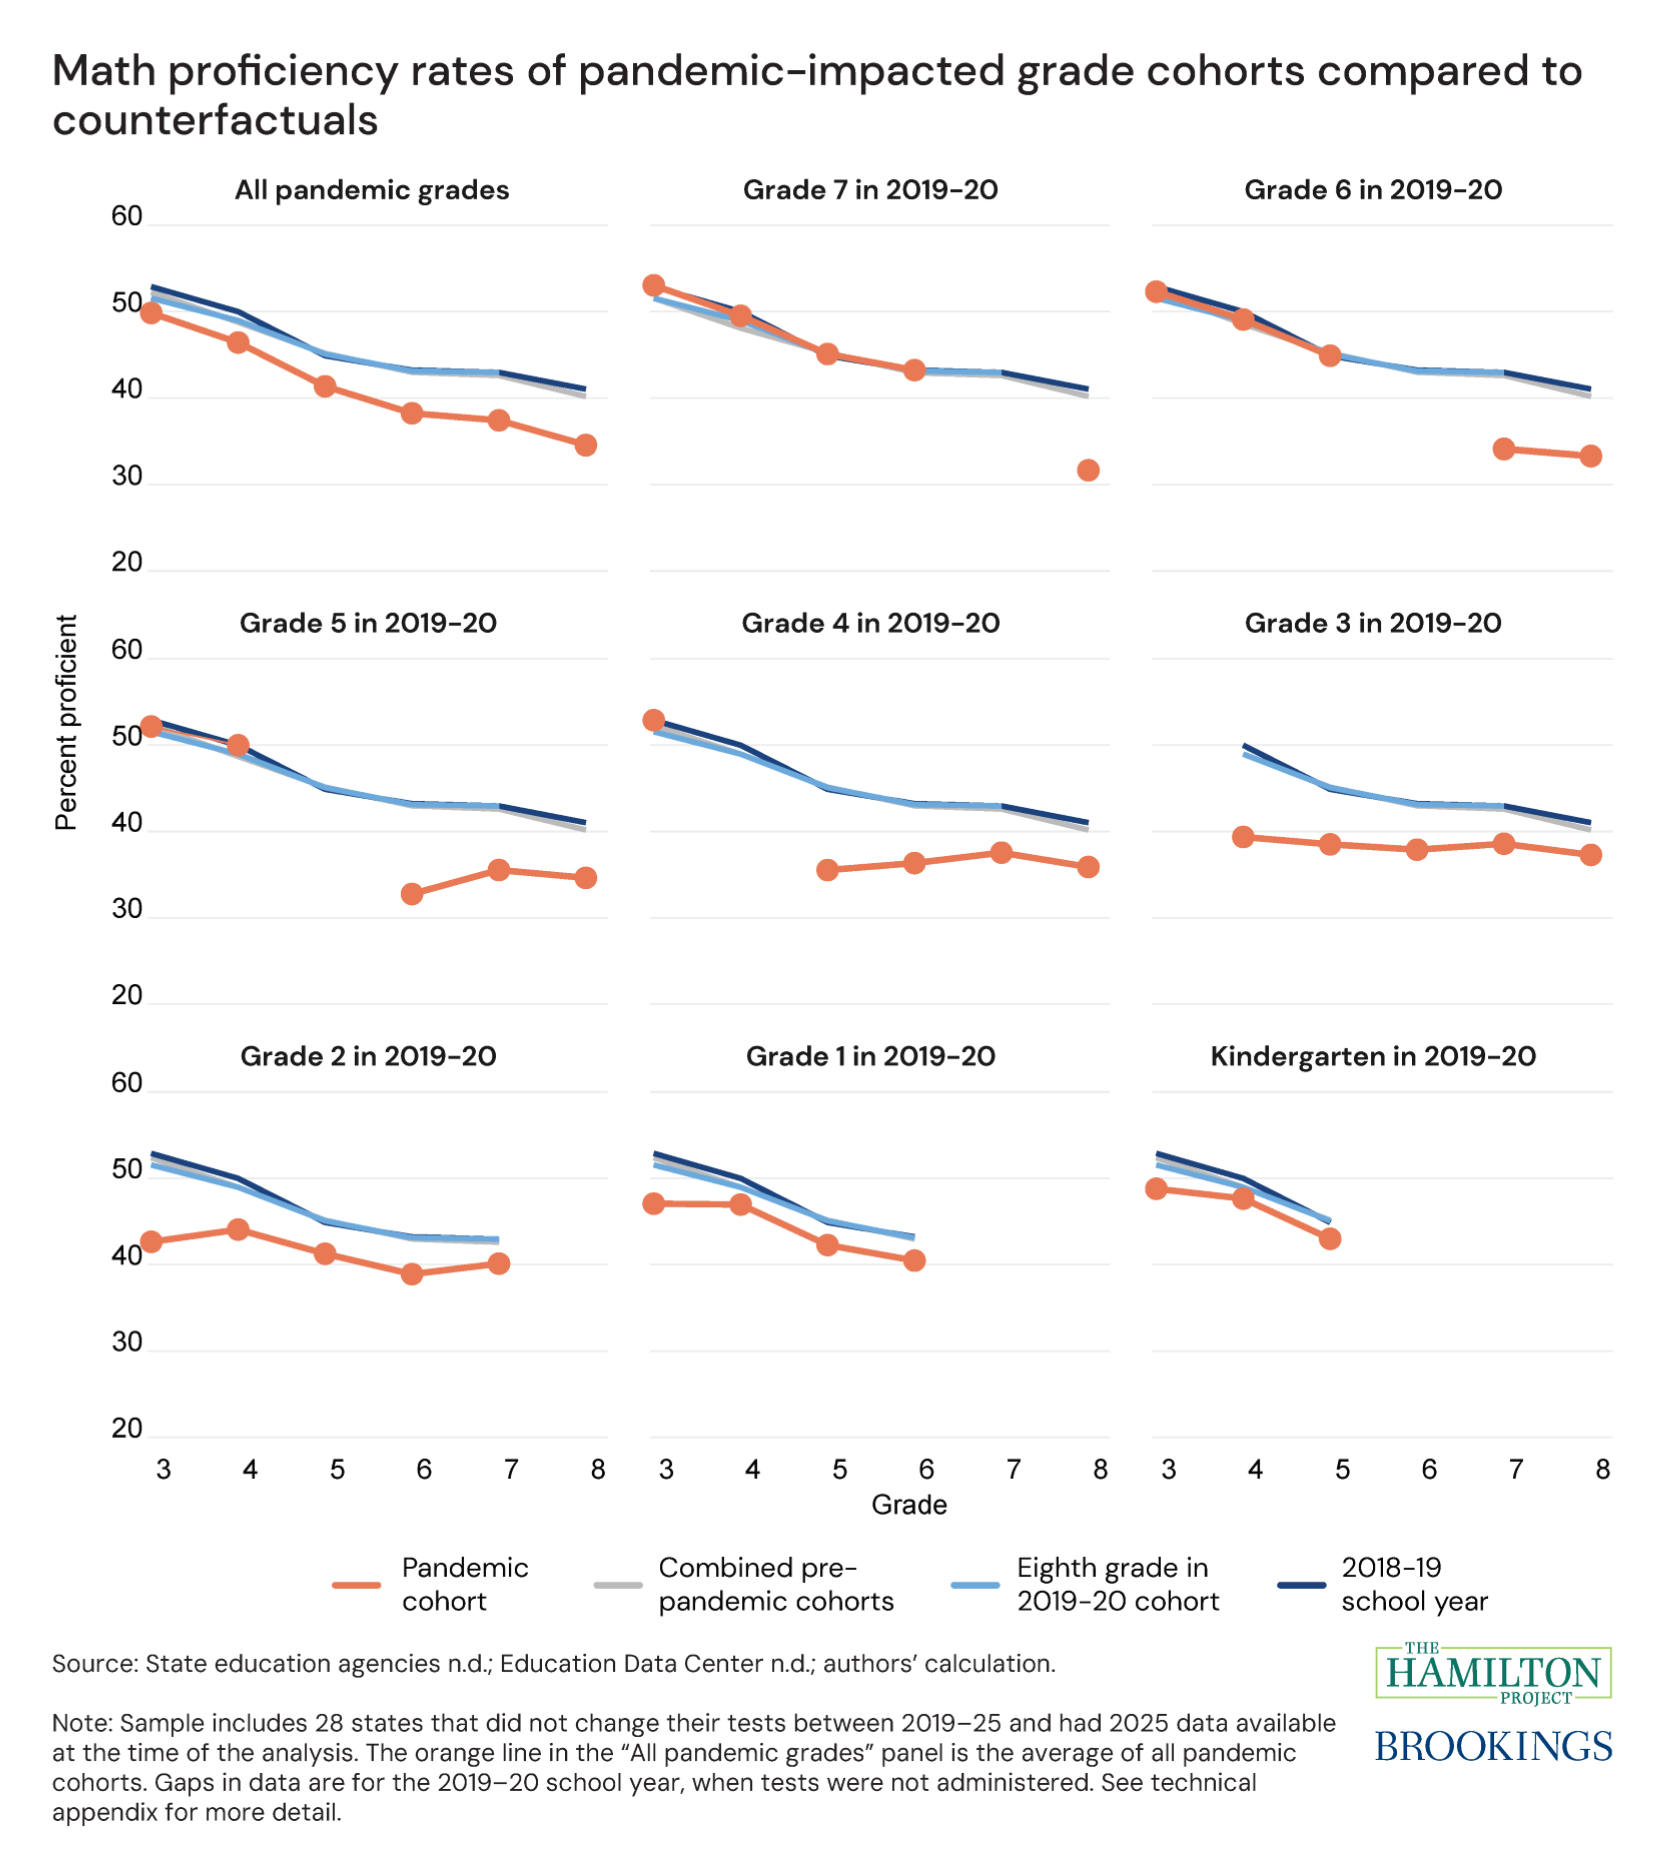
9. Recovery from COVID learning loss varies significantly across cohorts.
In this December analysis, Lauren Bauer and Eileen Powell follow cohorts of students over time to see if trajectories in proficiency rates in math and English differ based on the grade a student was in when they experienced COVID-era disruptions. Looking at students who were in kindergarten through 7th grade during the 2019–20 school year, the authors find that the older the student, the lower the subsequent proficiency rate trajectory.
An accompanying data interactive allows users to filter and compare proficiency data by state-subject-grade-cohort.