
Explore the backcast labor market data in this Github repository, and learn more about the methods in the technical appendix.
Has the labor force recovered to where we thought it would be in the absence of the pandemic?
We find that the labor force is about 900,000 people smaller than one would have expected, primarily because of deaths related to COVID-19 and reduced immigration. We find that, after controlling for changes in the composition of the population, the propensity of people to work in the labor force has recovered, so that is no longer a drag on the labor force relative to what might have been expected in absence of the pandemic. Because the current smaller-than-expected labor force is attributable to lower population growth and not to weakness in the propensity to work, the capacity of businesses to produce goods and services is more likely to be lower than otherwise as a result of this effect for years to come. While on net the recovery in propensity to work has recovered, this recovery was not uniform. Women ages 25-54, Black people 25-64, and Hispanic women 55-64 are all participating more than in 2019; but, white men of all ages and older white women are participating less.
Estimating changes in the size of the labor force in recent years is challenging because substantial 2020 decennial census population revisions were introduced in January 2022 and only incorporated into data for subsequent months. We backcast the population revision in order to create a more informative point of comparison for the current size of the population and labor force participation rates (LFPRs). These revisions show that the labor market prior to the 2020 recession was stronger than previously thought.
Backcasting population revisions
Each month, the Current Population Survey (CPS) interviews roughly 100,000 people. It then weights each respondent so that estimates of important statistics – like the size of labor force and employment – reflect the entire country. These weights are derived from the Census Bureau’s detailed population estimates by race, ethnicity, gender, and other attributes.
The population of the US is always changing, but some information about its size is only updated with a lag. Each January, the Census Bureau introduces new population estimates and the Bureau of Labor Statistics (BLS) uses these estimates to adjust the CPS sample weights for the year ahead; however, BLS does not revise the weights it used for past survey years. This process can cause estimates, especially of total counts like the labor force, to jump up or down each January. Most of the time, these jumps are relatively small, changing the aggregate size of the labor force, for example, by perhaps a few hundred thousand, or what might be expected from one month to the next anyway.
However, the new weights introduced in January 2022 incorporated the 2020 decennial census for the first time, and the resulting changes were much more dramatic. Not only did the CPS population estimate jump by 1.0 million from December 2021 to January 2022, but the labor force and employment counts shot up by a larger 1.5 million each. The 2020 census, it turns out, showed that there were a greater number of people under the age of 65—who have a higher propensity to work—than previously estimated. Any analysis that assumes the size of the labor force truly increased by 1.5 million in one month would be flawed. Instead, the 2020 census-based one-time adjustment should not just be acknowledged and then set aside; it should also inform our understanding of the changing population in prior years. In fact, the composition of the one-time adjustment provides the information necessary to smoothly apply these population changes back to 2012, when the results of the 2010 census were incorporated into the population estimates.
Figure 1 shows how published estimates of the LFPR (annually for 2012-2019 and monthly thereafter) change when the one-time adjustment made in January 2022 is backcast to previous months of the CPS using the revised population weights by detailed demographic characteristics.1 By design, the effect of the backcast on population estimates is linear and gradual. It was not by design, however, that the new population estimates resulted in an upward revision to LFPRs. That upward revision owes to the fact that the 2020 Census disproportionately increased the number of people in age ranges with a high propensity to work.

The differences in population found in the 2020 decennial census, not just overall but specifically the differences by age group, are large enough to affect calculated trends in LFPR when using the CPS. Robertson and Willis (2022), for instance, show that adjusting the sample weights to smooth out the jump in the estimated population raises LFPRs in 2021 by about 0.3 percentage points for the working age population, and 0.7 percentage points for those ages 55 and above. Montes, Smith, and Dajon (2022) find that smoothing the population adjustments over previous years is critical in understanding the rise of older worker retirements since the beginning of the pandemic.
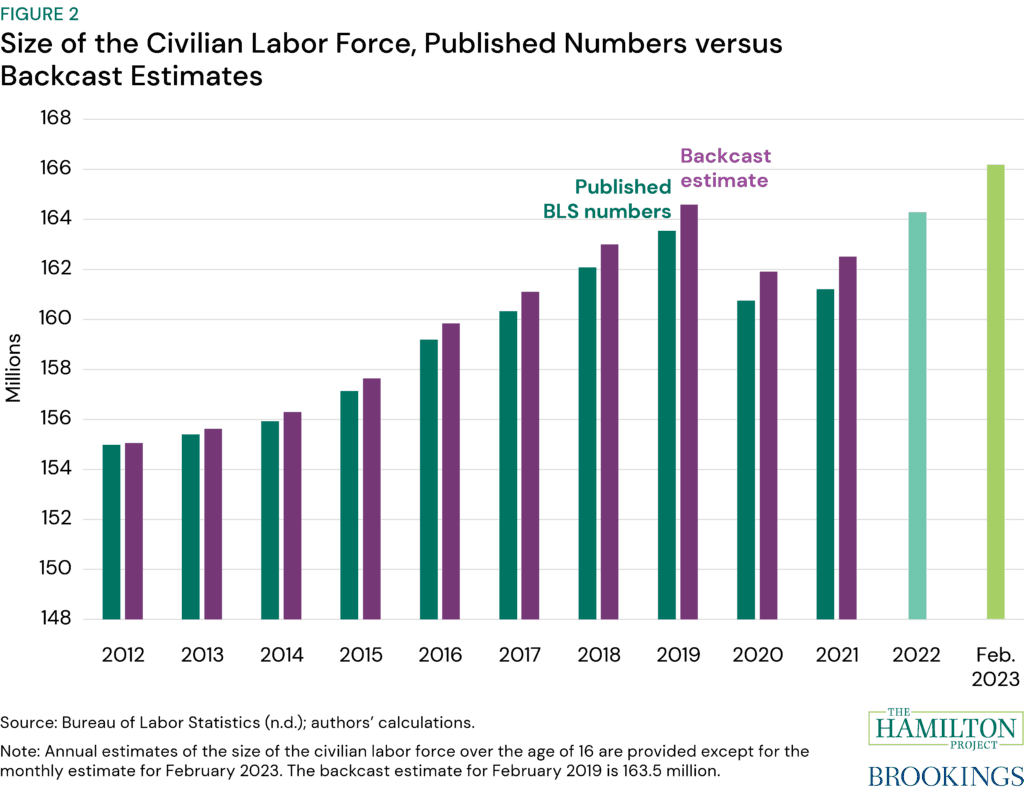
Figure 2 shows how backcasting the population revisions affects the estimated size of the labor force, which grows in most years with increases in the size of the population. The teal bars represent the original estimates over the past decade. The purple bars show the revised estimates after backcasting the population adjustments. As a result of phasing in the revisions, the difference starts small in the first years and grows over time, so that the revised average annual labor force in 2021 is 1.3 million higher than originally estimated. Moreover, according to the original estimates, the average size of the labor force across the whole of 2022 was larger than it was in 2019; under the revised estimates, this is no longer the case. As of February 2023, BLS estimates that the size of the labor force had grown to 166.2 million people, well above the backcast 2019 level.
What factors have reduced labor force growth since 2019?
Although the labor force is now larger than it was in 2019, an open question is whether and to what degree it is smaller than would have been expected in absence of the pandemic. To answer this question, we use the backcast data for 2019 to establish a more accurate point of comparison. As demonstrated in Figure 2, any comparisons that use the original, published data would overstate by how much the labor force has grown since the start of the pandemic.
We estimate that the labor force is roughly 900,000 smaller owing solely to unexpectedly weak population growth since 2019. Pre-pandemic projections from the Congressional Budget Office (CBO) forecast that the civilian population aged 16 and over would grow by 2.9 percent from 2019 through the beginning of 2023. Using the backcast CPS data, we estimate that the population grew a smaller-than-expected 2.4 percent, with the shortfall primarily due to deaths from COVID-19 and reduced immigration. As a result, the population is roughly 1.4 million people smaller than projected. Assuming the LFPRs of different demographic groups (defined by sex and broad age categories) did not change from 2019, the smaller population alone would imply a labor force roughly 900,000 smaller.2
Note that because the published data overstate the population growth since 2019 (due to the one-time census-related population revision), using published data would suggest the population grew 2.7 percent and the size of the labor force is currently only 400,000 smaller because of lower-than-expected population growth.
For which groups are changes in population and participation contributing to the decline in the overall labor force participation rate?
In this section, we examine in more detail how two factors—changes in the population composition and the changes in the propensity for people in different demographic groups to participate in the labor force—explain the decline in aggregate LFPR in recent years. Using the backcast data, the last set of bars in figure 3 show the decline in LFPR through February 2023 since 2019, but for context also shows the decline over longer periods, since 2015 and since 2003.
The first set of three bars show the effects of changing composition of the population, such as the aging of the population or shifts in the gender ratio (perhaps due to differential COVID mortality and immigration) on the aggregate decline in LFPR. Segments of bars below zero show the drag on overall LFPR as high-LFPR groups (for example, prime age men) shrink, and low LFPR-groups (for example, women 55 and older) grow larger. The second set of three bars show the contribution to aggregate LFPR from the changing propensity to work within demographic groups. The last set of three bars shows the sum of these two channels.
From this last set of bars, the total reduction in LFPR between 2019 and February 2023 is 0.9 percentage points. These estimates are different from what one would find using the published data without the backcast population revisions. Using the originally published data, the total reduction in LFPR between 2019 and February 2023 is estimated to be only 0.6 percentage points (on a seasonally adjusted basis). Changes in the composition of the population effectively accounts for the total reduction in LFPR over that period; changes to LFPRs within groups had a negligible effect on overall LFPR, as growth for prime-age women was offset by declines among other groups.
Importantly, the estimated change to LFPRs within groups are different for different time periods. For example, figure 3 shows that since 2003 the within-group changes in LFPR boosted the aggregate rate by 0.4 percentage points, on net, as prime-age women and people 55 and over increased their propensity to work in the labor force. One factor behind that has been increased educational attainment, which is associated with higher LFPRs. Relatedly, younger people have reduced their propensity to work in the labor force over this period (mostly to invest in that extra education), pulling down the aggregate LFPR. In addition, participation rates have fallen since 2003 for prime-aged men, continuing their downward trend begun in the 1960s.
In contrast to our estimate of no net reduction in LFPRs over the course of the pandemic, Abraham and Rendell estimate that within-group changes in LFPRs contributed to a 0.5 percentage point reduction in aggregate LFPR over about – but crucially not exactly – the same time period. We find that the difference in estimates owes to differences in the period of analysis: Abraham and Rendell examine the change in LFPR from February 2020 instead of 2019 (so their point of comparison is higher than ours) through the end of 2022 rather than February 2023 (so our analysis incorporates more of a recovery in within-group LFPRs).
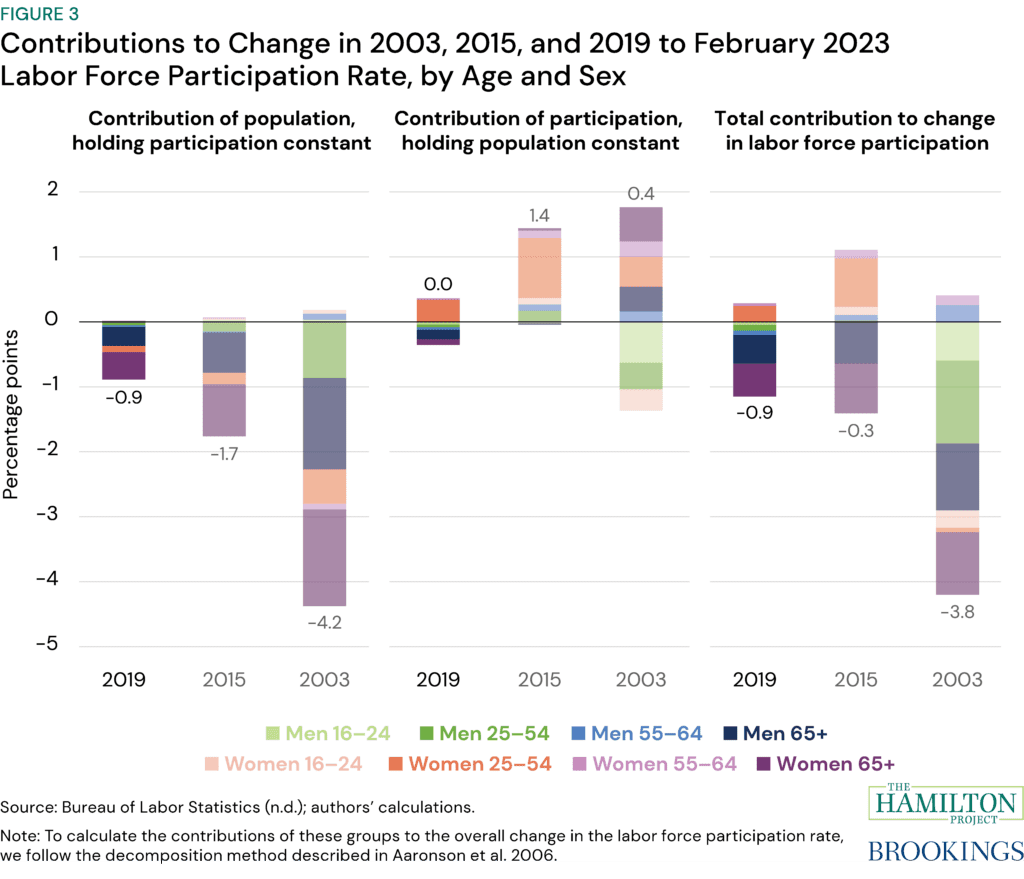
The first three bars in figure 3 show that changes in factors related to population composition, mostly notably the aging of the population, have been a persistent drag on LFPR. However, over the three time periods considered here, net increases in LFPRs owing to changes within demographic groups have helped to offset that drag. While in the longer-horizon periods, the offset was relatively sizable (0.4 percentage points since 2003 and 1.4 percentage points since 2015), since 2019 the offset from the net changes to LFPRs within demographic groups was near zero. On one hand, a fall in LFPRs for all men as well as women over age 65 together reduced the aggregate rate by about 0.4 percentage point. On the other hand, women 64 and younger are all participating at higher levels today than in 2019, raising the aggregate LFPR by 0.4 percentage points. The increase is particularly notable for prime-age women, who were disproportionally affected by pandemic-related layoffs and struggles with childcare. The result is that the increase in LFPR among prime-age women that we saw leading into 2019 has continued.
Compared to 2015, almost all groups are participating in the labor force more in February 2023. (This makes intuitive sense, as September 2015 marked the lowest LFPR since the 1970s.) The exceptions are young men (age 16-24) and men over the age of 65. Broader shifts over the past 20 years, including lower labor force participation among young people and prime-age men, and higher labor force participation among prime-age women and those over the age of 54, are still evident in the decomposition from 2003 to today.
This analysis makes clear that some of the weakness in labor force growth over the last few years partially reflects long-term trends in the composition of the labor force as well as a reduction in the propensity of certain groups to work. To drill deeper into which groups are now more likely to work, we further decompose the change in LFPR between 2019 and February 2023 by examining demographic groups also defined by race and ethnicity.
Figure 4 shows how each group’s changing propensity to work from 2019 to February 2023 contributes to the change in aggregate LFPR, where we define groups by age (16-24, 25-54, 55-64 and 65+), race/ethnicity (white, Black, Hispanic and other), and sex (men and women).
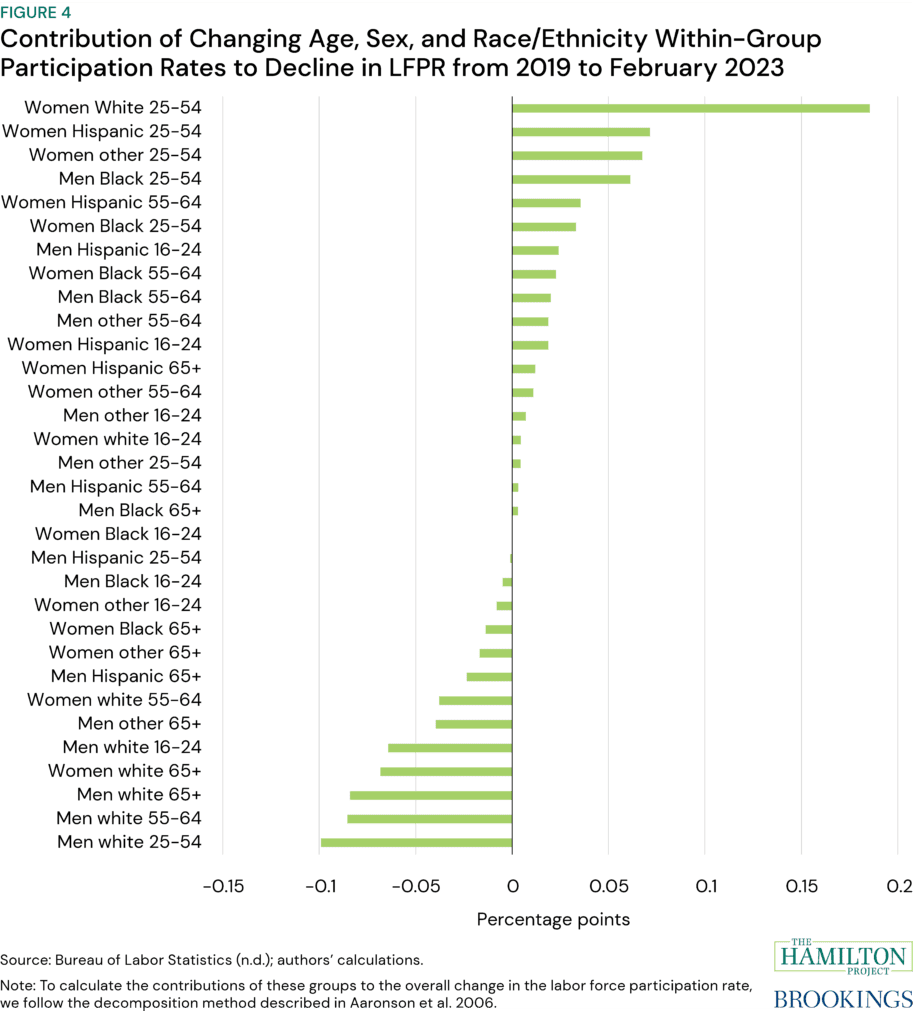
We find that four of the five most negative contributions to overall LFPR are owed to reductions in participation rates among white men of all ages, especially prime-age white men. In contrast, prime-age women of any race make up four of the six most positive contributions, with Black prime-age men and Hispanic women 55-64 rounding out the group. Among white demographic groups, only white women 16-24 and 25-54 have greater participation than in 2019. In fact, prime-age women of any race make up four of the six most positive participation-related contributions, with Black prime-age men and Hispanic women 55-64 rounding out the group.
All those of prime working age—except white and (to a very small degree) Hispanic men—are on the positive side of the ledger: white and Hispanic women, all Black people, and all people in the other (remainder) race category. Most groups over the age of 65 are on the negative side of the ledger, although older Black men and Hispanic women are participating more than in 2019. Indeed, Black people aged 25-64 have increased their participation relative to 2019 by 1.7 percentage points, while white people in the same age group have seen their participation rate increase by .01 percentage points, narrowing the racial participation gap by 1.6 percentage points—the first time this has happened after a recession.
Since 2020, while nearly every industry has seen exceptional job growth, those with particularly high job openings relative to hires are generally the industries which disproportionately employ the demographic groups that have increased LFPR the most. For example, women are disproportionately represented in health care and social assistance, where job openings in health care and social assistance were significantly above 2019 levels. Conversely, men are disproportionately represented in construction, which has not seen increases to the same extent in openings relative to hires and indeed job openings in this industry have been falling in recent months.
Conclusion
Integrating a backcast of the 2020 decennial census population revisions into analyses of the changing labor market over the past few years paints a somewhat different picture than the published data. We find that the labor market is about 900,000 people smaller than would have been predicted in absence of the pandemic. That figure is more than twice as large as the published data would suggest. Furthermore, the backcast data show that the decline in LFPR was 0.9 percentage points rather than 0.6 percentage points the published numbers indicate.
Because incorporating the backcast into these hallmark estimates is consequential, we are providing the data and programs for others to incorporate a backcast into their work via Github.
Some of the strains in the economy today likely stem from the trends in the labor force highlighted here. Even as aggregate spending has long-since recovered to what could have been expected in absence of the pandemic, the growth of the labor force has not. As a result, the U.S. economy is constrained in its ability to meet current demand. Moreover, even if immigration fully rebounds that effect will likely be persistent because some of the people who died from COVID-19 would have been expected to remain in the labor force for decades to come. Further, if LFPRs among certain demographic groups continue to decline, most worrisome being the participation rates among prime-age white men, then recovery headwinds strengthen.
Ultimately, the amount of goods and services the U.S. produces will likely have to adjust to align with a smaller labor force. However, such challenges with regard to the size of the labor force would be mitigated if policies and other structural changes increased participation rates or if policies resulted in greater immigration. Both developments would increase the size of the labor force and help to offset the factors reducing the size of the labor force documented here.
1. See the Technical Appendix for details.
2. In reality, LFPRs within demographic groups have changed since 2019, but in ways that roughly offset each other, as rates for some groups have risen and rates for others have fallen (as shown in the next section). Consequently, the net effect of changes in LFPRs within demographic groups is roughly zero.
Acknowledgements: The authors thank Roxanna Edwards of the Bureau of Labor Statistics for providing information regarding the revised population control effects on the Current Population Survey. The authors thank Joshua Montes and Sofoklis Goulas for their helpful feedback.
