
The 2018 U.S. poverty rate is noteworthy for two reasons: it reflects a continued decline in the U.S. poverty rate since it hit a thirty-year peak in 2010; and, it marks the first time that the poverty rate has returned to pre-Great Recession levels. At 38.1 million people, or 11.8 percent of the population, the 2018 U.S. poverty rate was also statistically significantly lower than in 2017.
This analysis characterizes those who were living in poverty in 2018 and builds upon The Hamilton Project’s prior annual analyses of the characteristics of those living in poverty. We utilize the source of official poverty statistics, the U.S. Census Bureau’s Current Population Survey Annual Social and Economic Supplement (as released by IPUMS), which is defined as a household’s pre-tax income falling below a threshold set by the current value of three times a minimum food diet in 1963, adjusted by family composition.
It is important to note that the official poverty measure only includes pre-tax income, unlike the supplemental poverty measure which includes refunded taxes and benefits like SNAP. This supplemental measure shows fewer people, notably children, in poverty than does the official measure. The official poverty measure is an imperfect but useful means for tracking the types of people with very low incomes over time and remains central to determining access to means-tested programs.
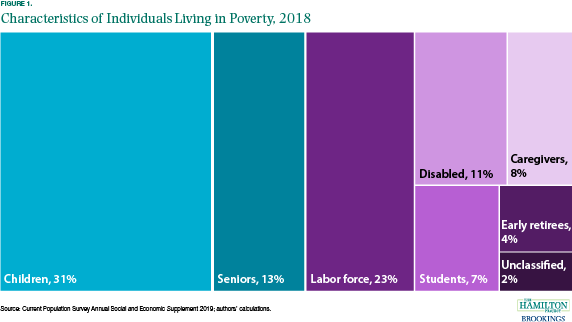
Looking at the whole population of individuals living in poverty in 2018 (figure 1), we show that more than half of those living in poverty in 2018 were working-age adults between the ages of 18 and 64 (shown in purple below). Just under a third of those living in poverty in 2018 were children, while approximately one-eighth were seniors; this represents a 1 percentage point increase for seniors from 2017 to 2018 and a 1 percentage point decrease for children as shares of those living in poverty.
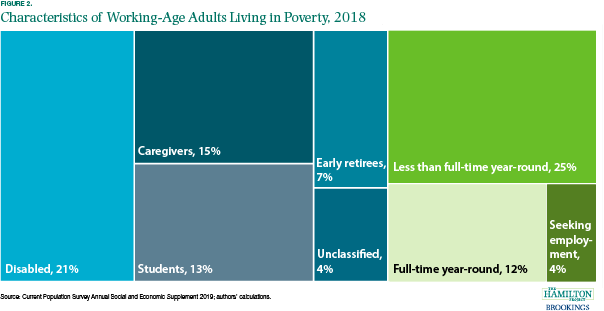
Considering only those living in poverty who were of working age (figure 2), about 40 percent were labor force participants (shown in green below) and 60 percent were not labor force participants (shown in blue below). Nearly all of those out of the labor force provided one of four main reasons for their nonparticipation: disability, caregiving for a family member, being a student, or early retirement. One fifth of working-age adults in poverty were not participating in the labor force due to disability, 15 percent were caregivers, and 13 percent were full-time students; these groups made up 82 percent of those in poverty who were out of the labor force. These characteristics of working-age adults living in poverty have remained largely consistent since 2017.
There has been an increase in the share of labor force nonparticipation among the working-age poor over the last few decades. In 1988, 55 percent of working-age adults in poverty were in the labor force compared to just 40 percent today. Still, it is noteworthy that a large share of those in poverty are working. In fact, 12 percent of working-age adults in poverty in 2018 had full-time full-year employment, but their wages were not enough to lift them out of poverty (in some cases, transfer programs like the Earned Income Tax Credit lift these individuals out of poverty based on other measures). A much larger share of working-age adults in poverty worked less than full-year full-time.
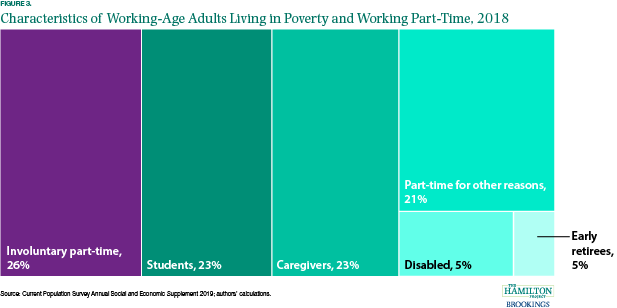
As of March 2019, 2.78 million working-age adults were living in poverty and working part-time in the past week. According to figure 3, more than one quarter of working-age adults living in poverty and working part-time were doing so involuntarily (shown in purple below)—they would prefer full-time work (and are available full-time) but report being unable to obtain it. As the economy has continued to strengthen, this group has become a smaller share of those in poverty. This population has declined from 33 percent to 26 percent of working-age adults living in poverty and working part-time since 2016. Just under half (46 percent) of adults in poverty working part-time were juggling academic or family commitments.
Since 2017, poverty rates for children under age 18 decreased 1.2 percentage points to 16.2 percent, a continuation of a welcome trend. Our analysis shows that the bulk of these children are in households where at least one adult is in the labor force, but their income alone is not enough to lift the family out of poverty.
Figure 4 classifies children living in poverty by the labor force characteristics of the adults in their household in select years: 1988, 1998, 2008, and 2018. We assign children to exclusive categories based on whether they live in a household with at least one adult who worked full-time year-round, worked less than full-time, or was seeking employment; if no adults in the household were in the labor force, then we categorize children based on whether the child was living with a student, disability, caregiver, a retiree, or unclassified.
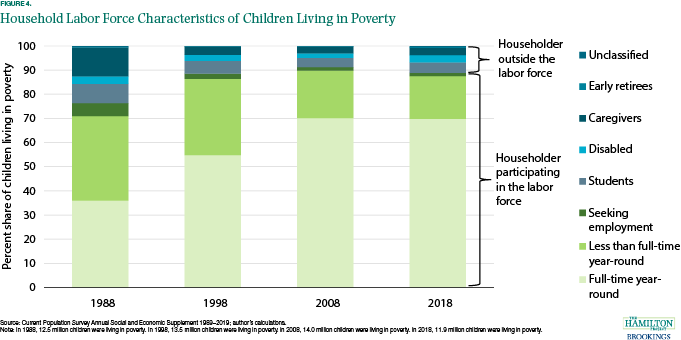
Over the last few decades, more and more children in poverty are in households with an adult in the labor force. Over the past thirty years, the share of children in poverty (based on the official poverty measure) living in households where at least one adult participates in the labor force has increased from 76.4 percent in 1988 to 89.4 percent in 2018. In 1988, about equal shares of children were living in households where there was at least one full-time worker or at least one part-time worker, and the share of children living with at least one adult working full-time has increased from 36 percent in 1988 to 70 percent in 2018. This increase underscores that employment is insufficient to lift many families out of poverty based on their incomes alone, highlighting the need for robust safety net programs, higher wages, or both.
The increase over time in children in poverty living with parents participating in the labor force implies a decline in the share of children living in a household where no one works. This reduction is especially driven by nonparticipation due to student or caregiver status; the share of poor children living with parents who are students has decreased by twofold while the share living with parents who are caregivers has decreased by fourfold since 1988.
A new National Academies Consensus Study Report, “A Roadmap to Reducing Child Poverty,” documents the widespread costs of child poverty and identifies potential policy levers for cutting child poverty rates in half. As the report and recent analysis from the Center on Budget and Policy Priorities show, tax and transfer programs lift millions of children out of poverty. Hamilton Project policy proposals that would support women’s economic participation, increase the returns to work, and directly address poverty offer actionable paths toward increasing household resources for children.