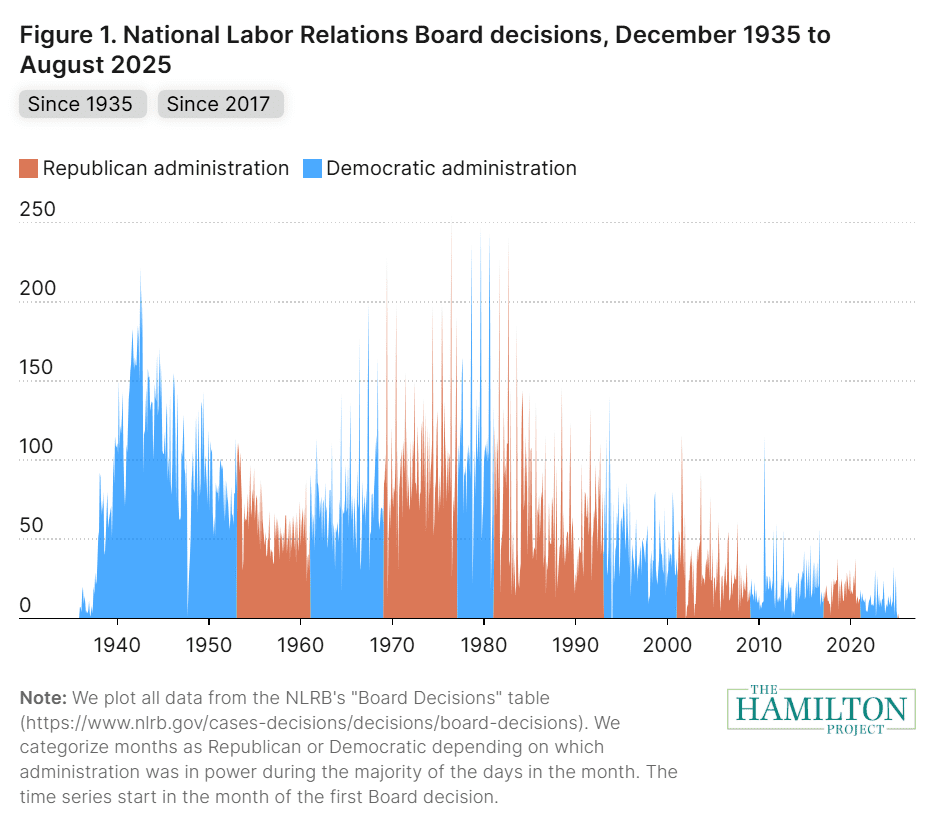
"Tracking National Labor Relations Board actions through its administrative data"
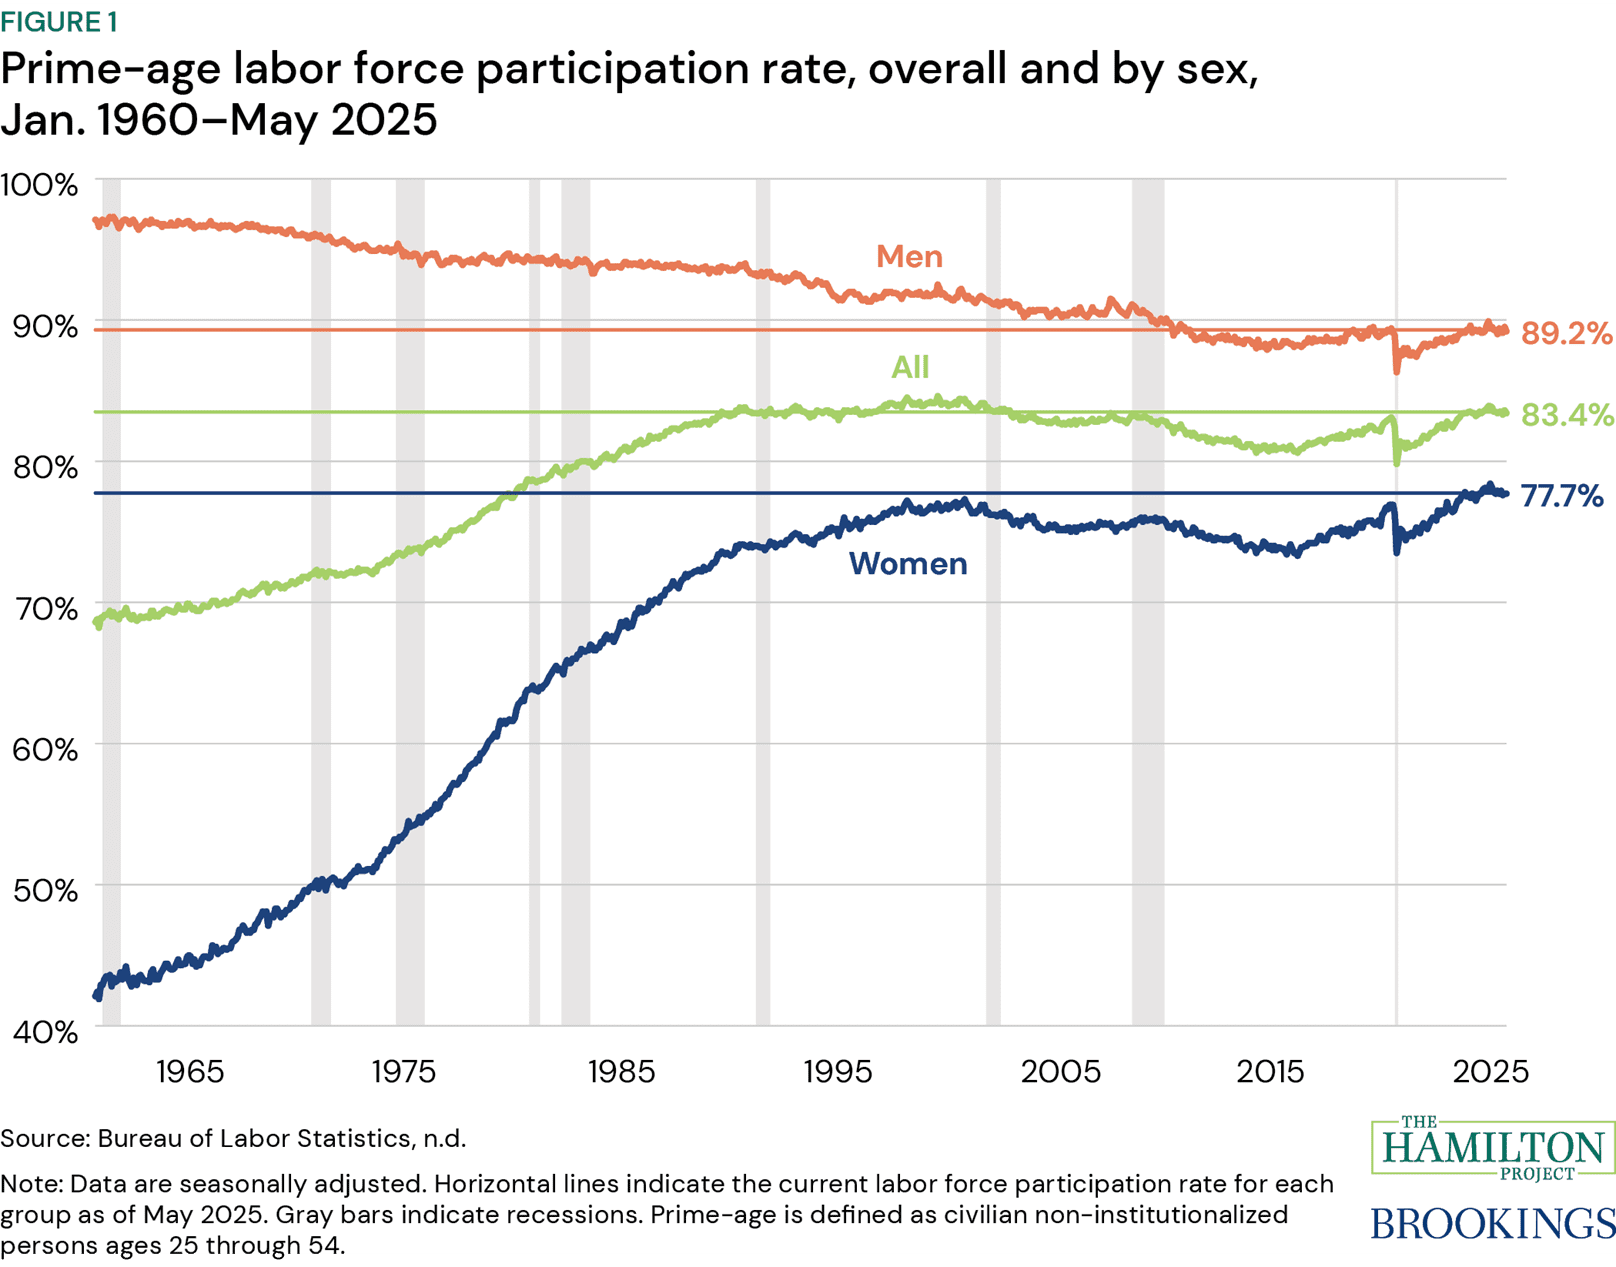
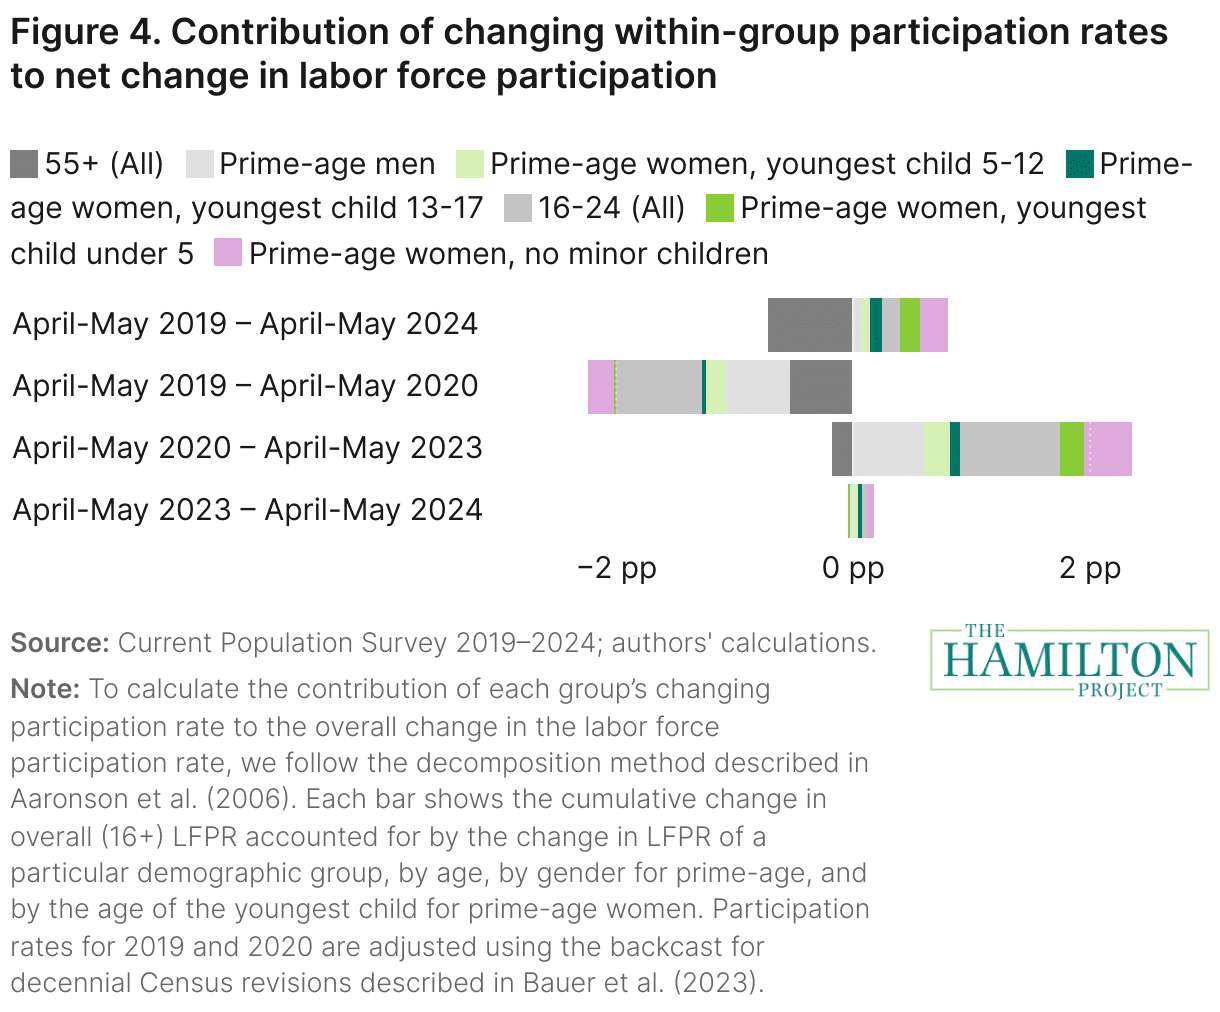
"Seven economic facts about prime-age labor force participation"
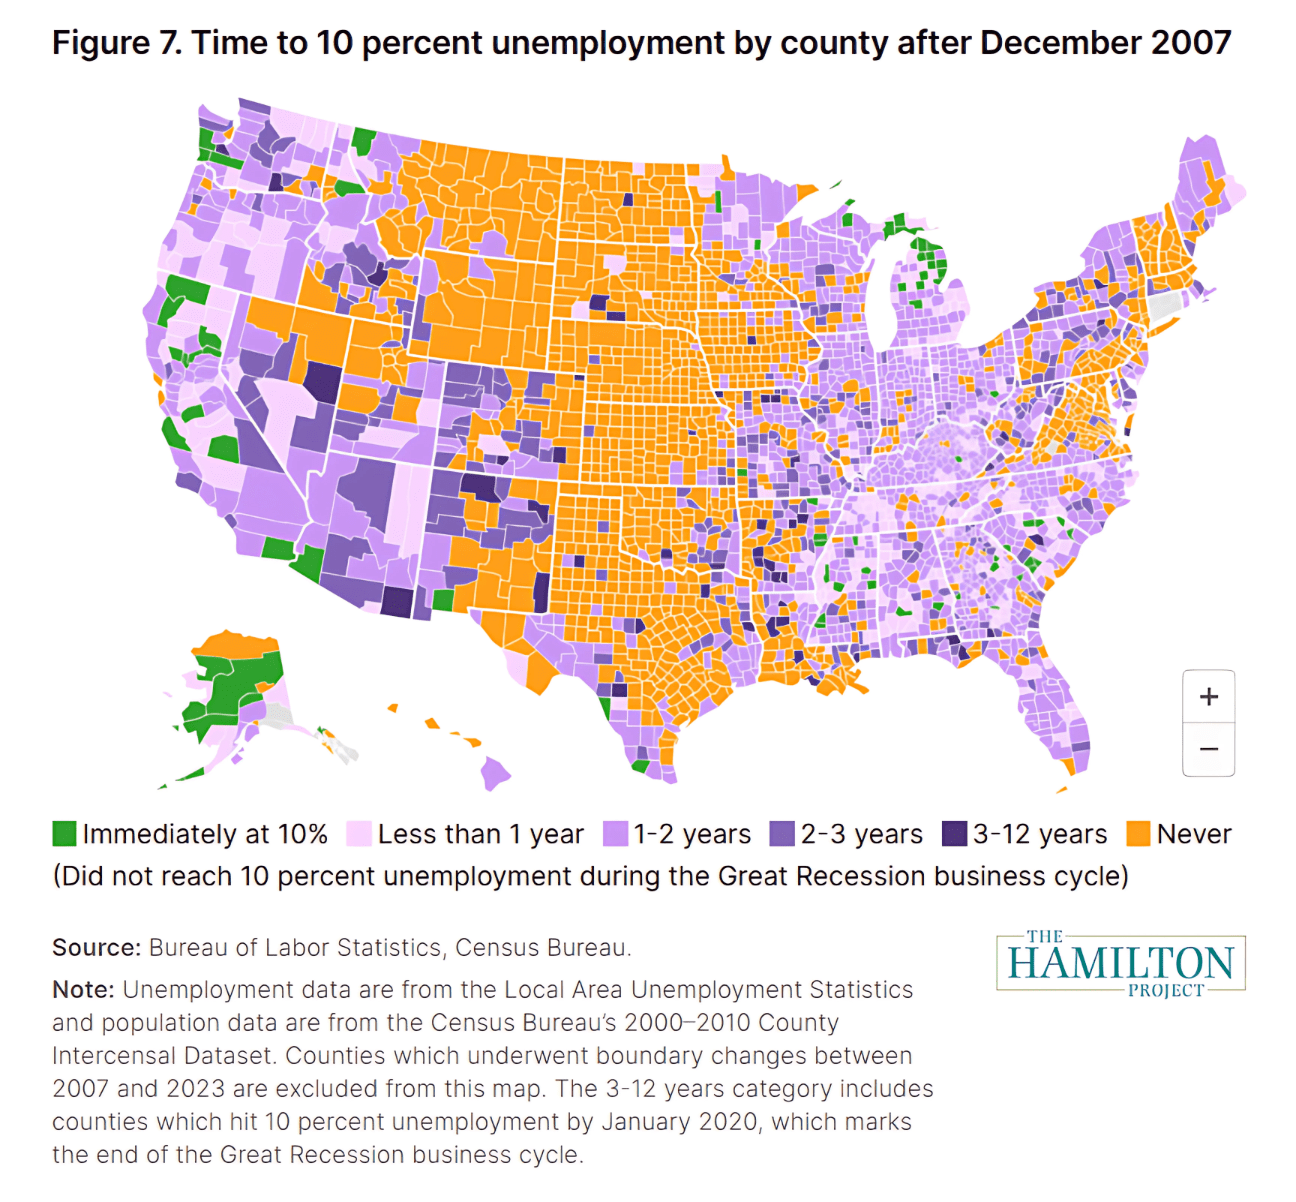
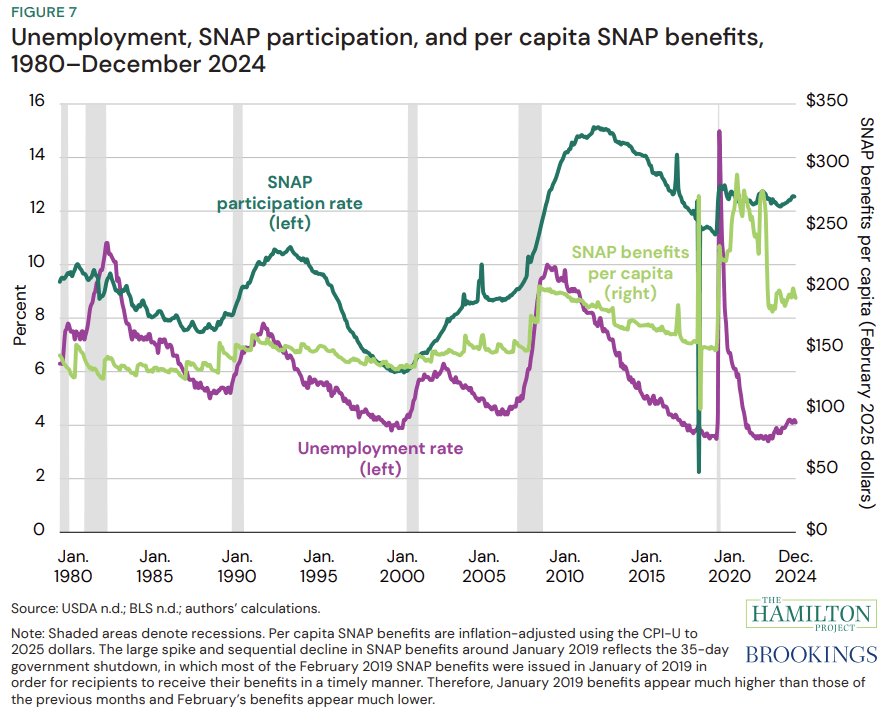
"Proposed SNAP cuts would permanently undermine recession readiness and responsiveness"
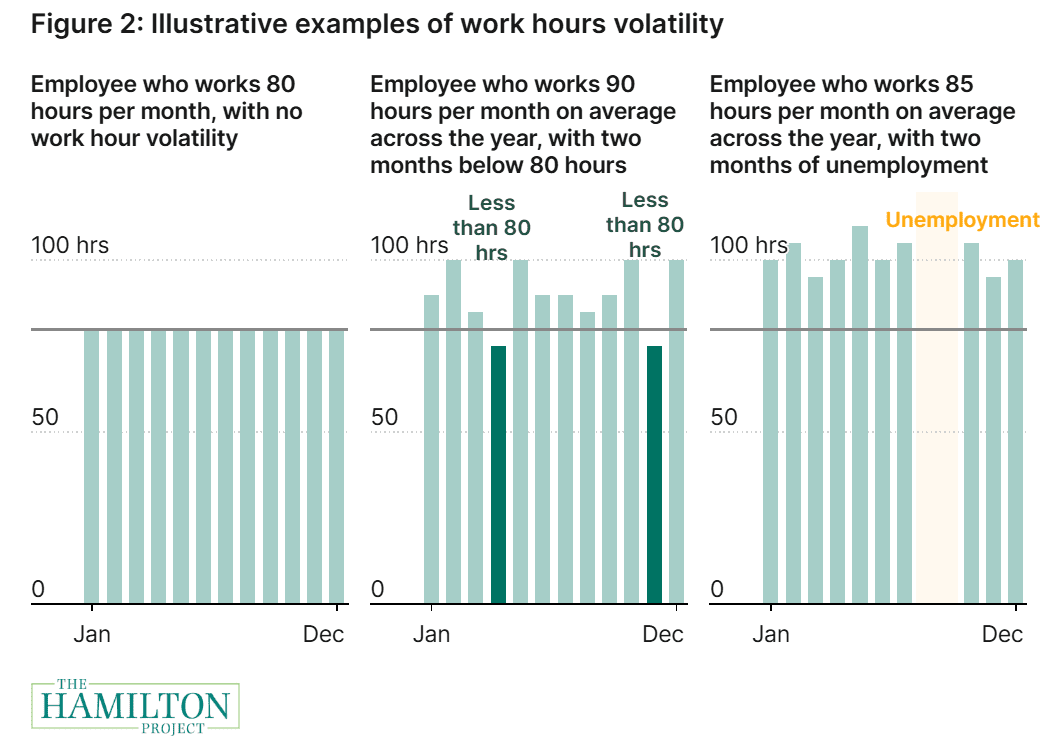
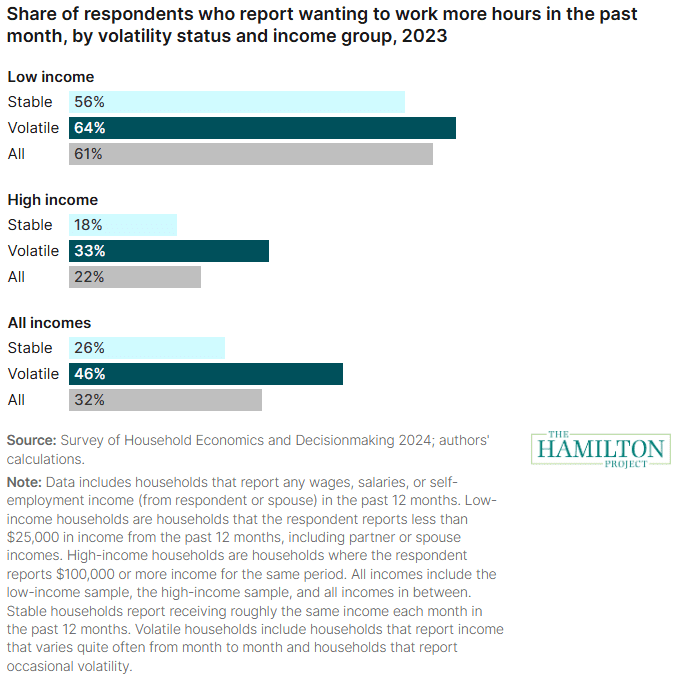
"Work requirements penalize workers in volatile occupations"
"A primer on SNAP work requirements"
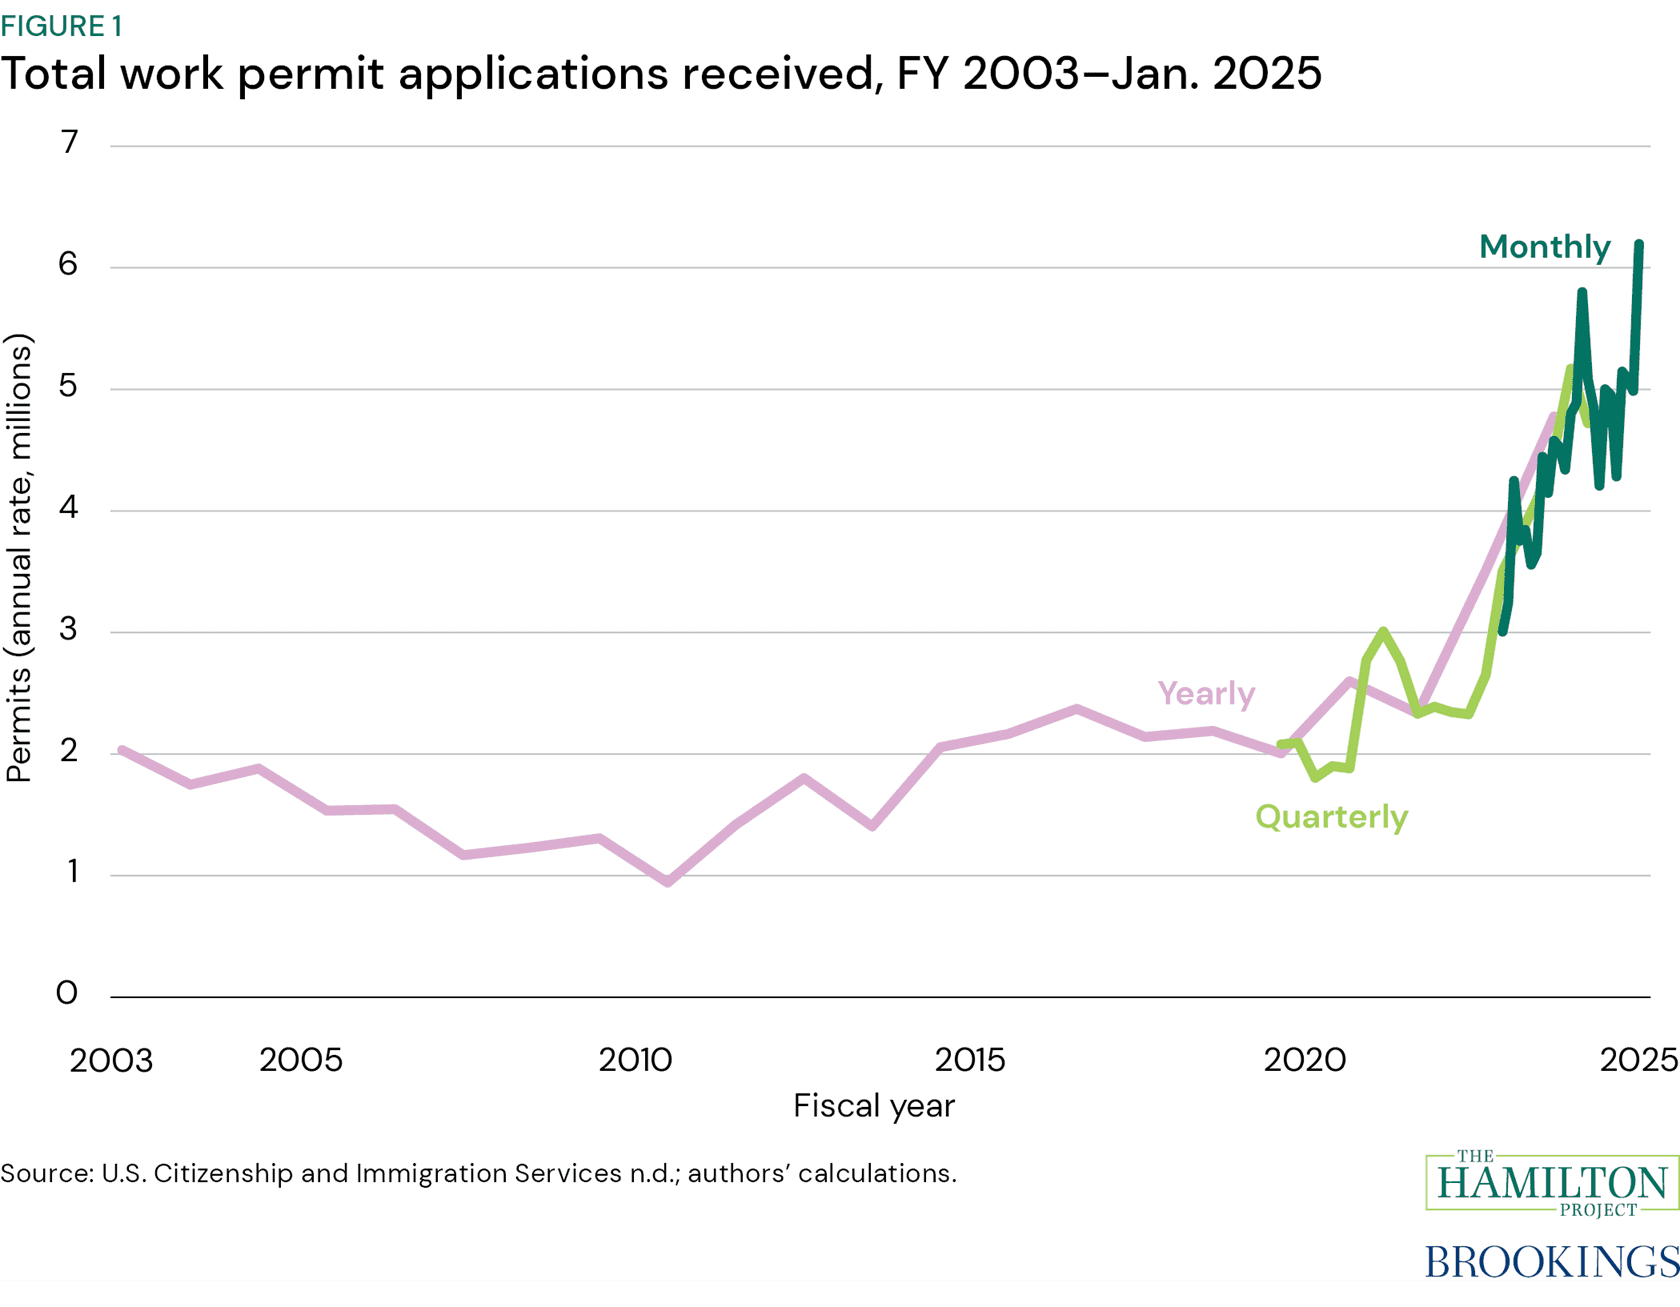
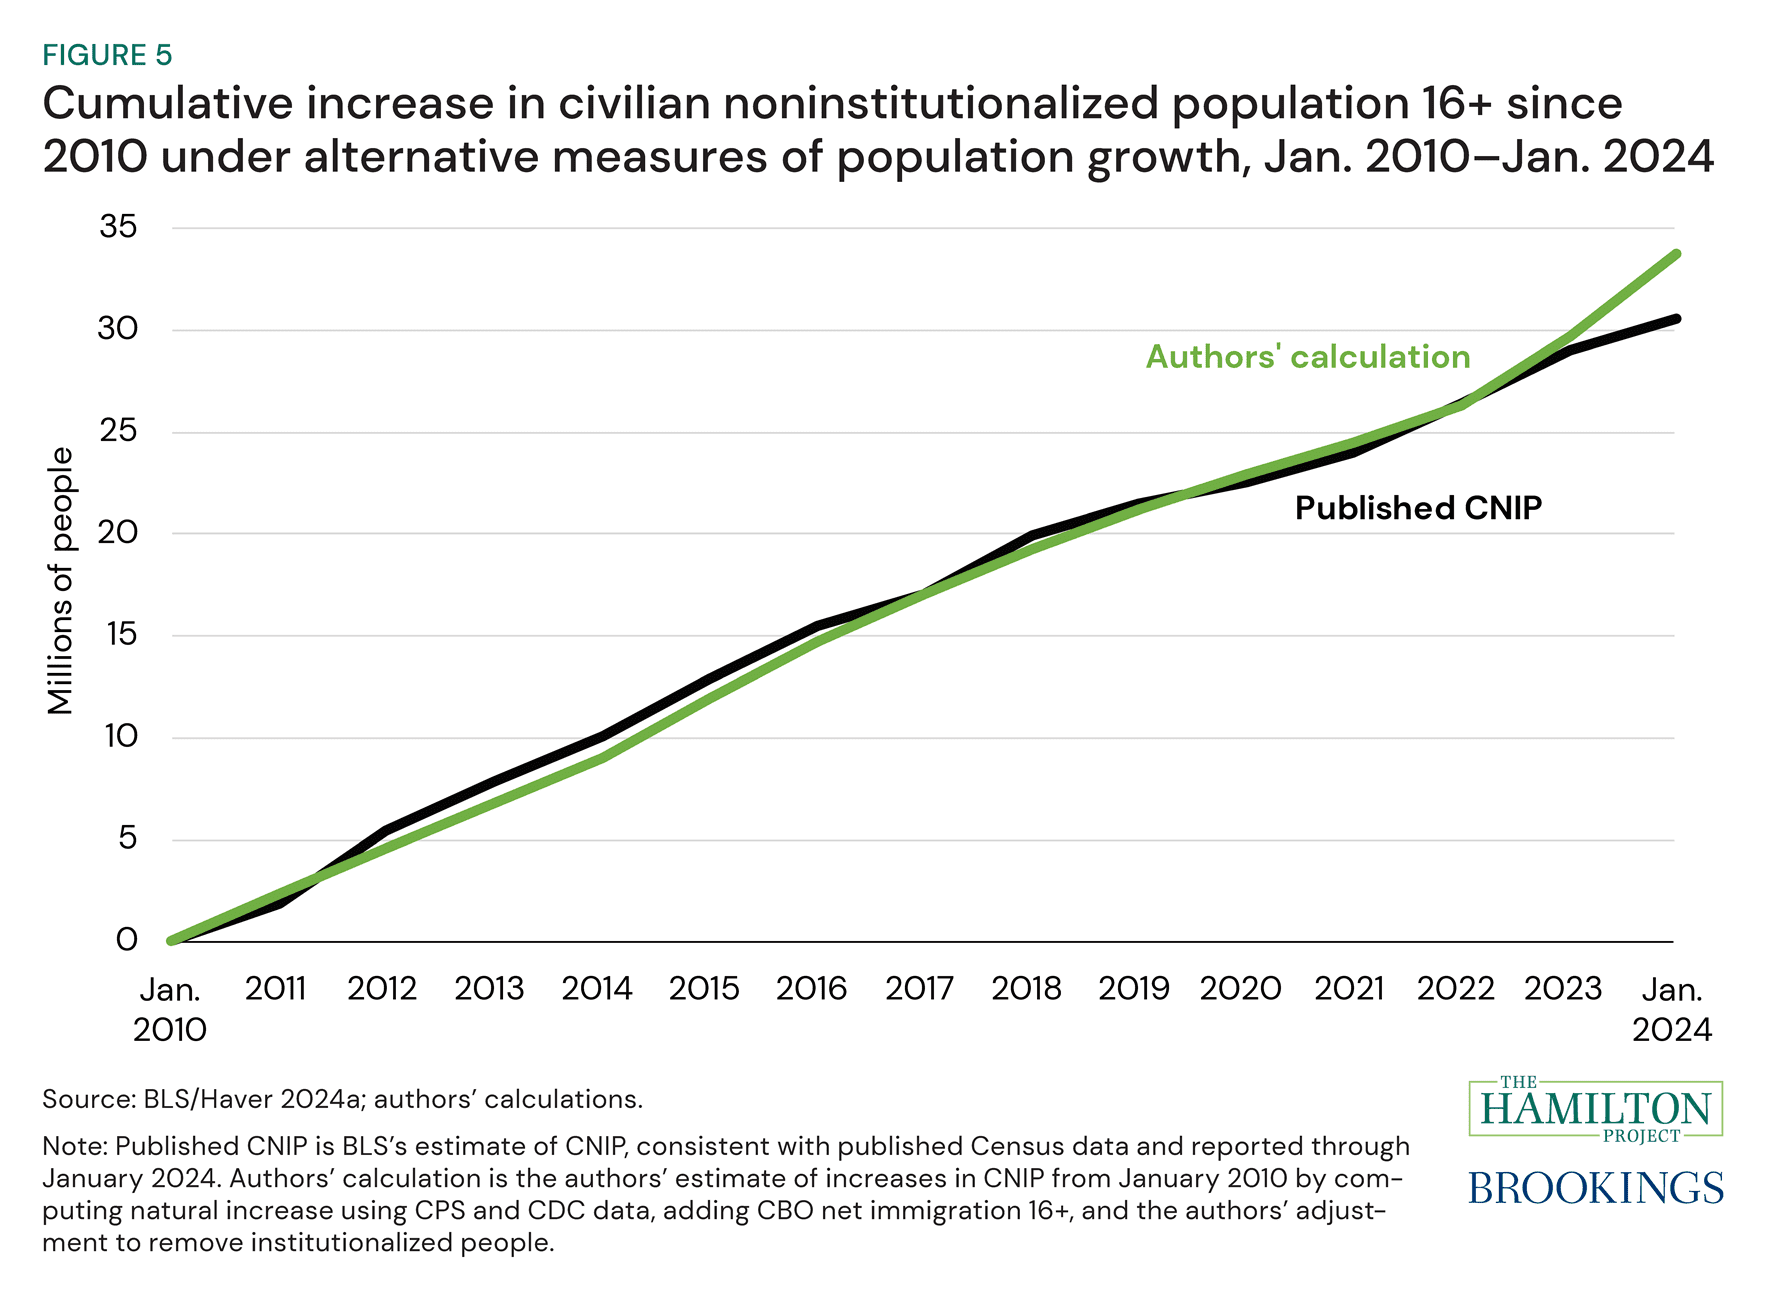
"Work permit applications suggest prior immigration is still pushing up labor supply—for now"
"Low-income workers experience—by far—the most earnings and work hours instability"
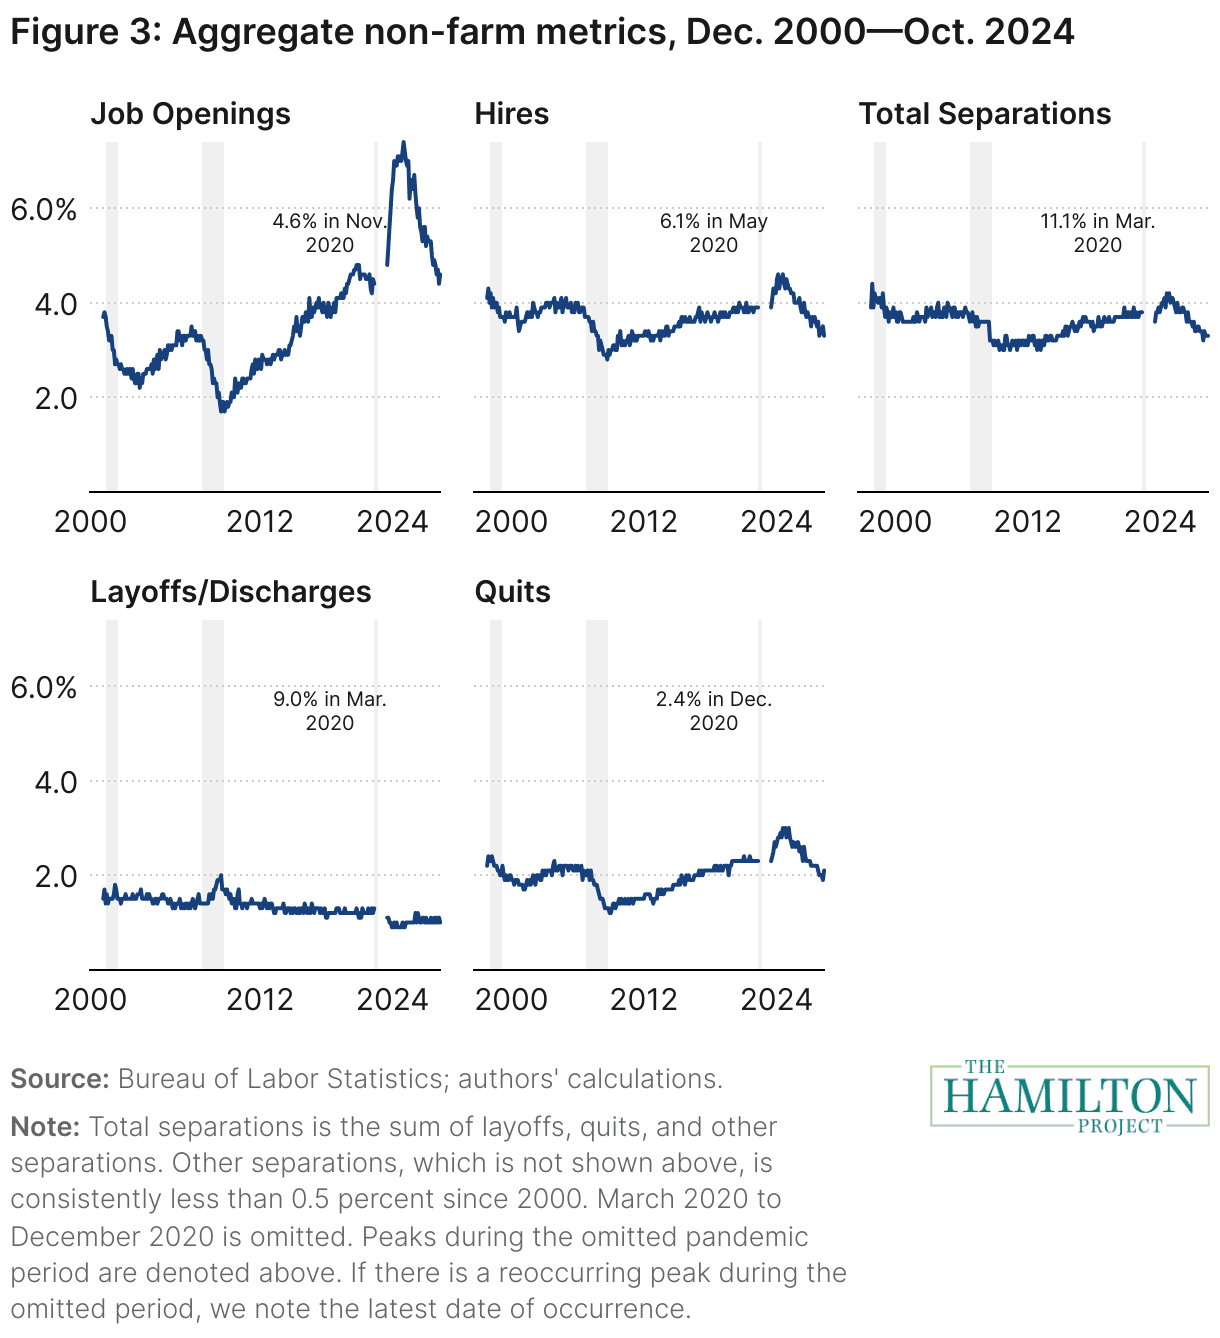
"The softening labor market is still growing"
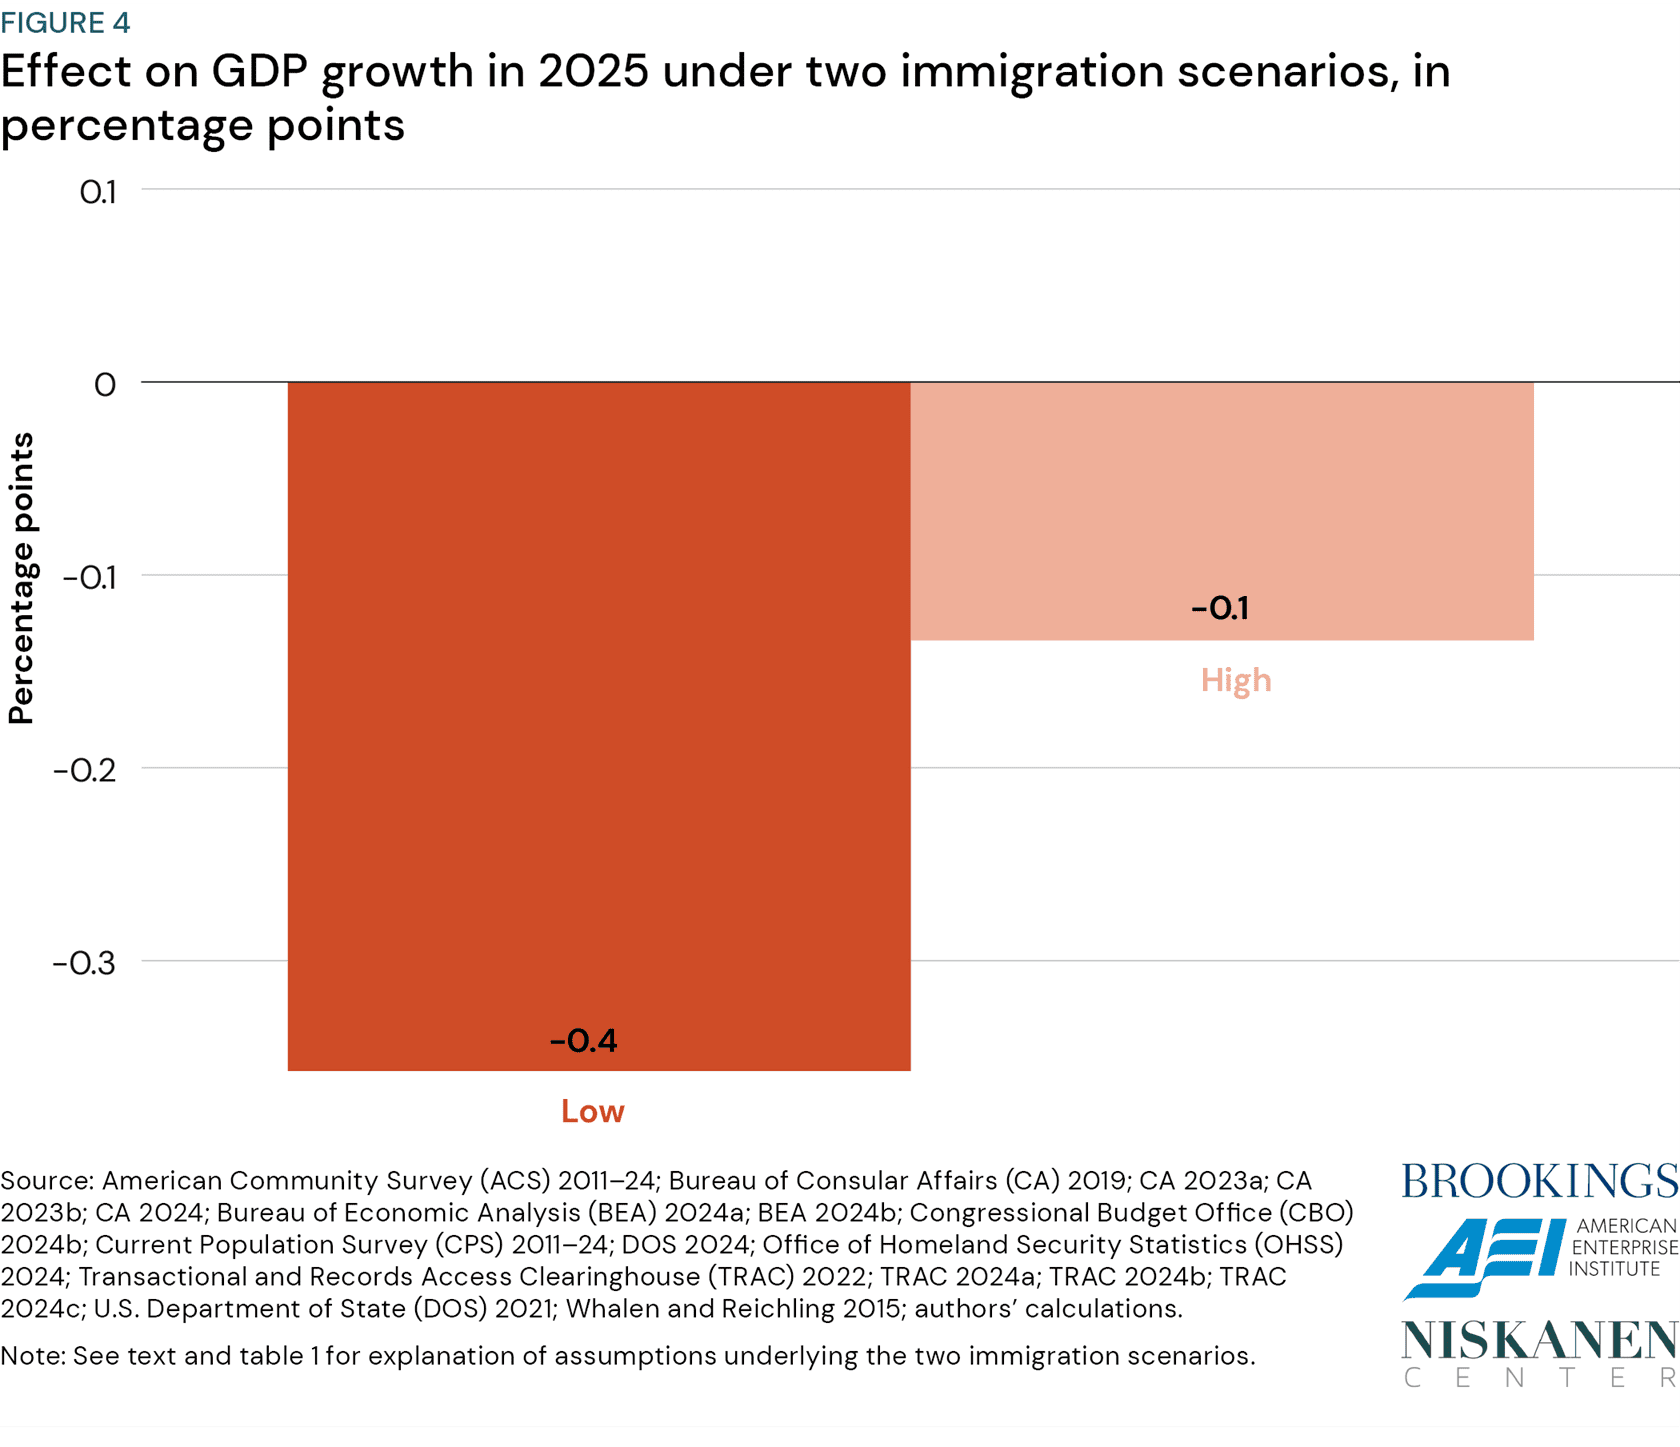
"Immigration and the macroeconomy in the second Trump administration"
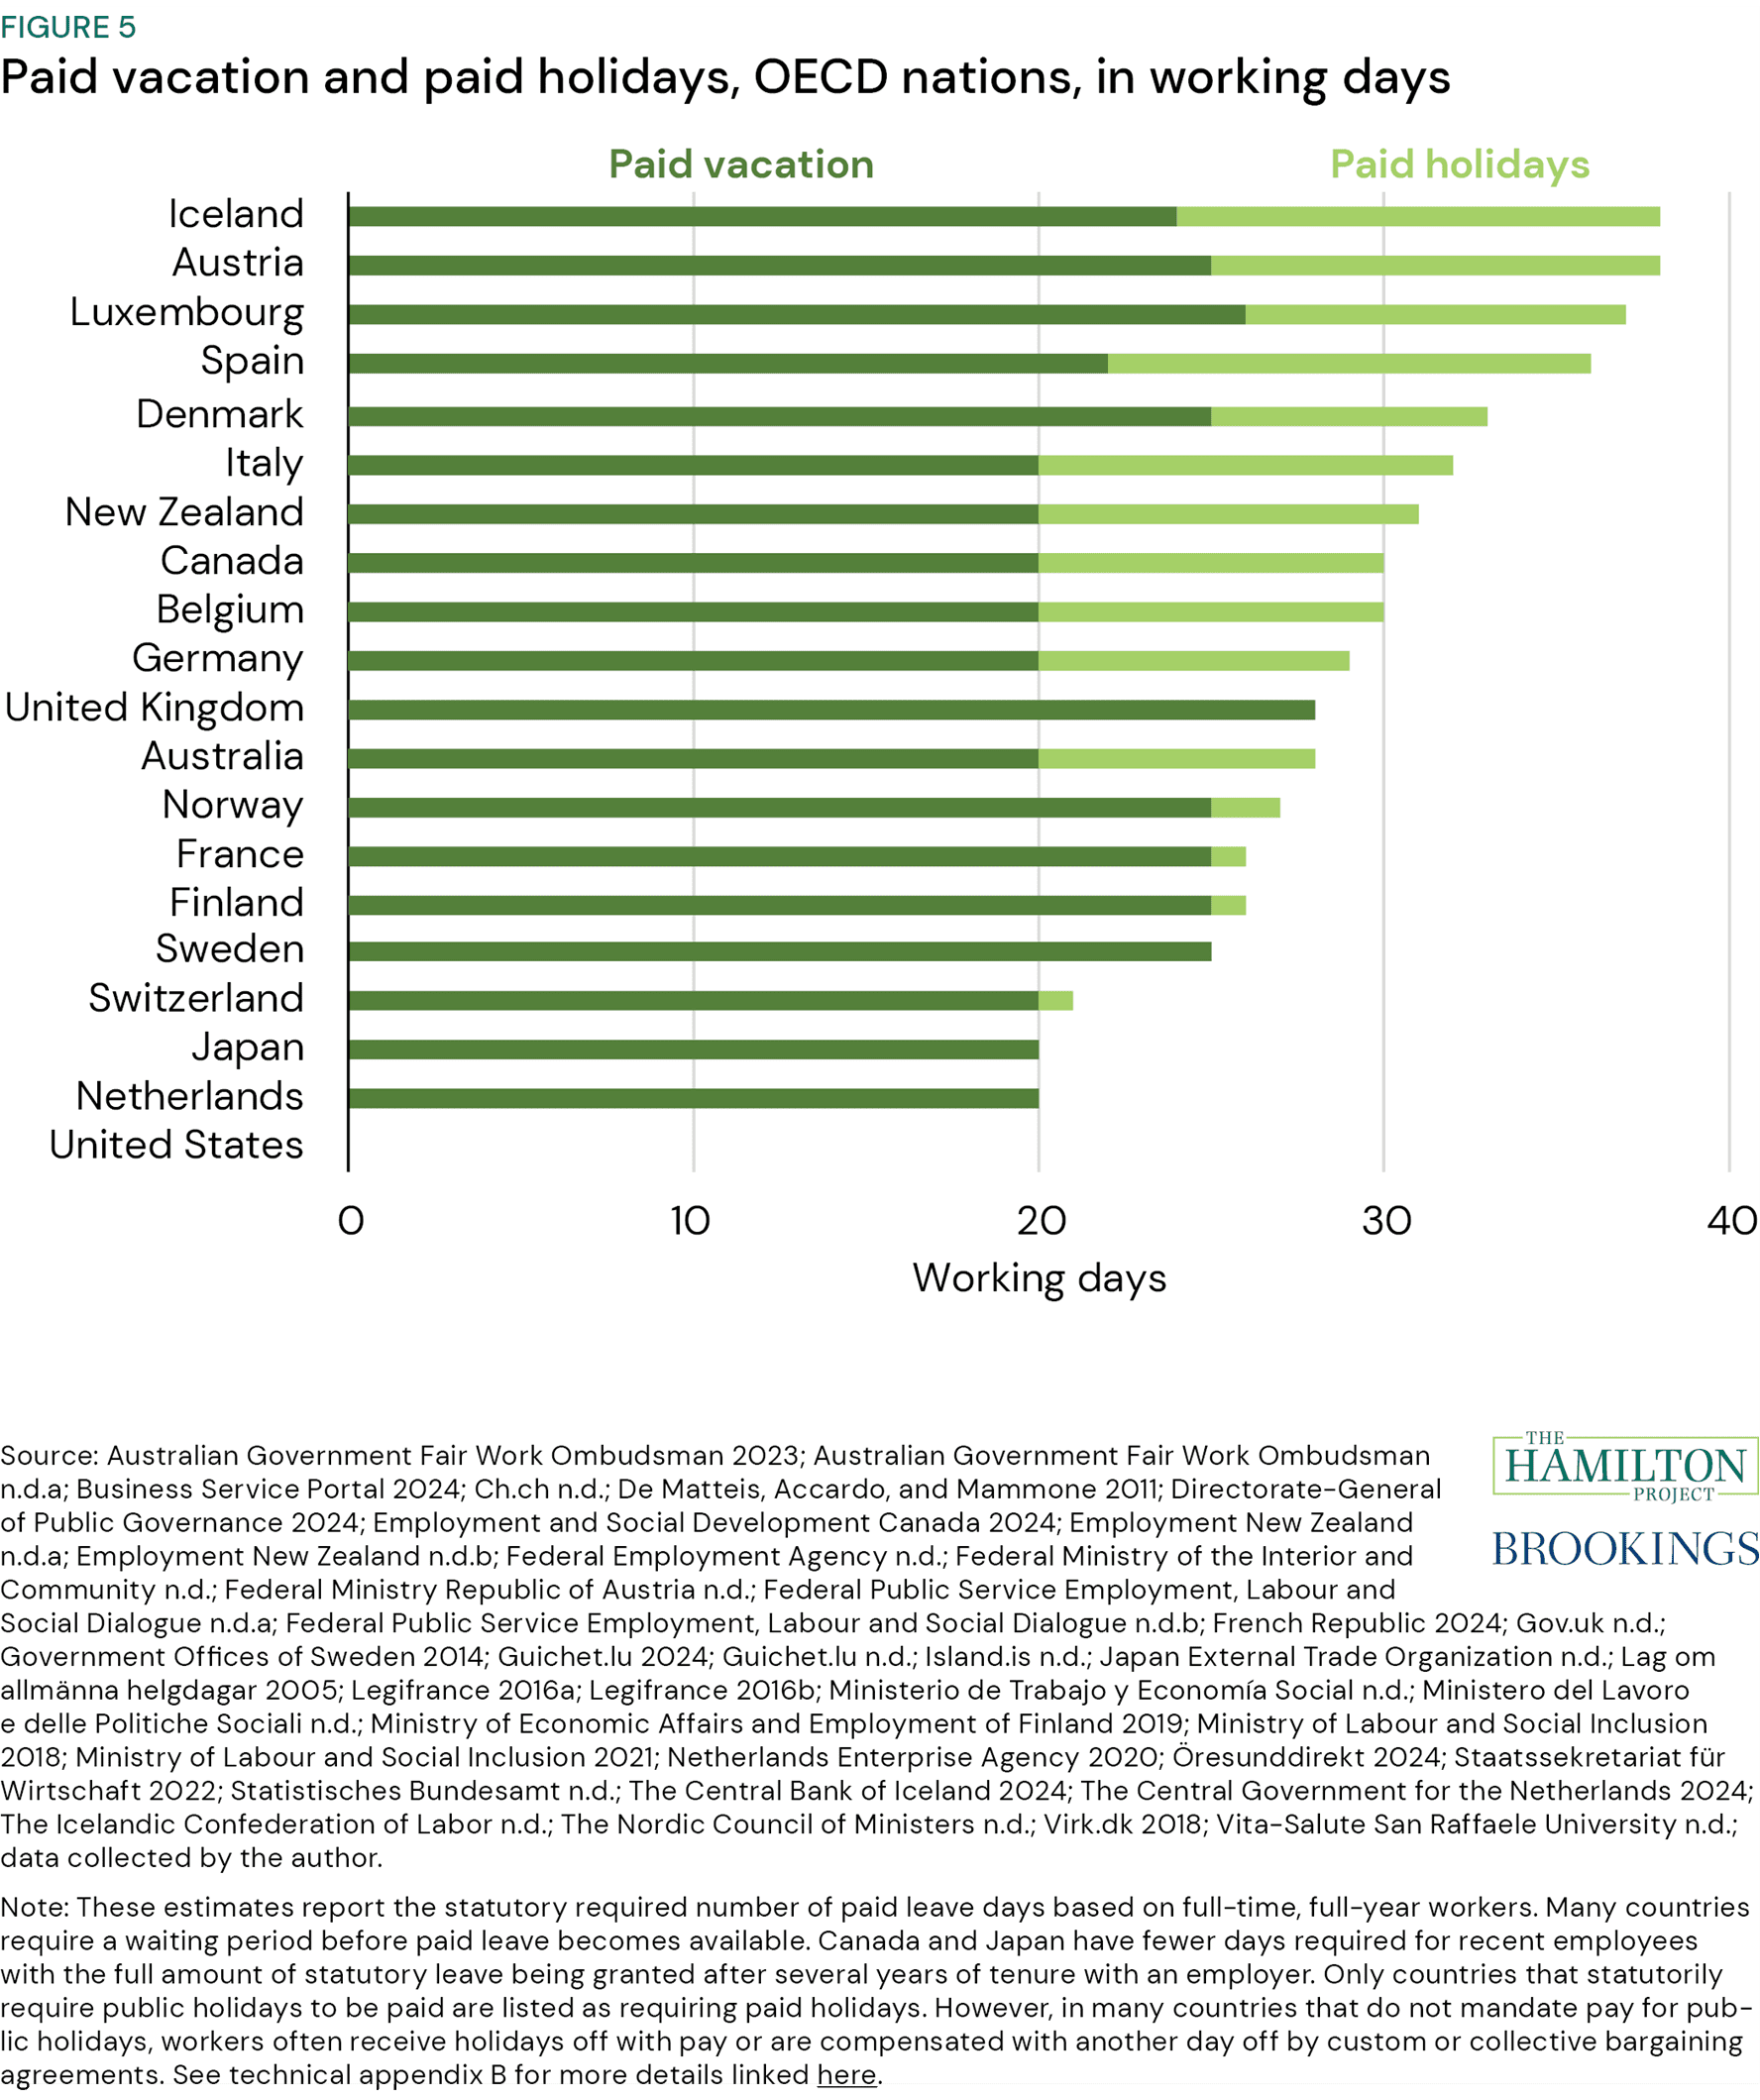
"A federal guarantee for earned paid time off"
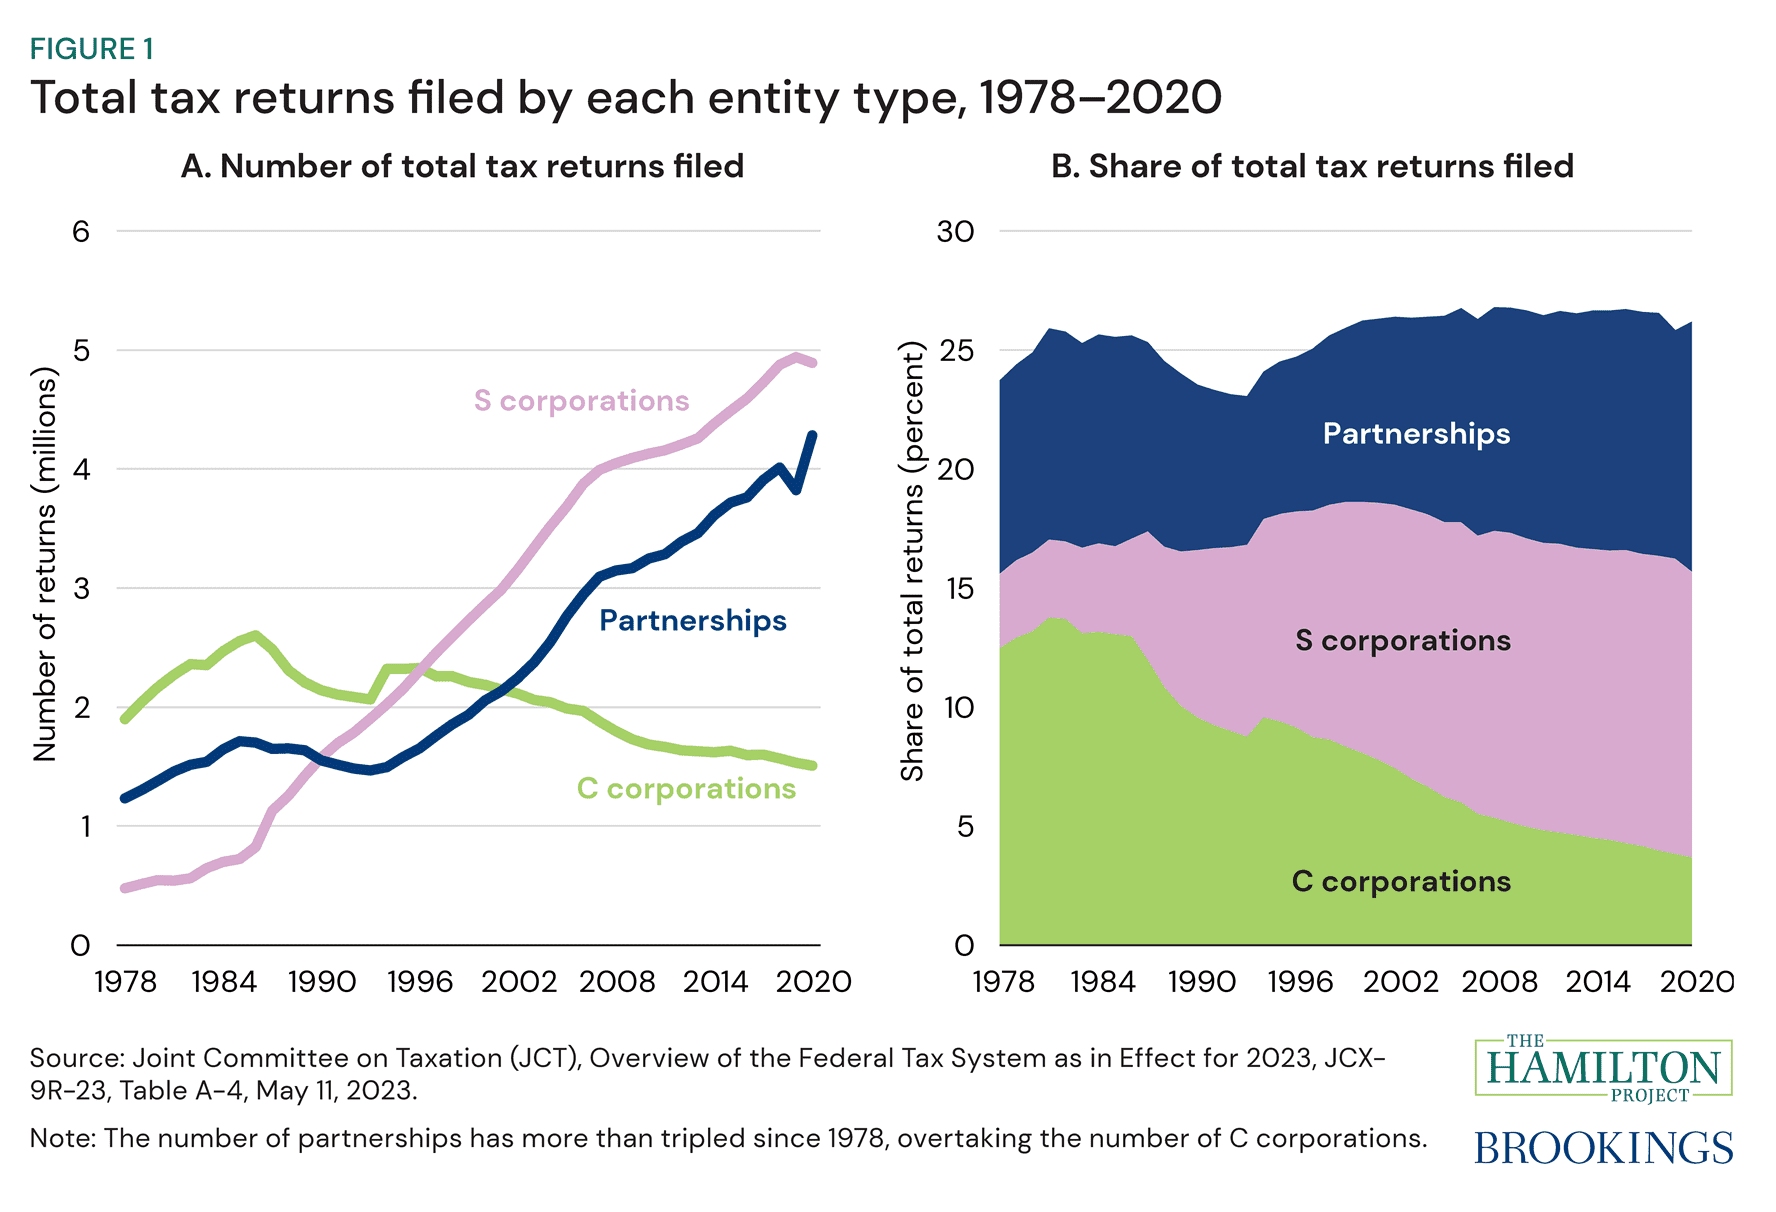
"Modernizing partnership taxation"
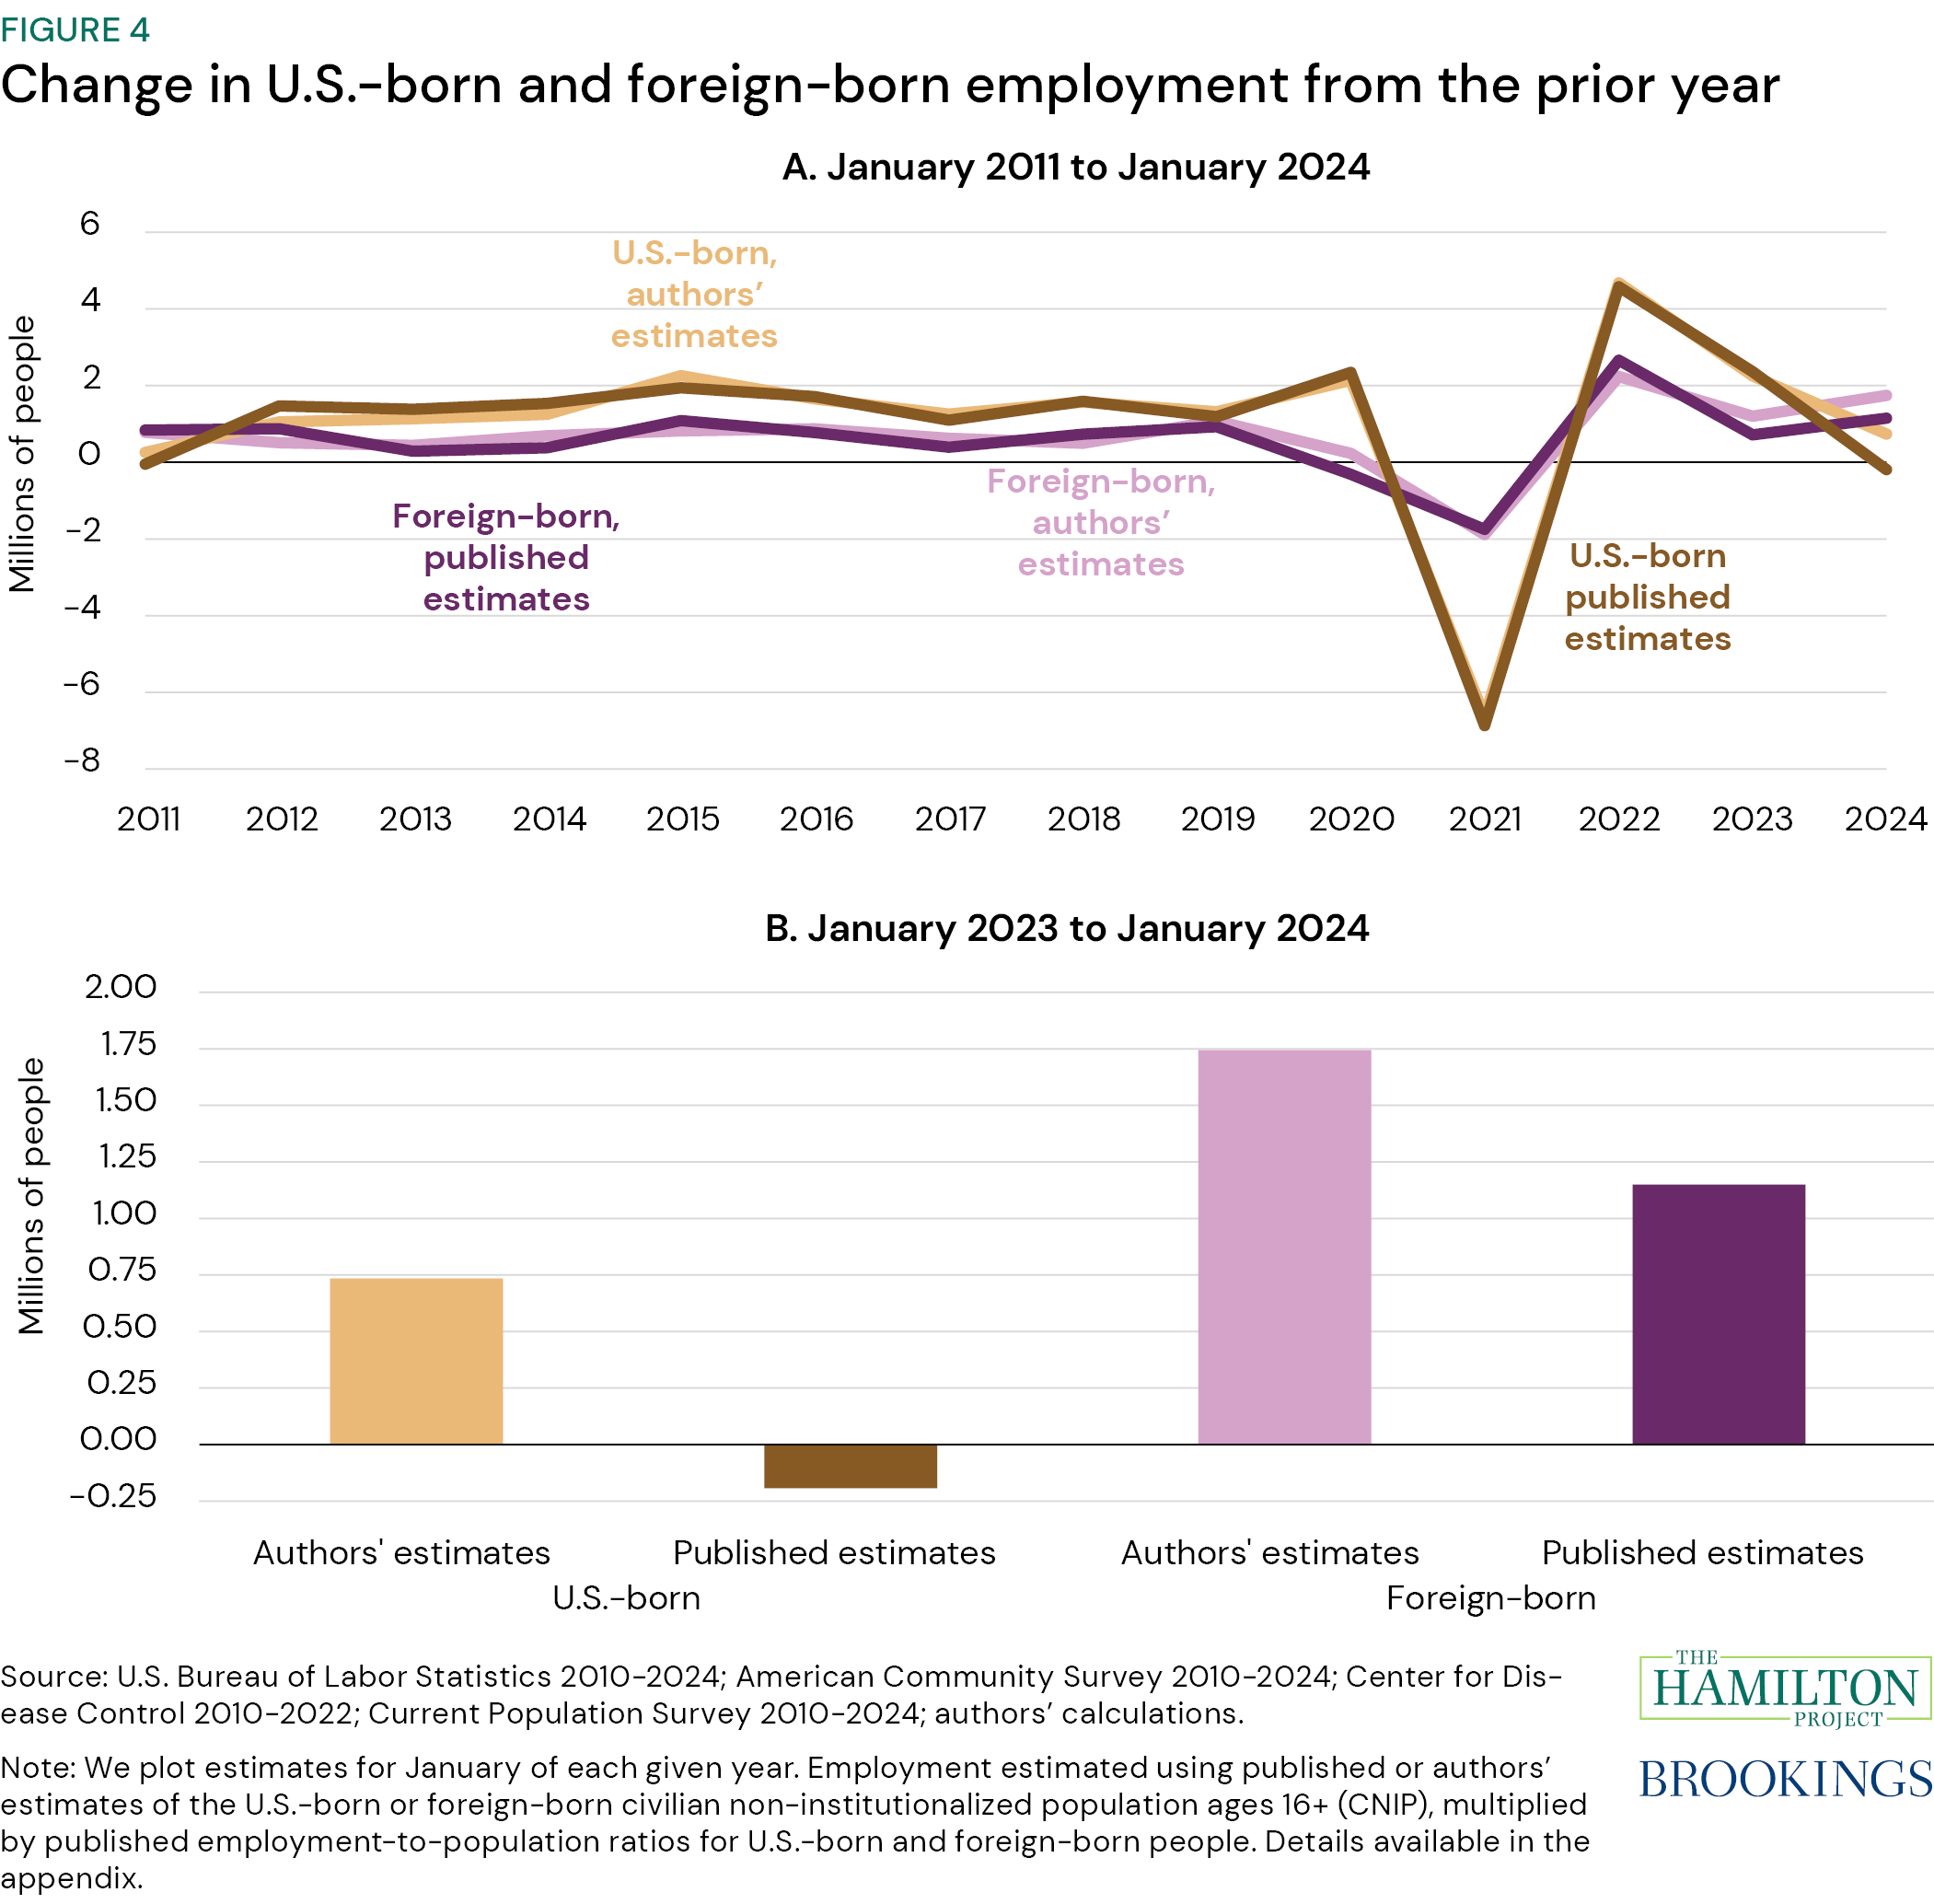
"The strong labor market has boosted US-born employment"
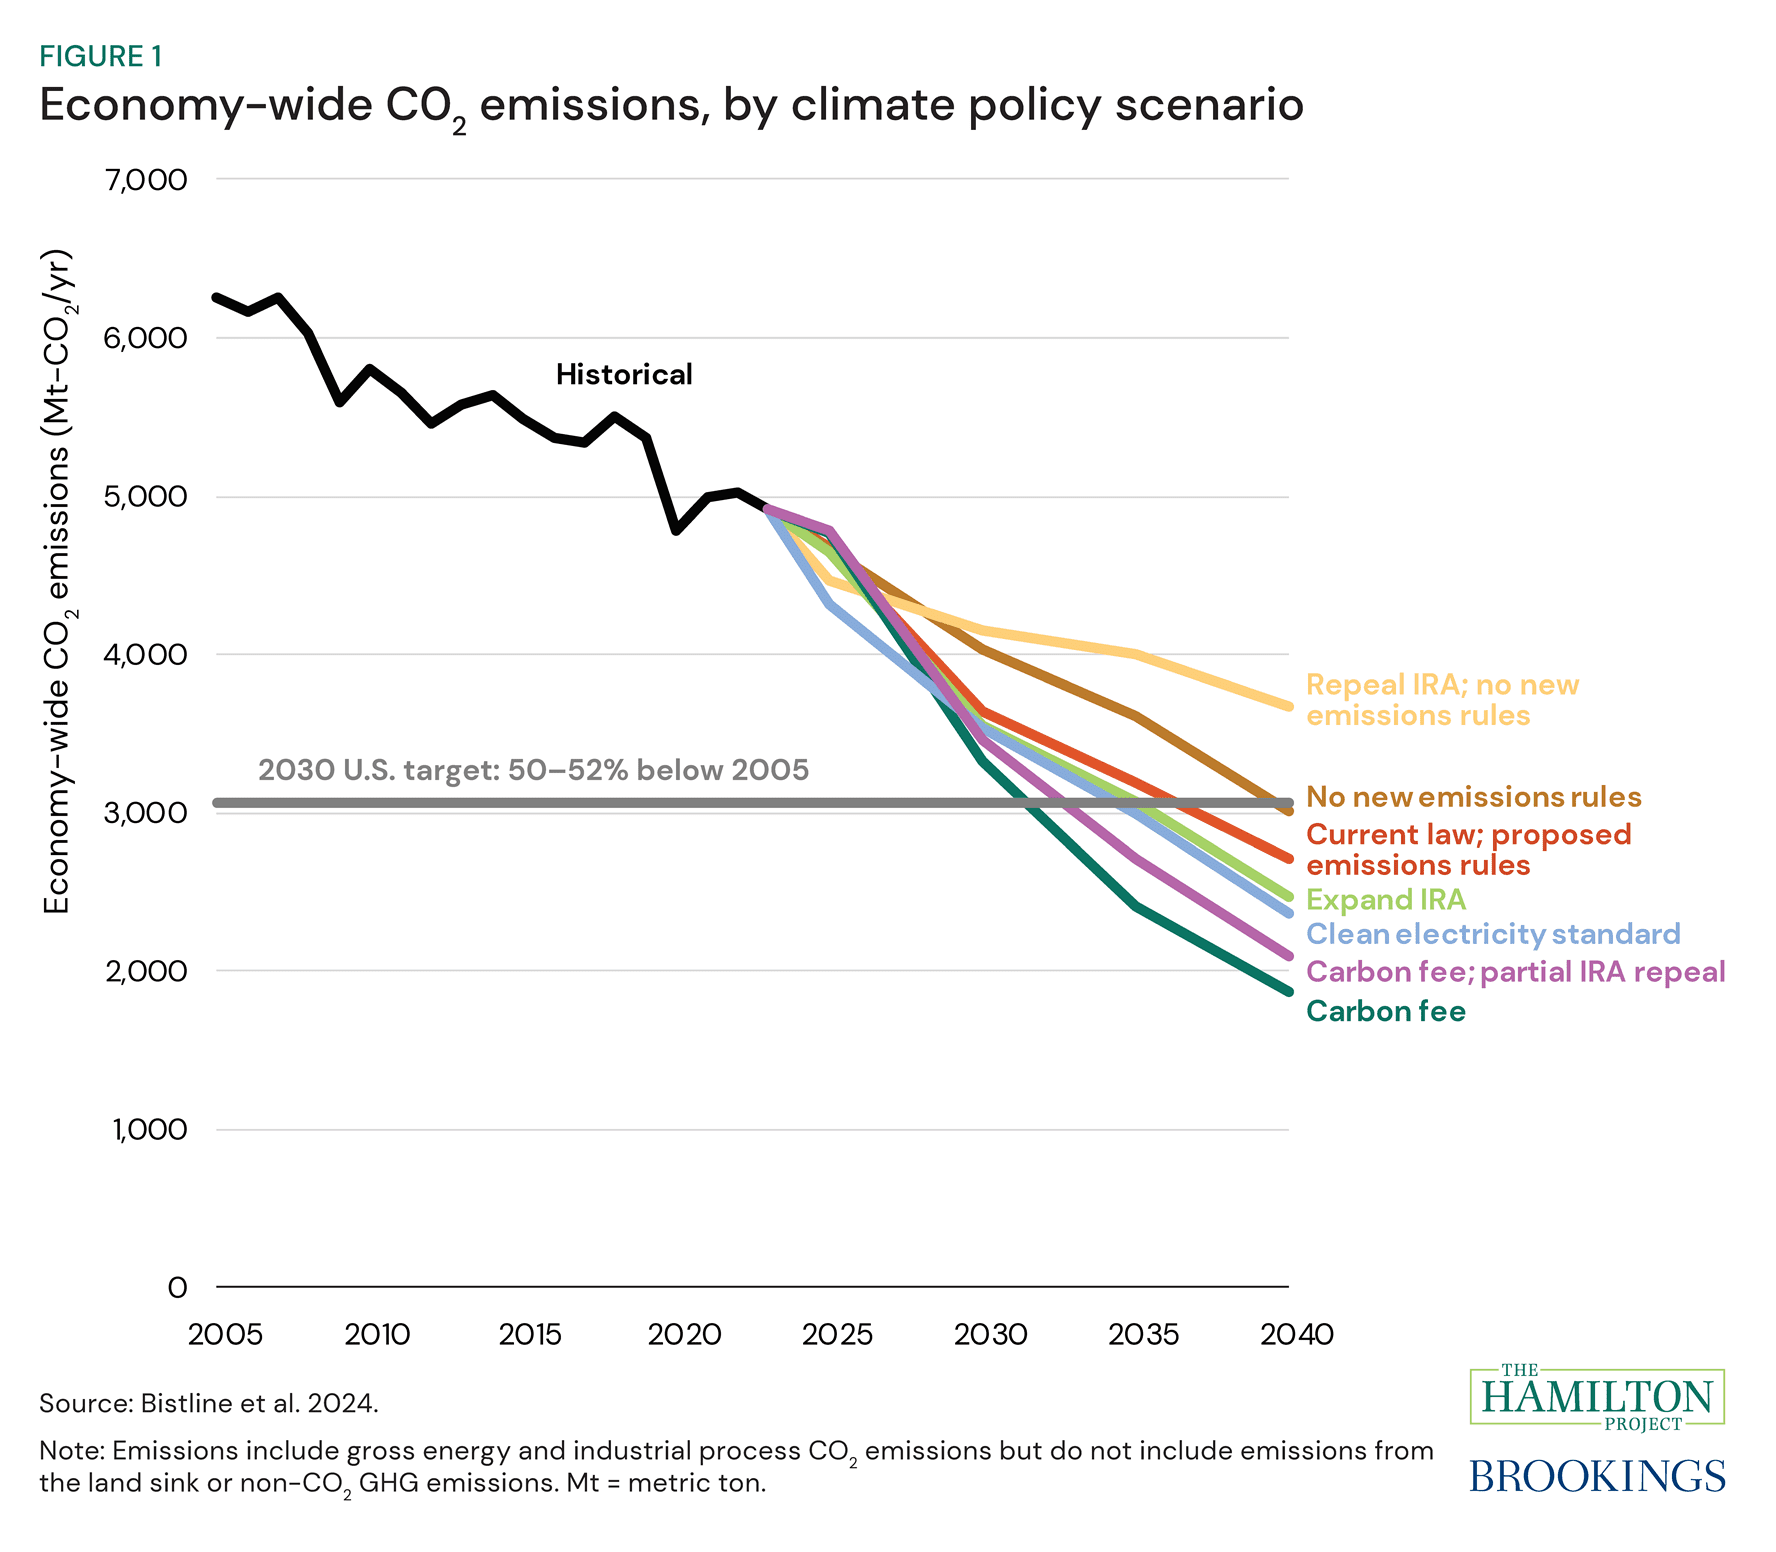
"Climate tax policy reform options in 2025"
"New immigration estimates help make sense of the pace of employment"
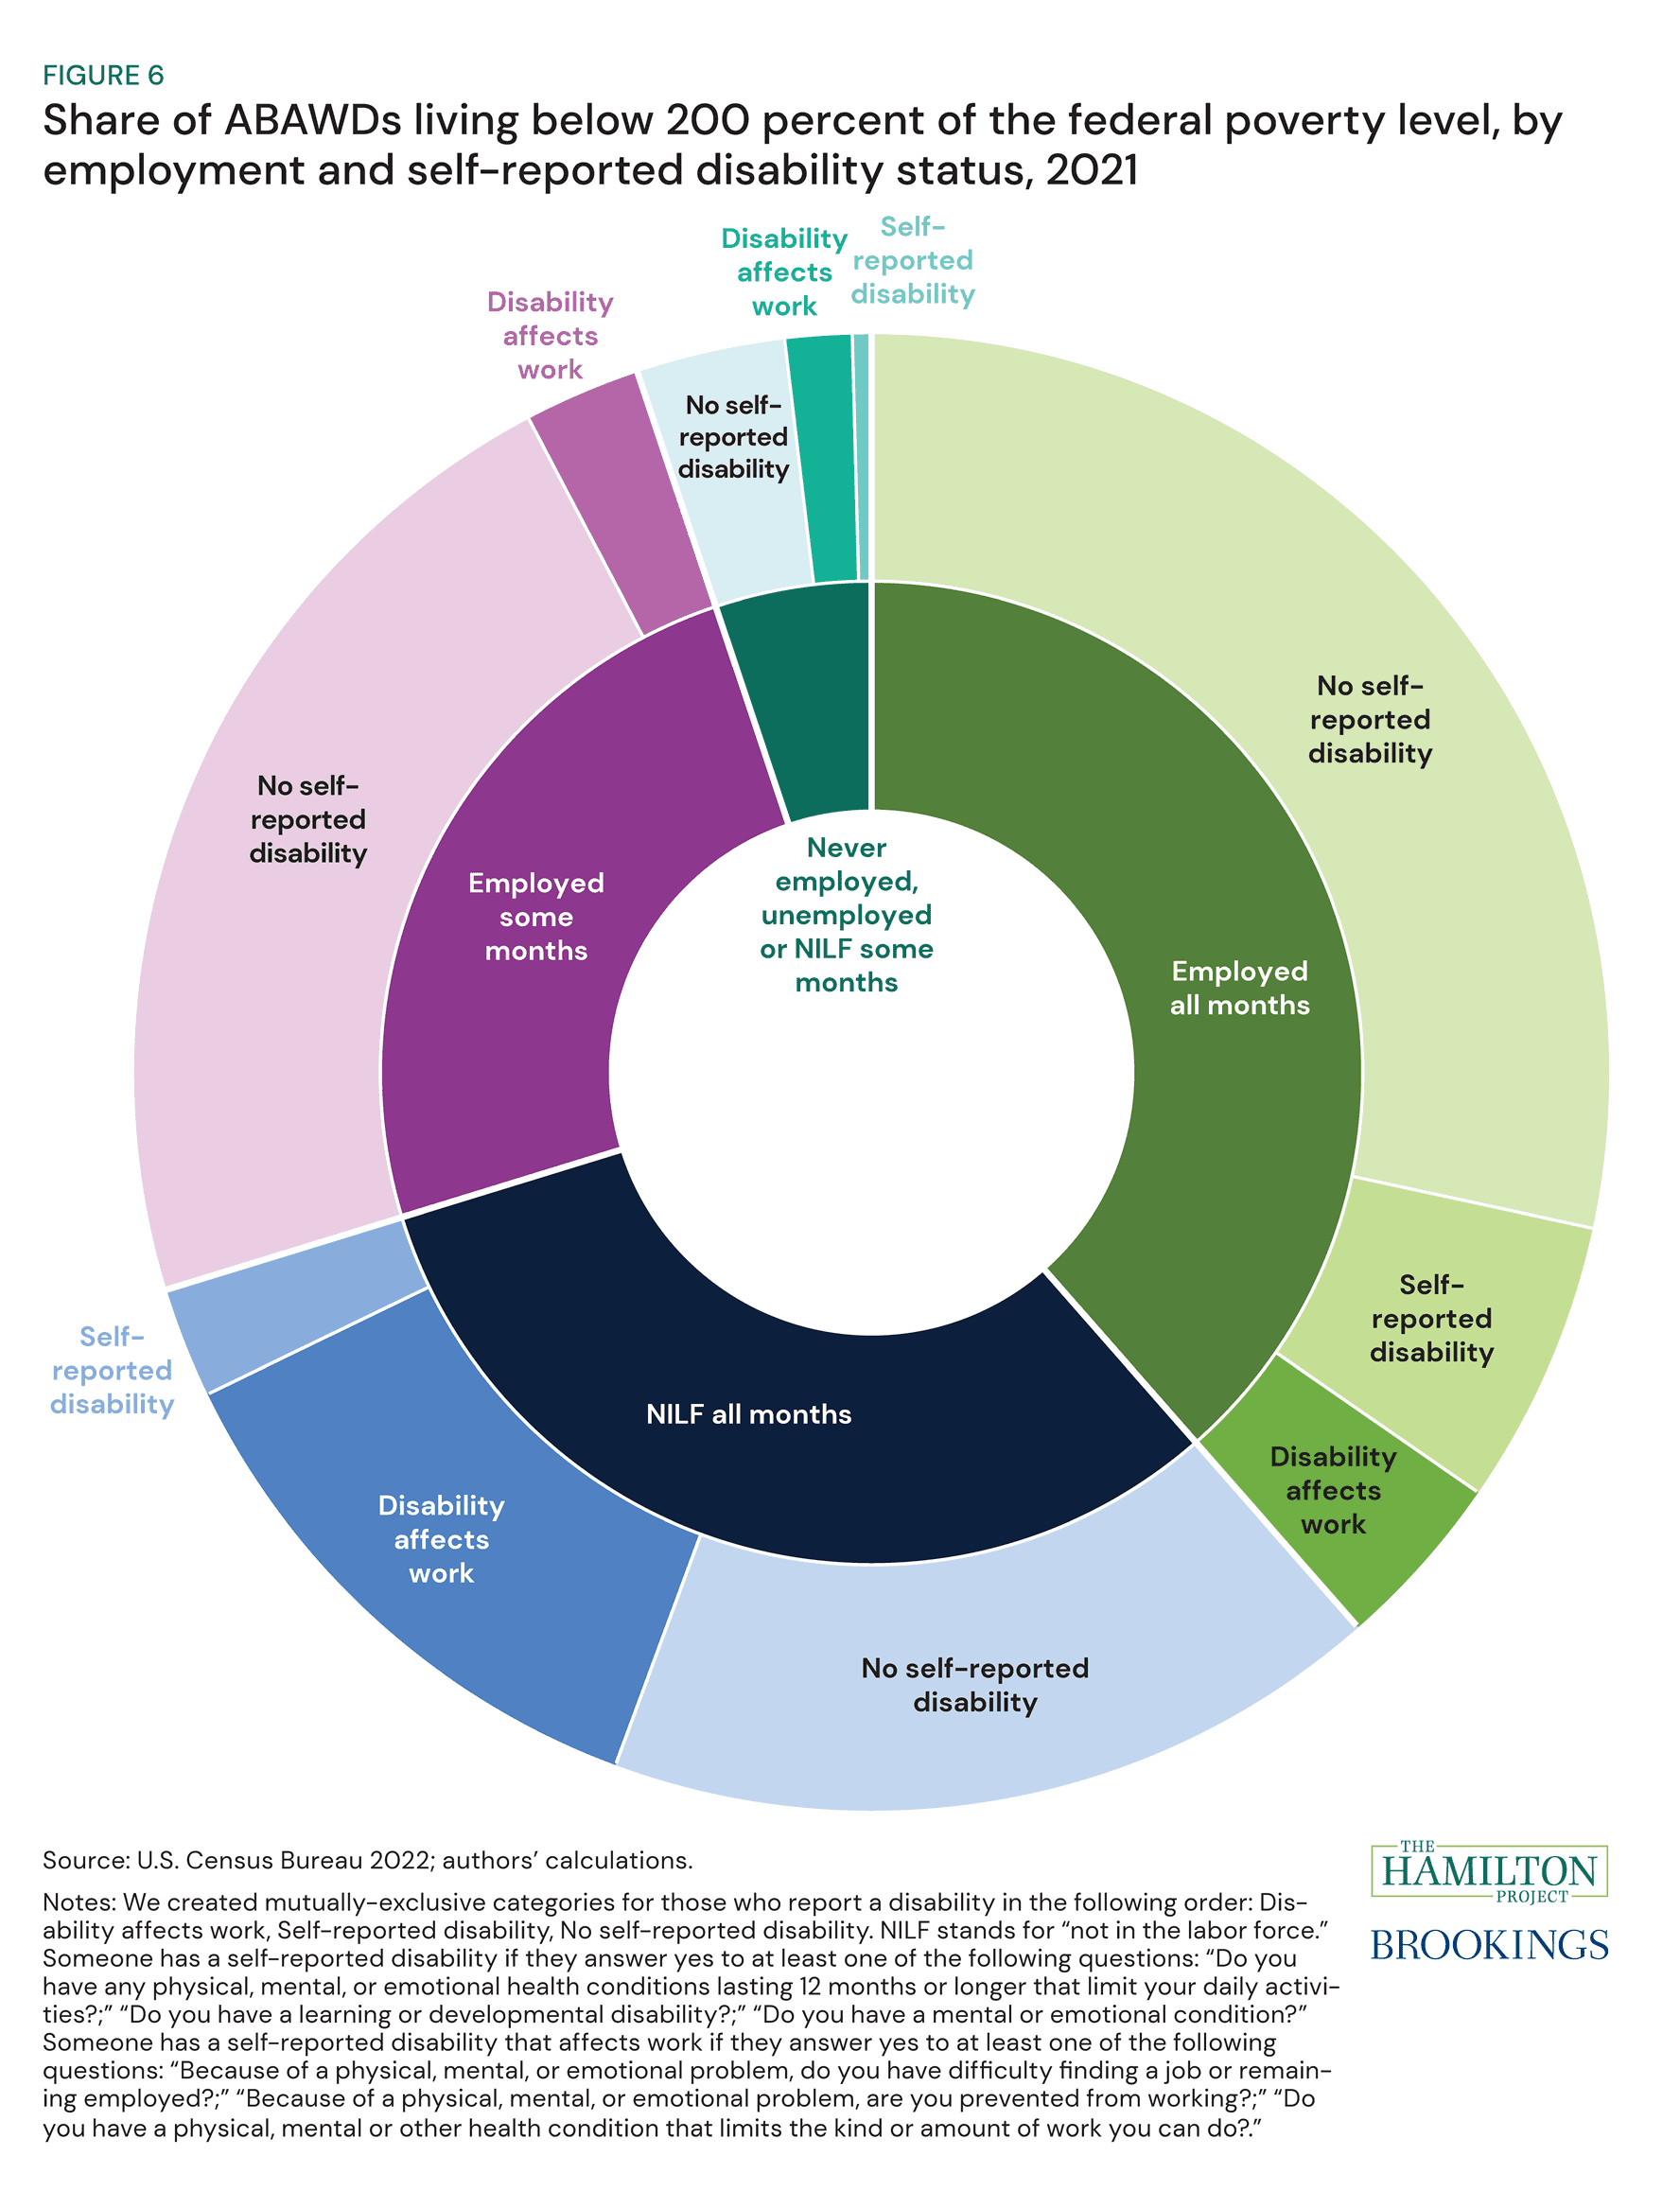
"The safety net should work for working-age adults"
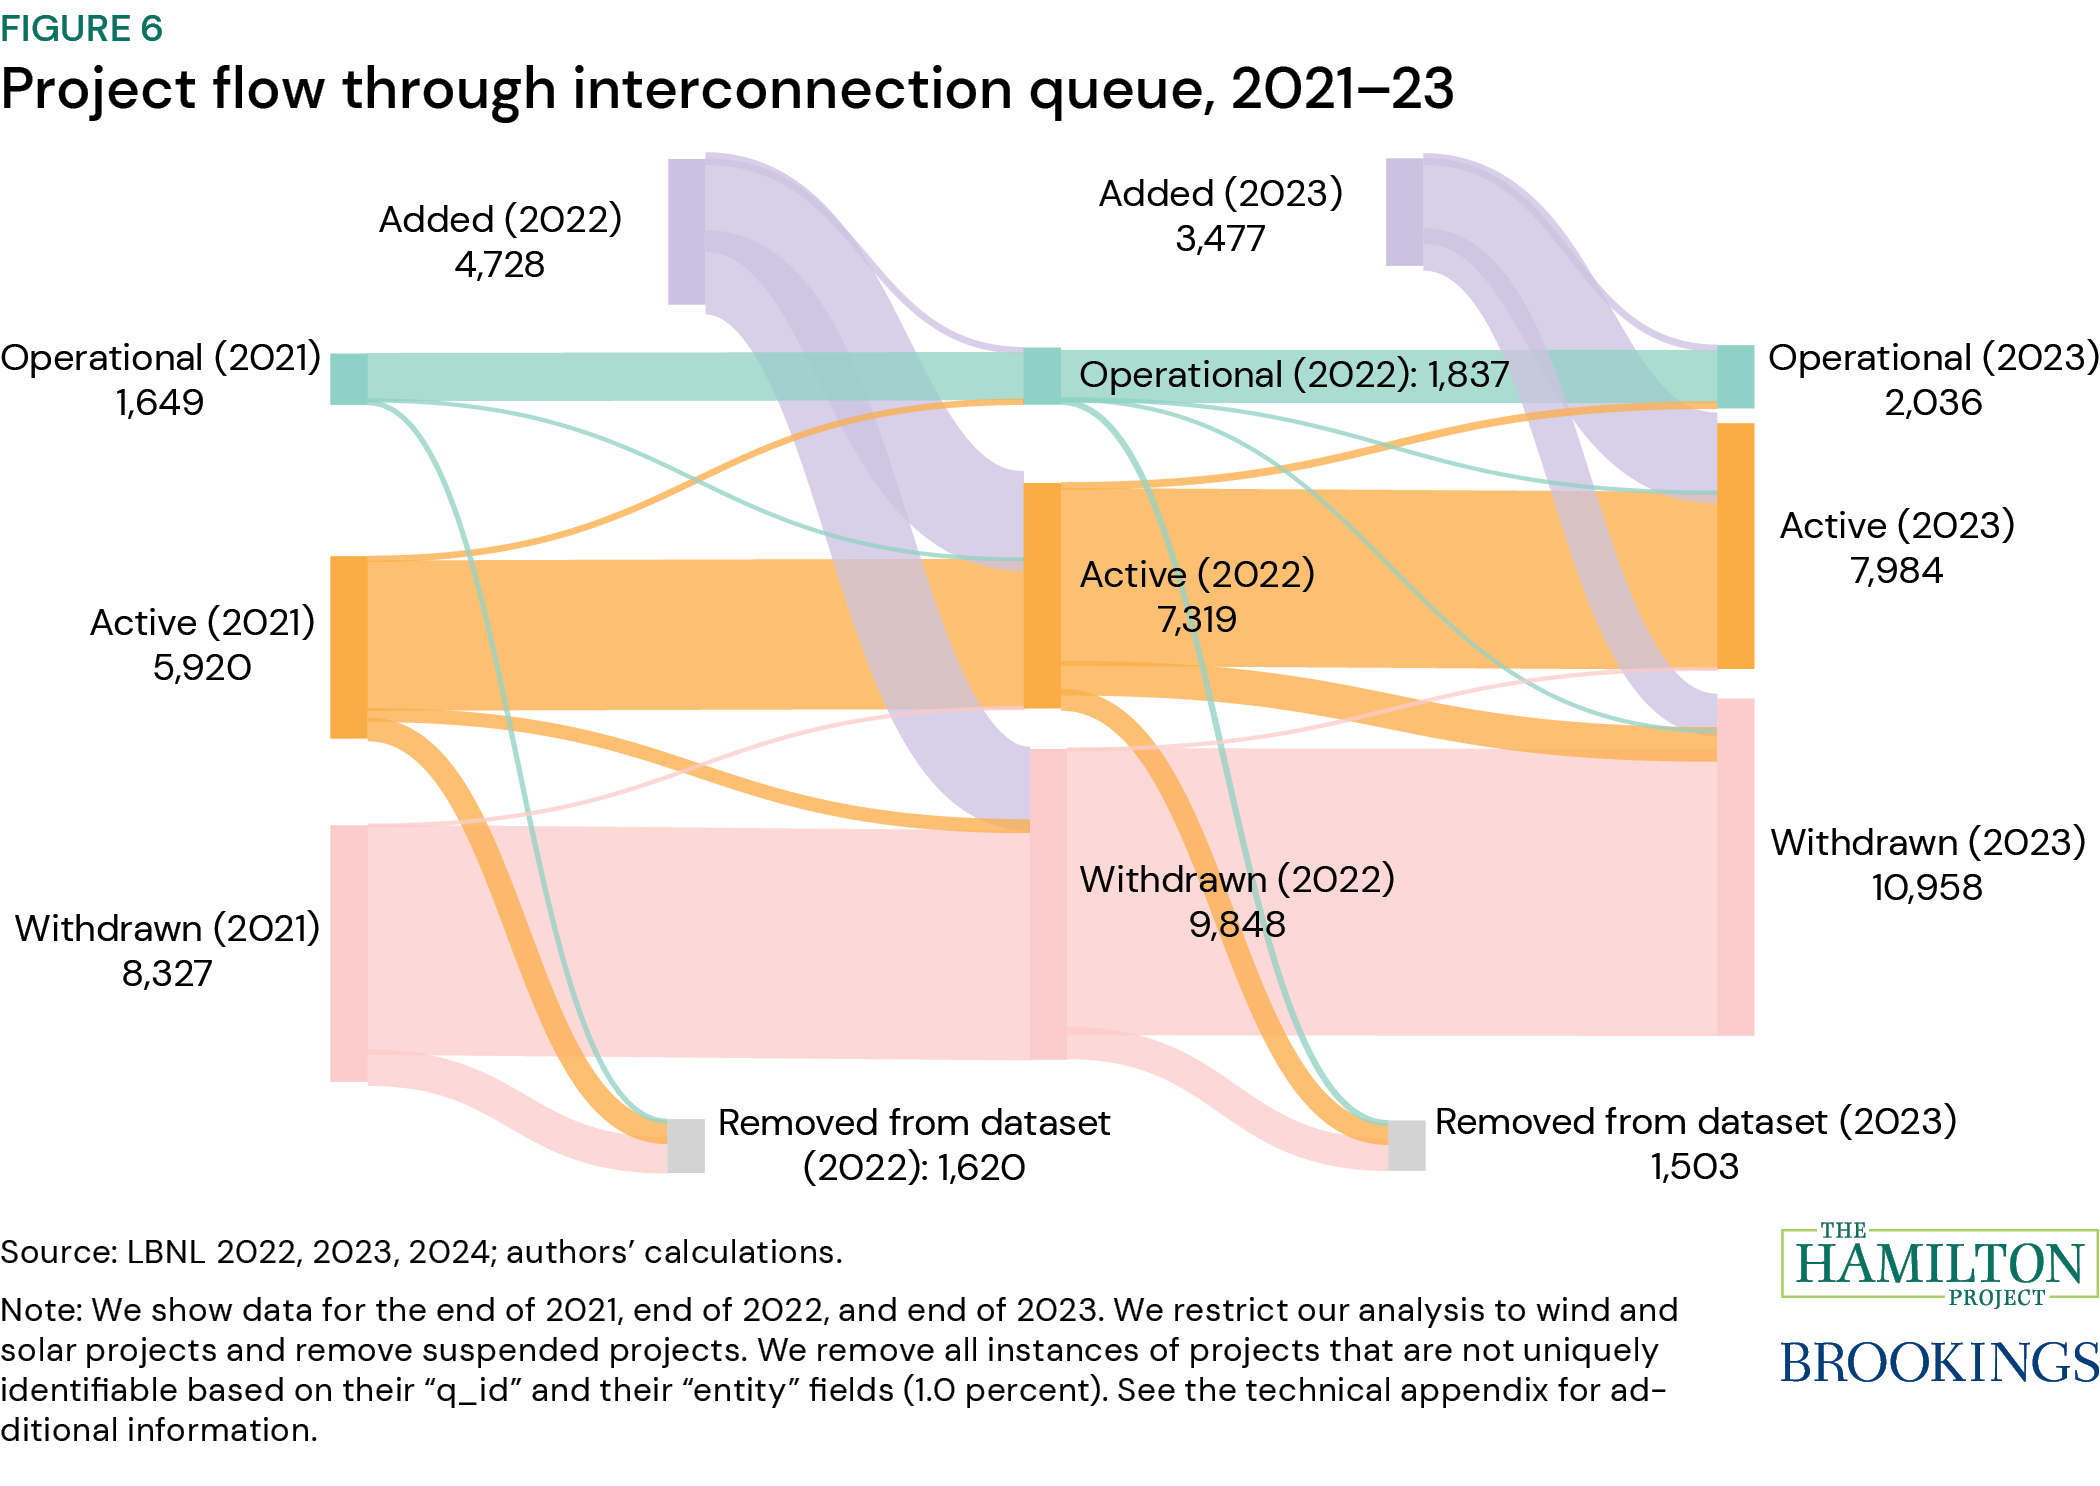
"Eight facts about permitting and the clean energy transition"
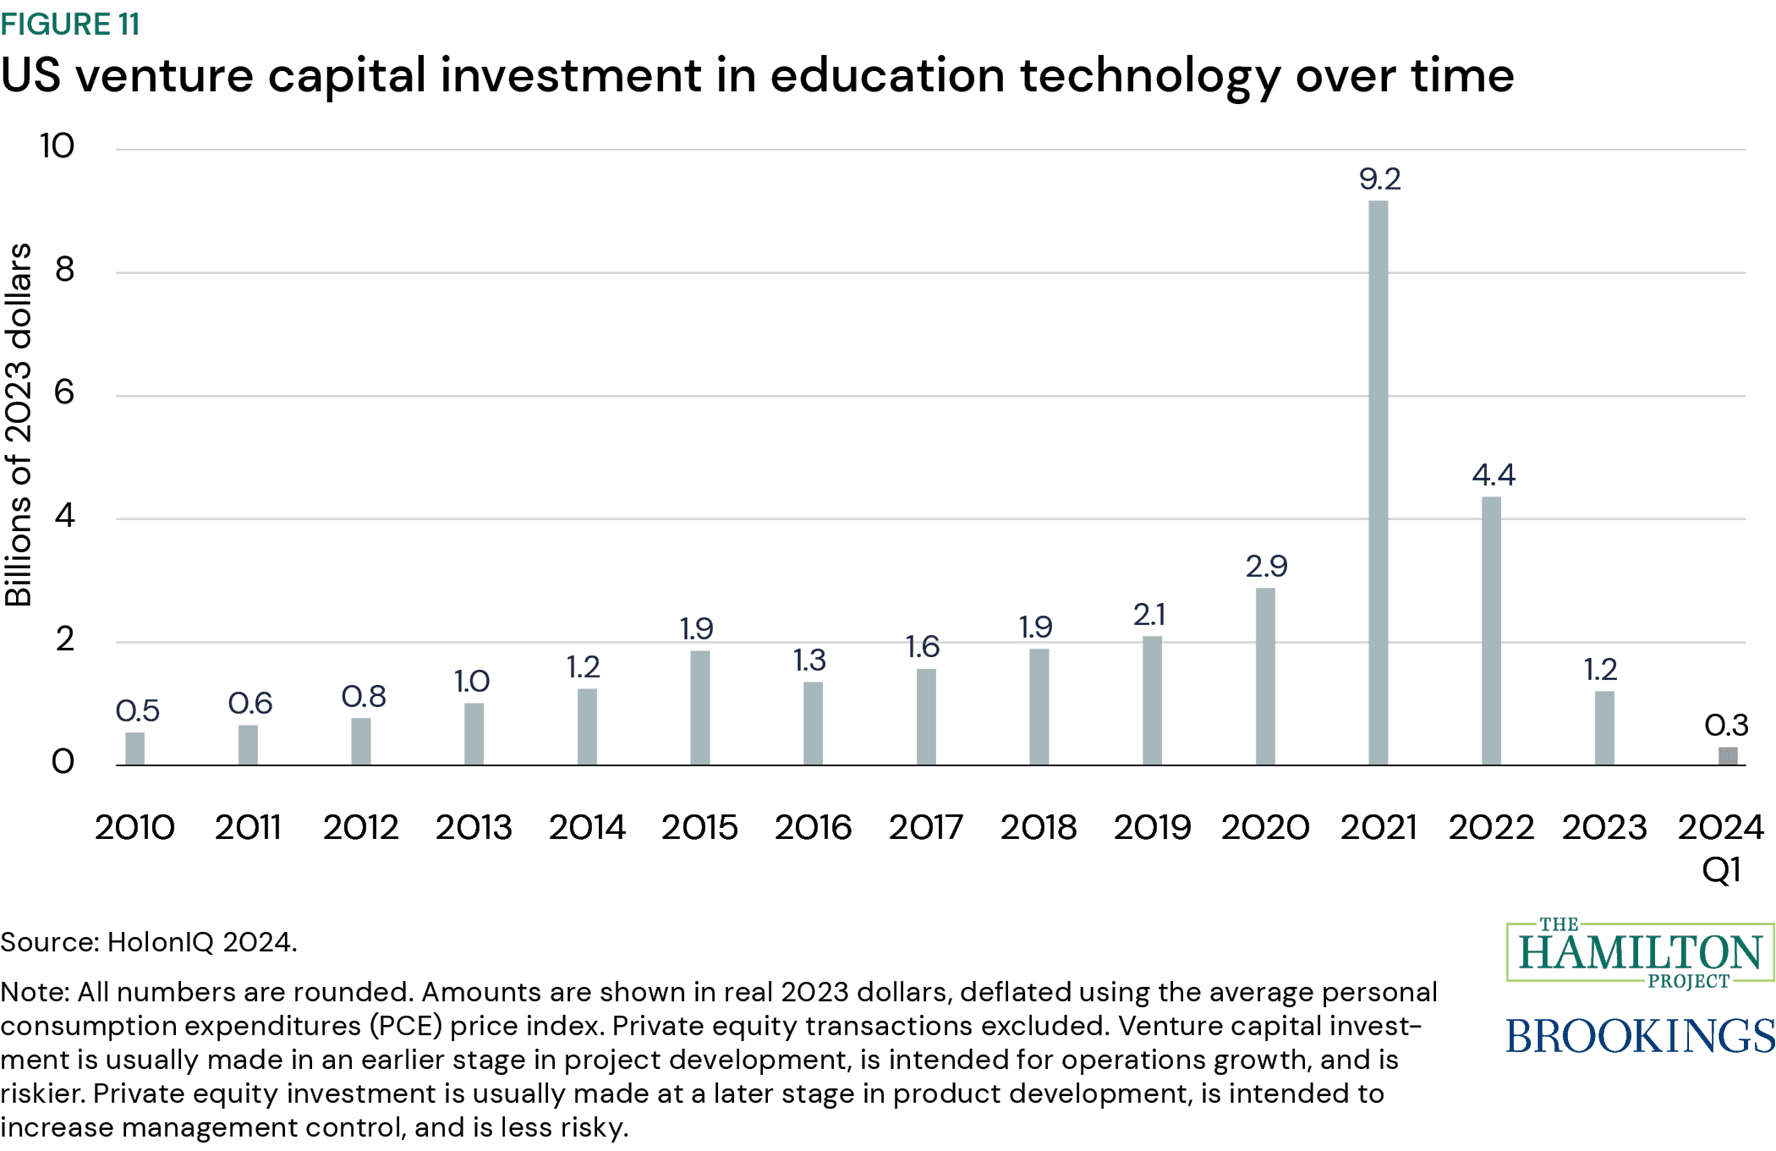
"Twelve facts about the economics of education"
"Prime-age women are still driving the labor market recovery"