Data
THP visualizes economic issues through figures and data interactives.
Interactive
Tracking the labor market and jobs
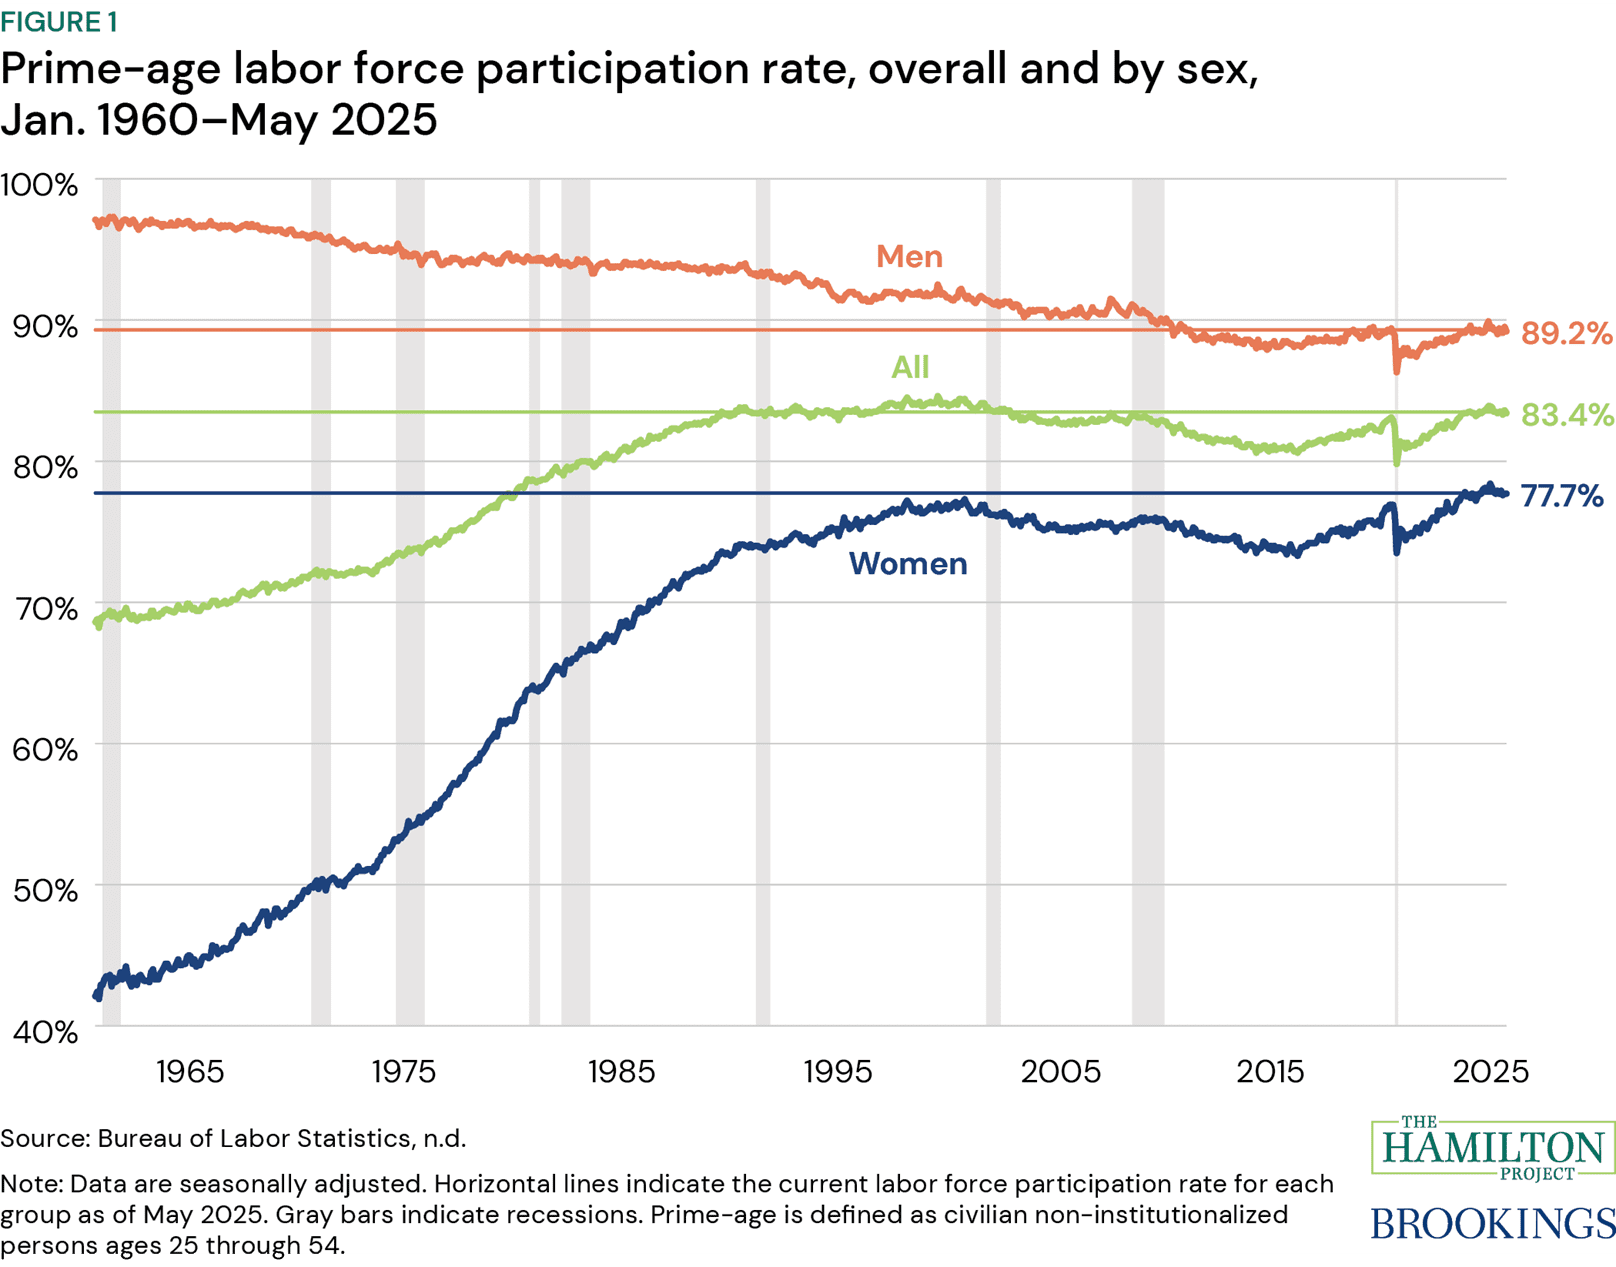
This data interactive allows users to explore trends in labor force participation, employment, and unemployment, among other key indicators.
Interactive
Tracking trade amid uncertain and changing tariff policies
This data interactive allows users to monitor changes in U.S. trade flows, tariffs applied, and traded goods prices on an ongoing basis.
Interactive
Tracking federal expenditures in real time
Track federal expenditures and filter by department, program, and more. Data are updated daily.
Interactive
Has pay kept up with inflation?
An interactive shows changes in real pay across different inflation measures, pay measures, time periods, and sectors.
Featured Figures
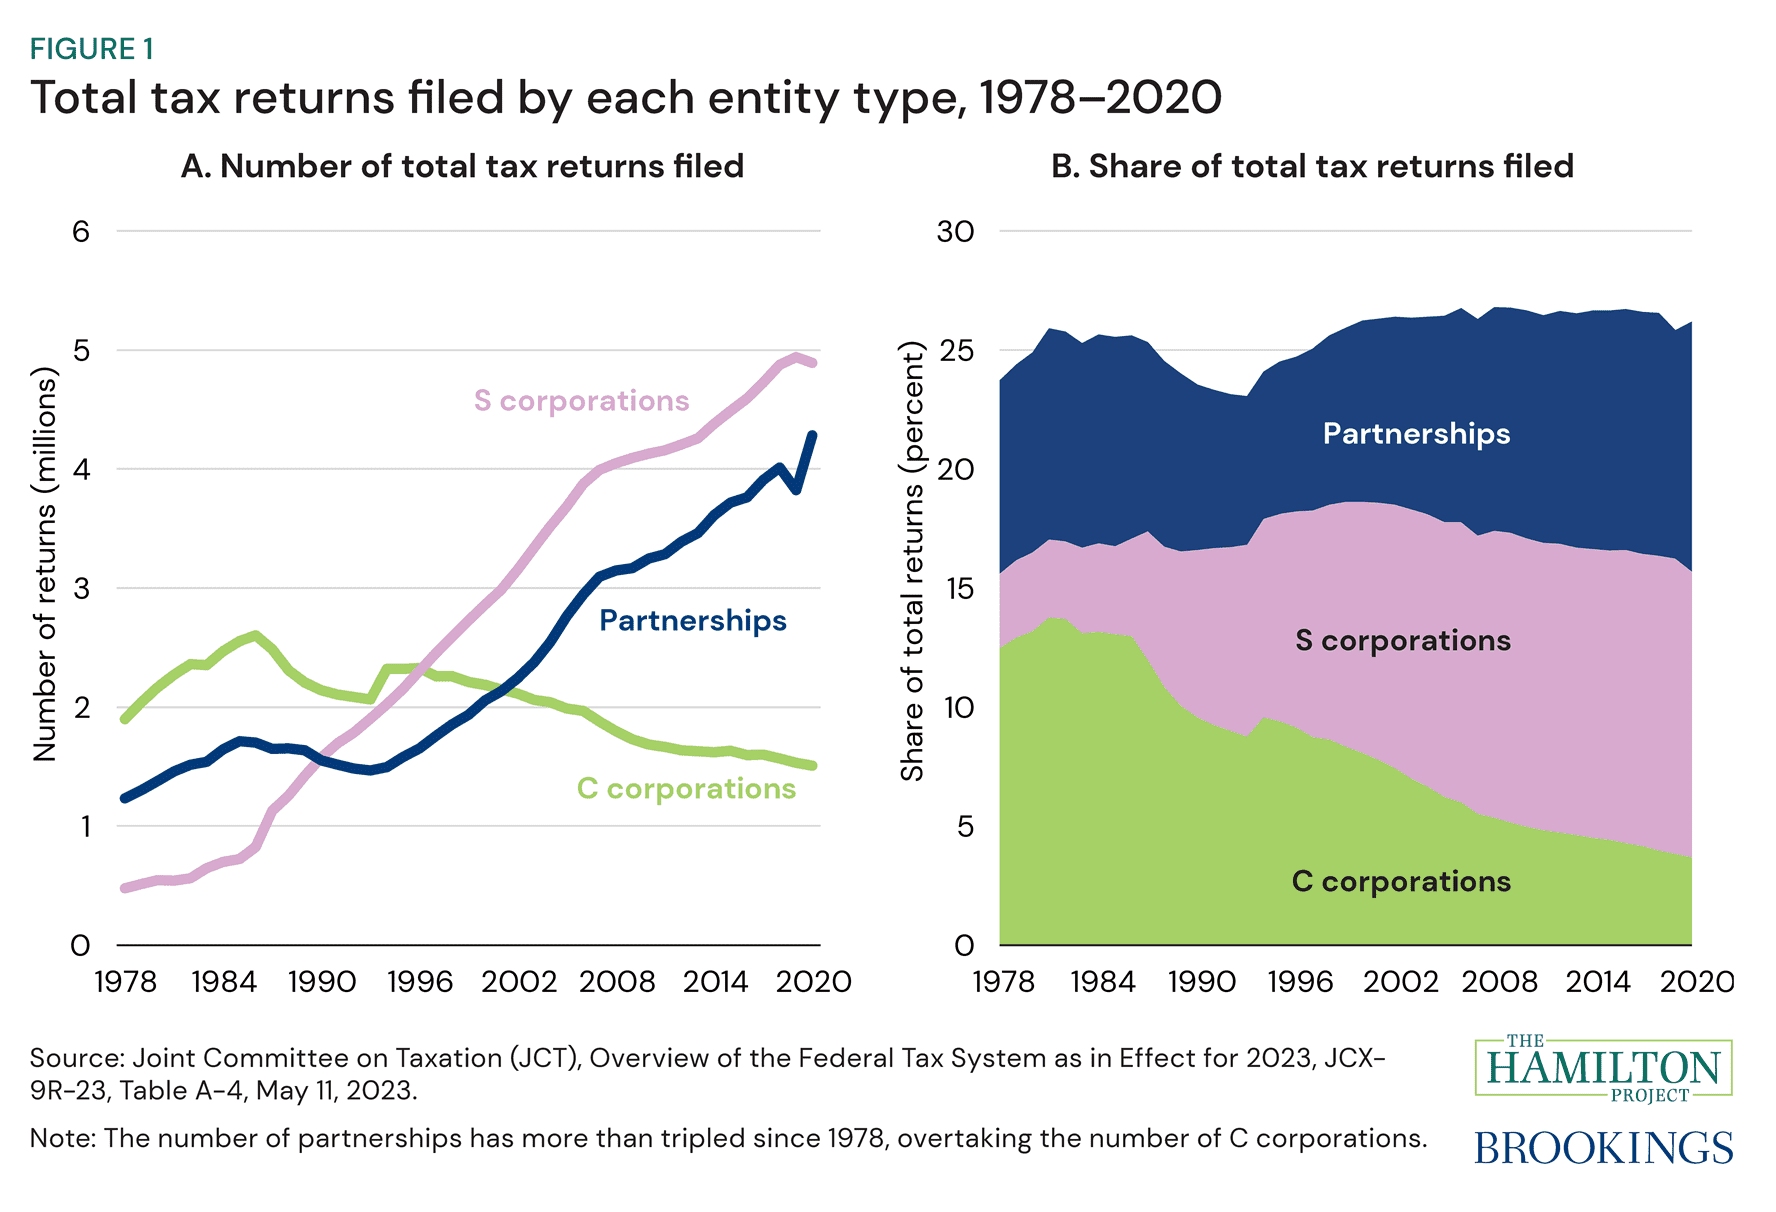
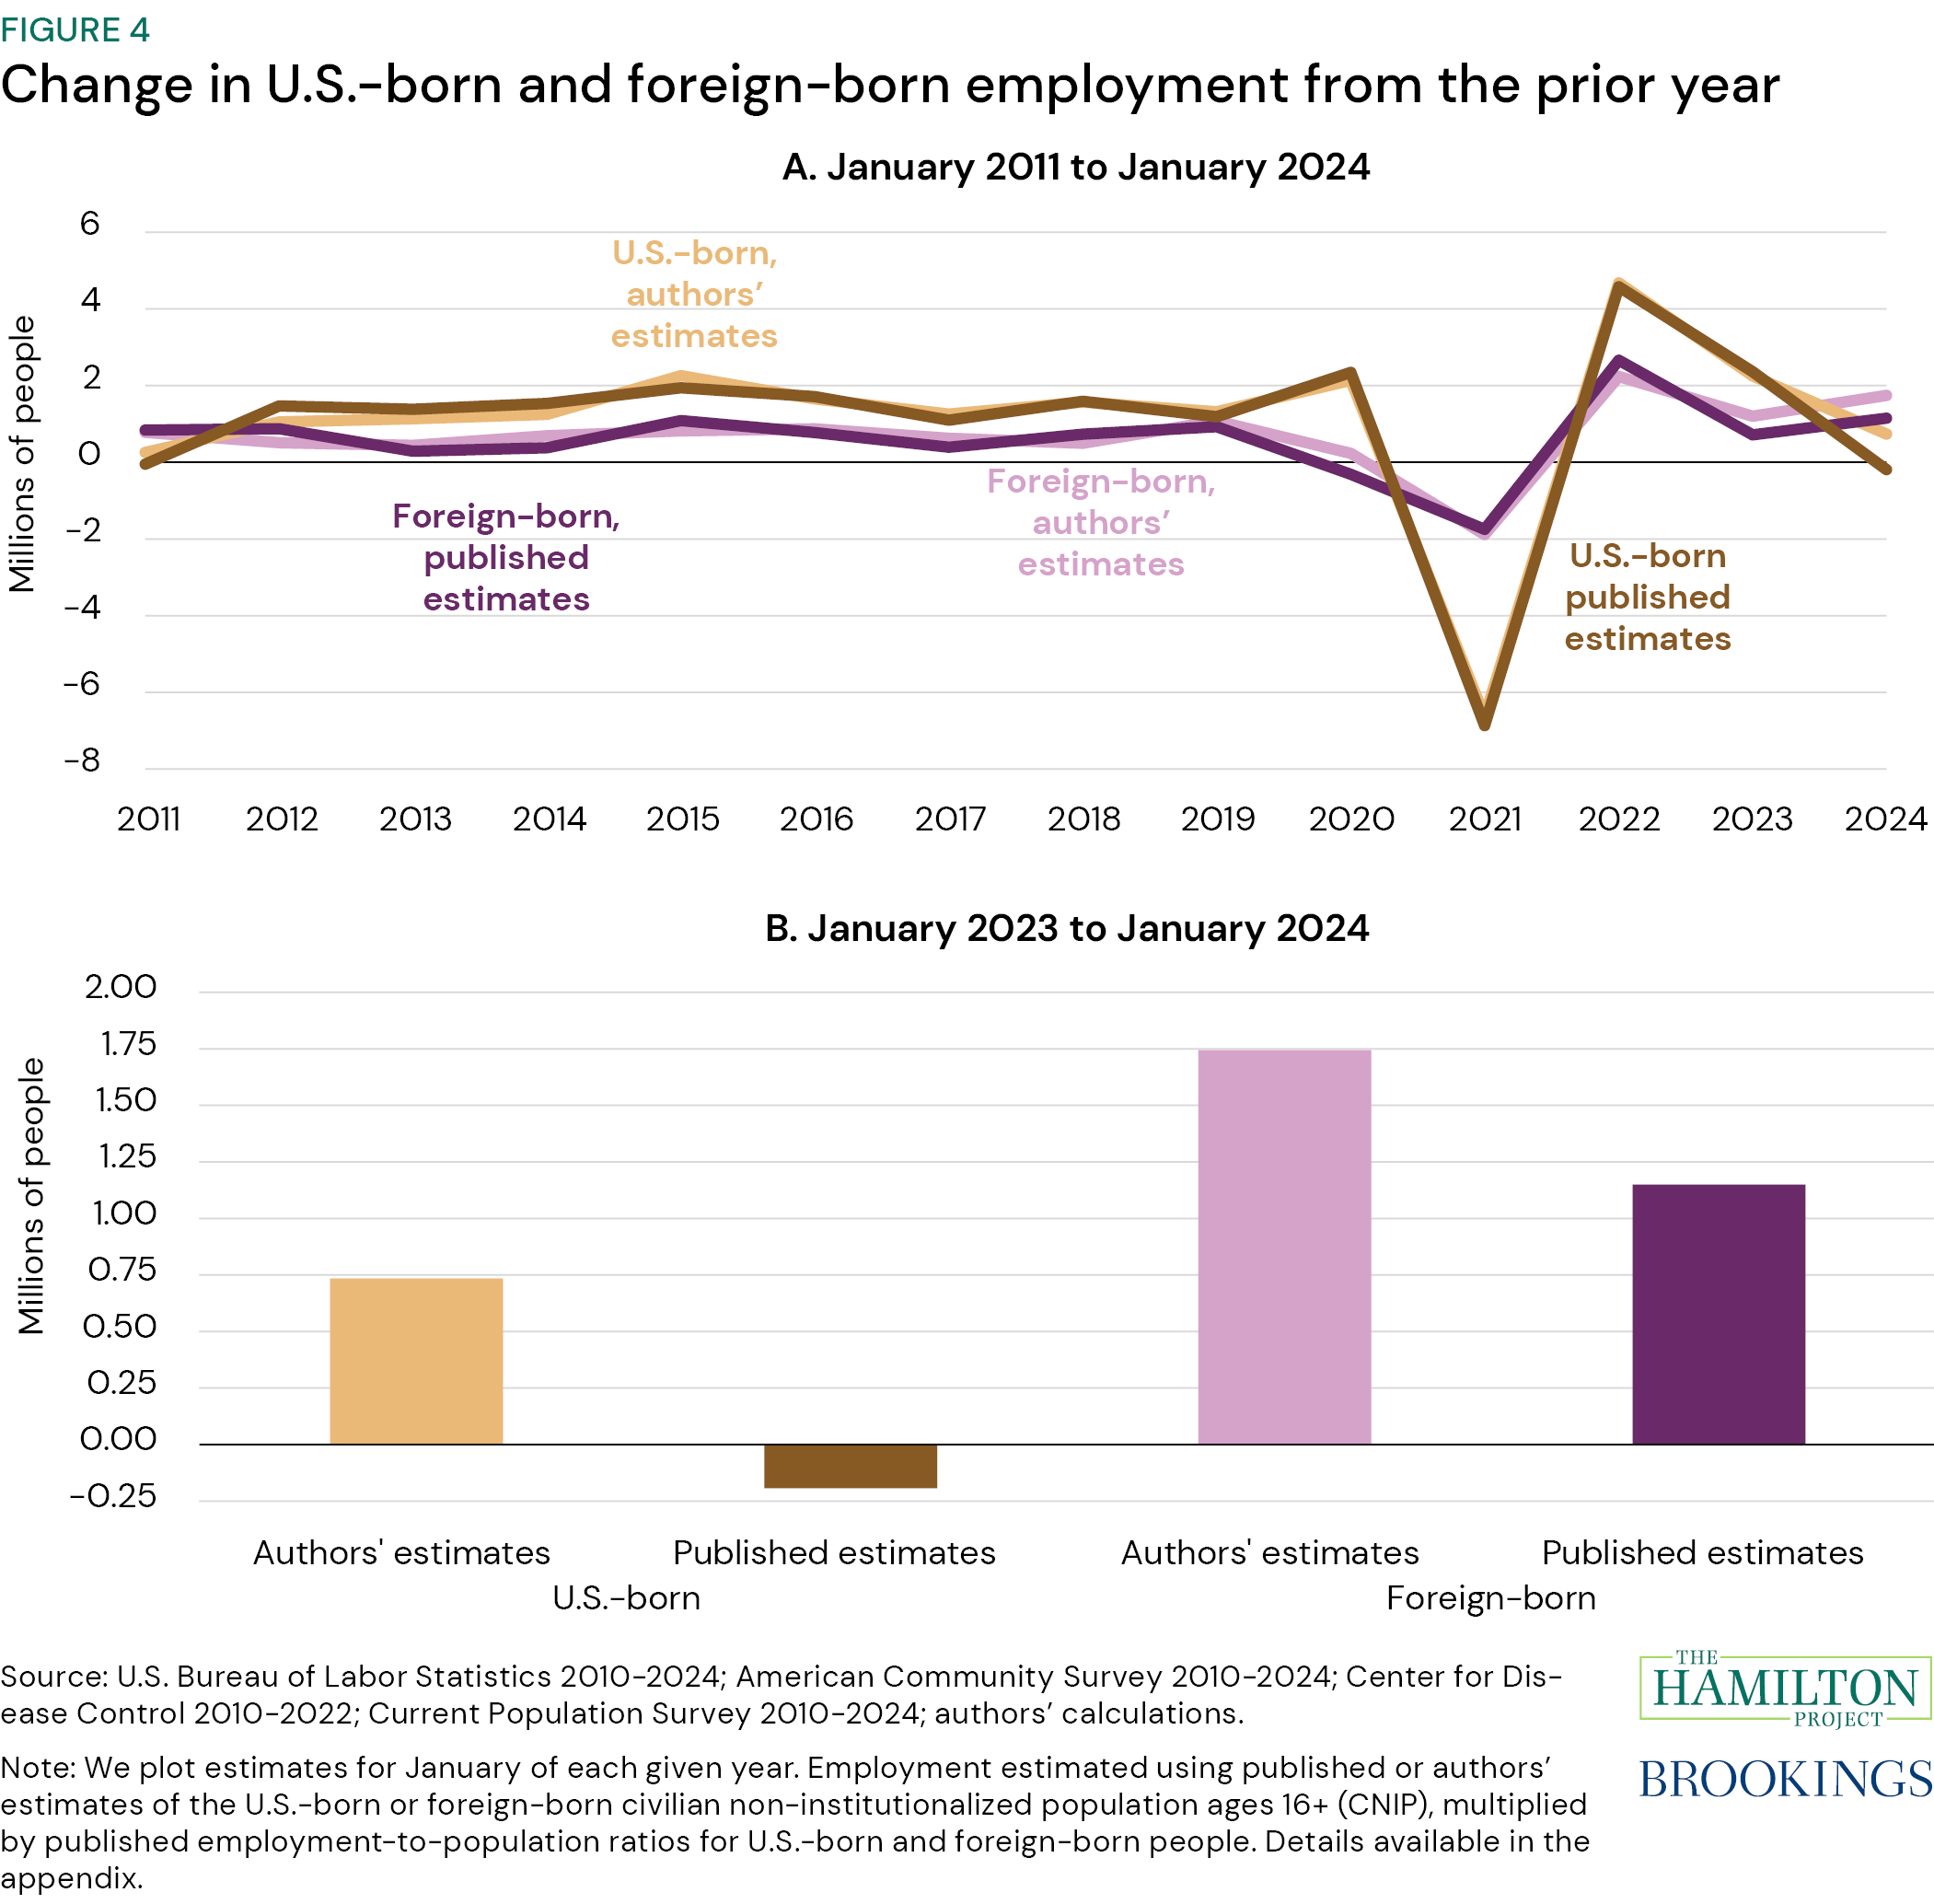
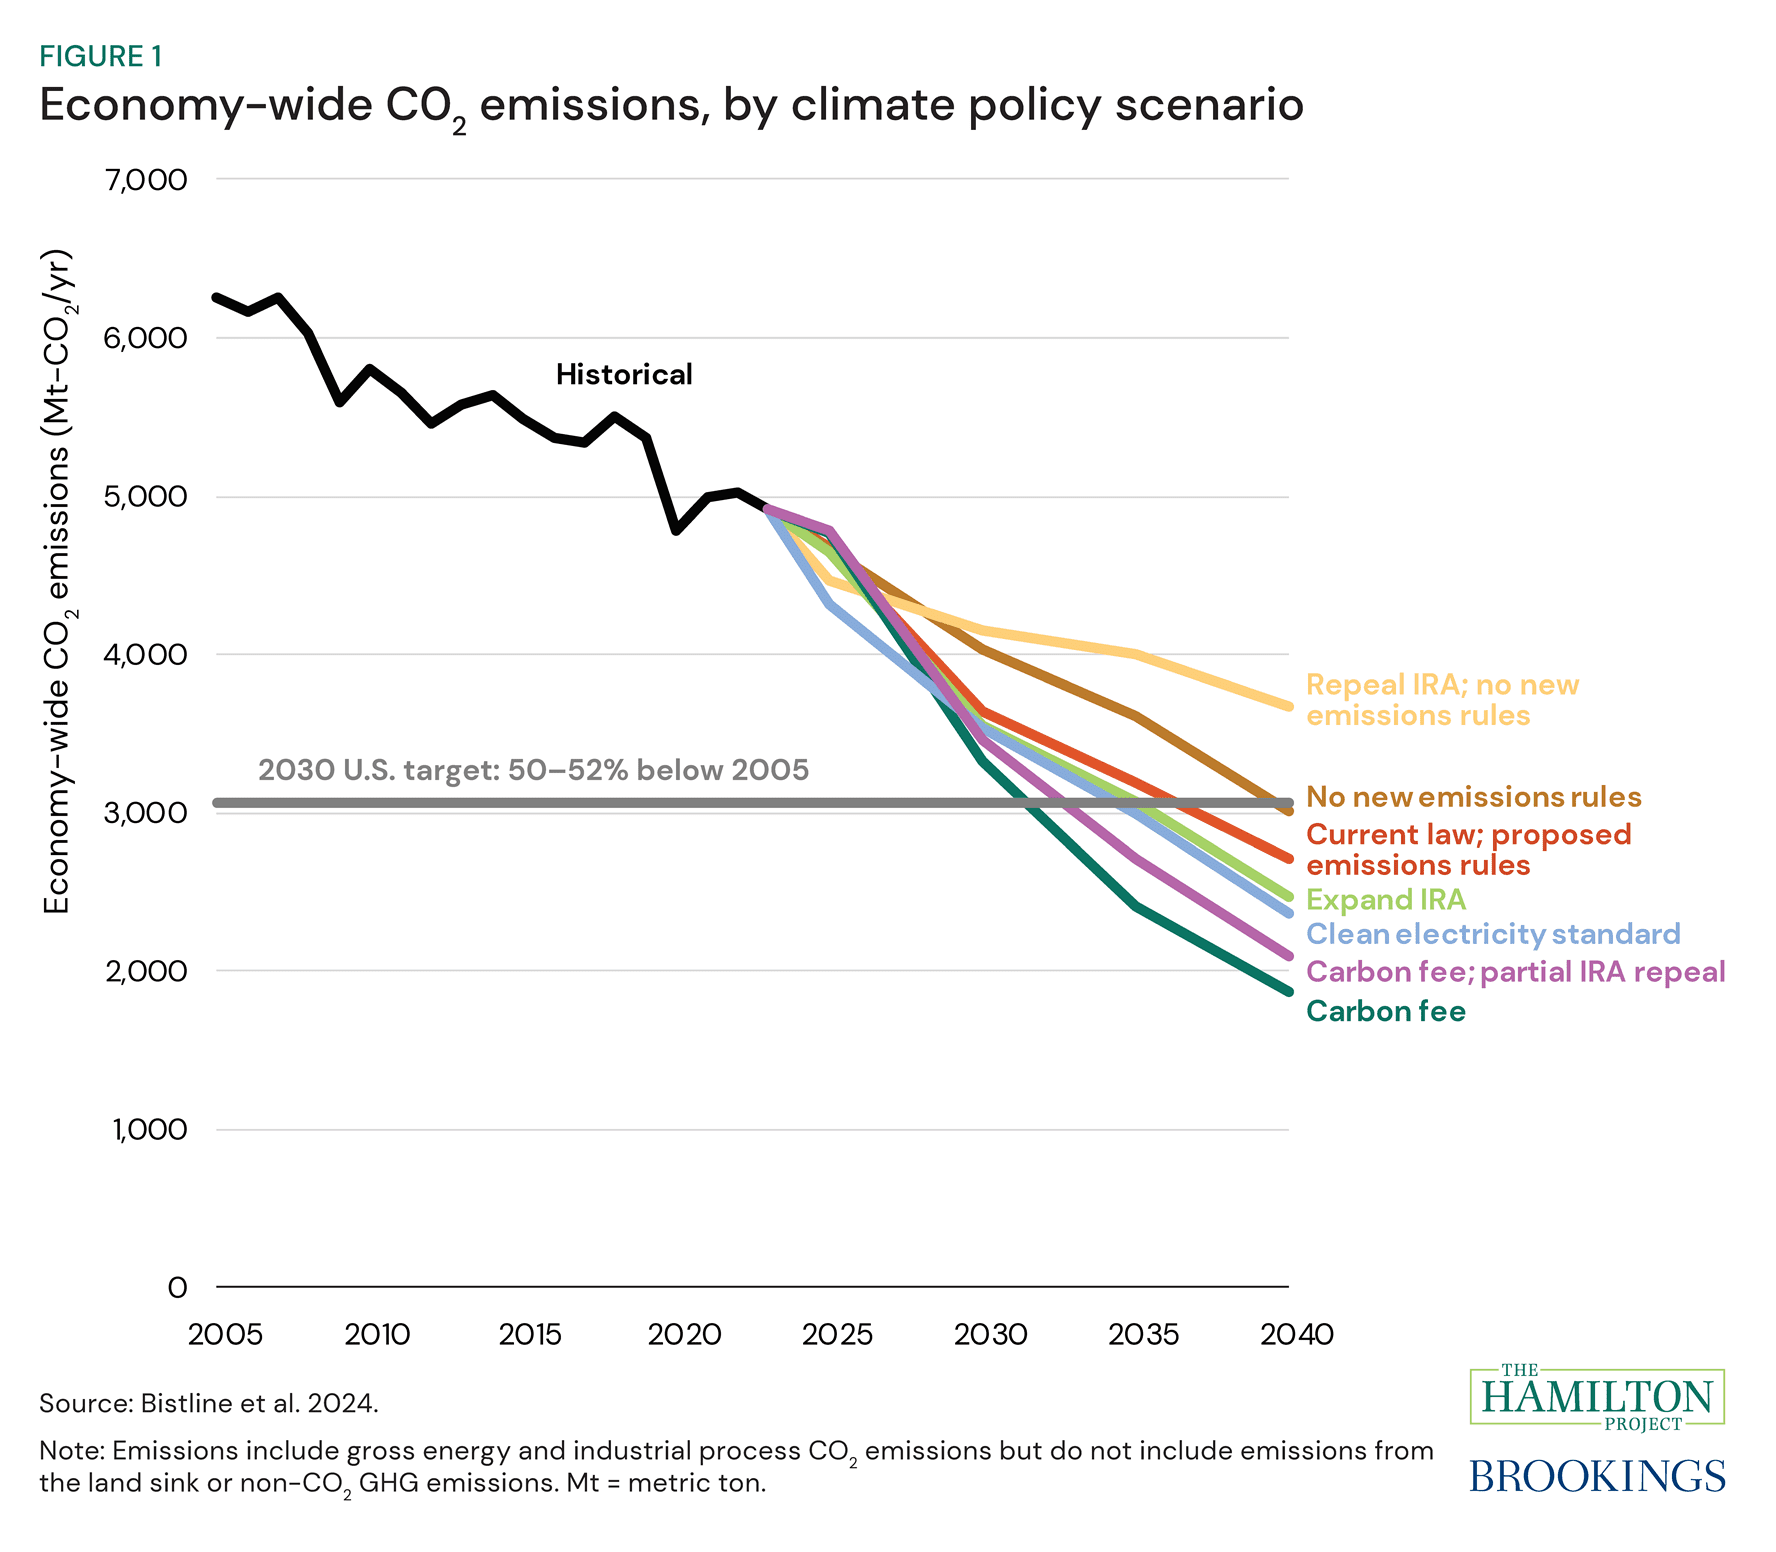
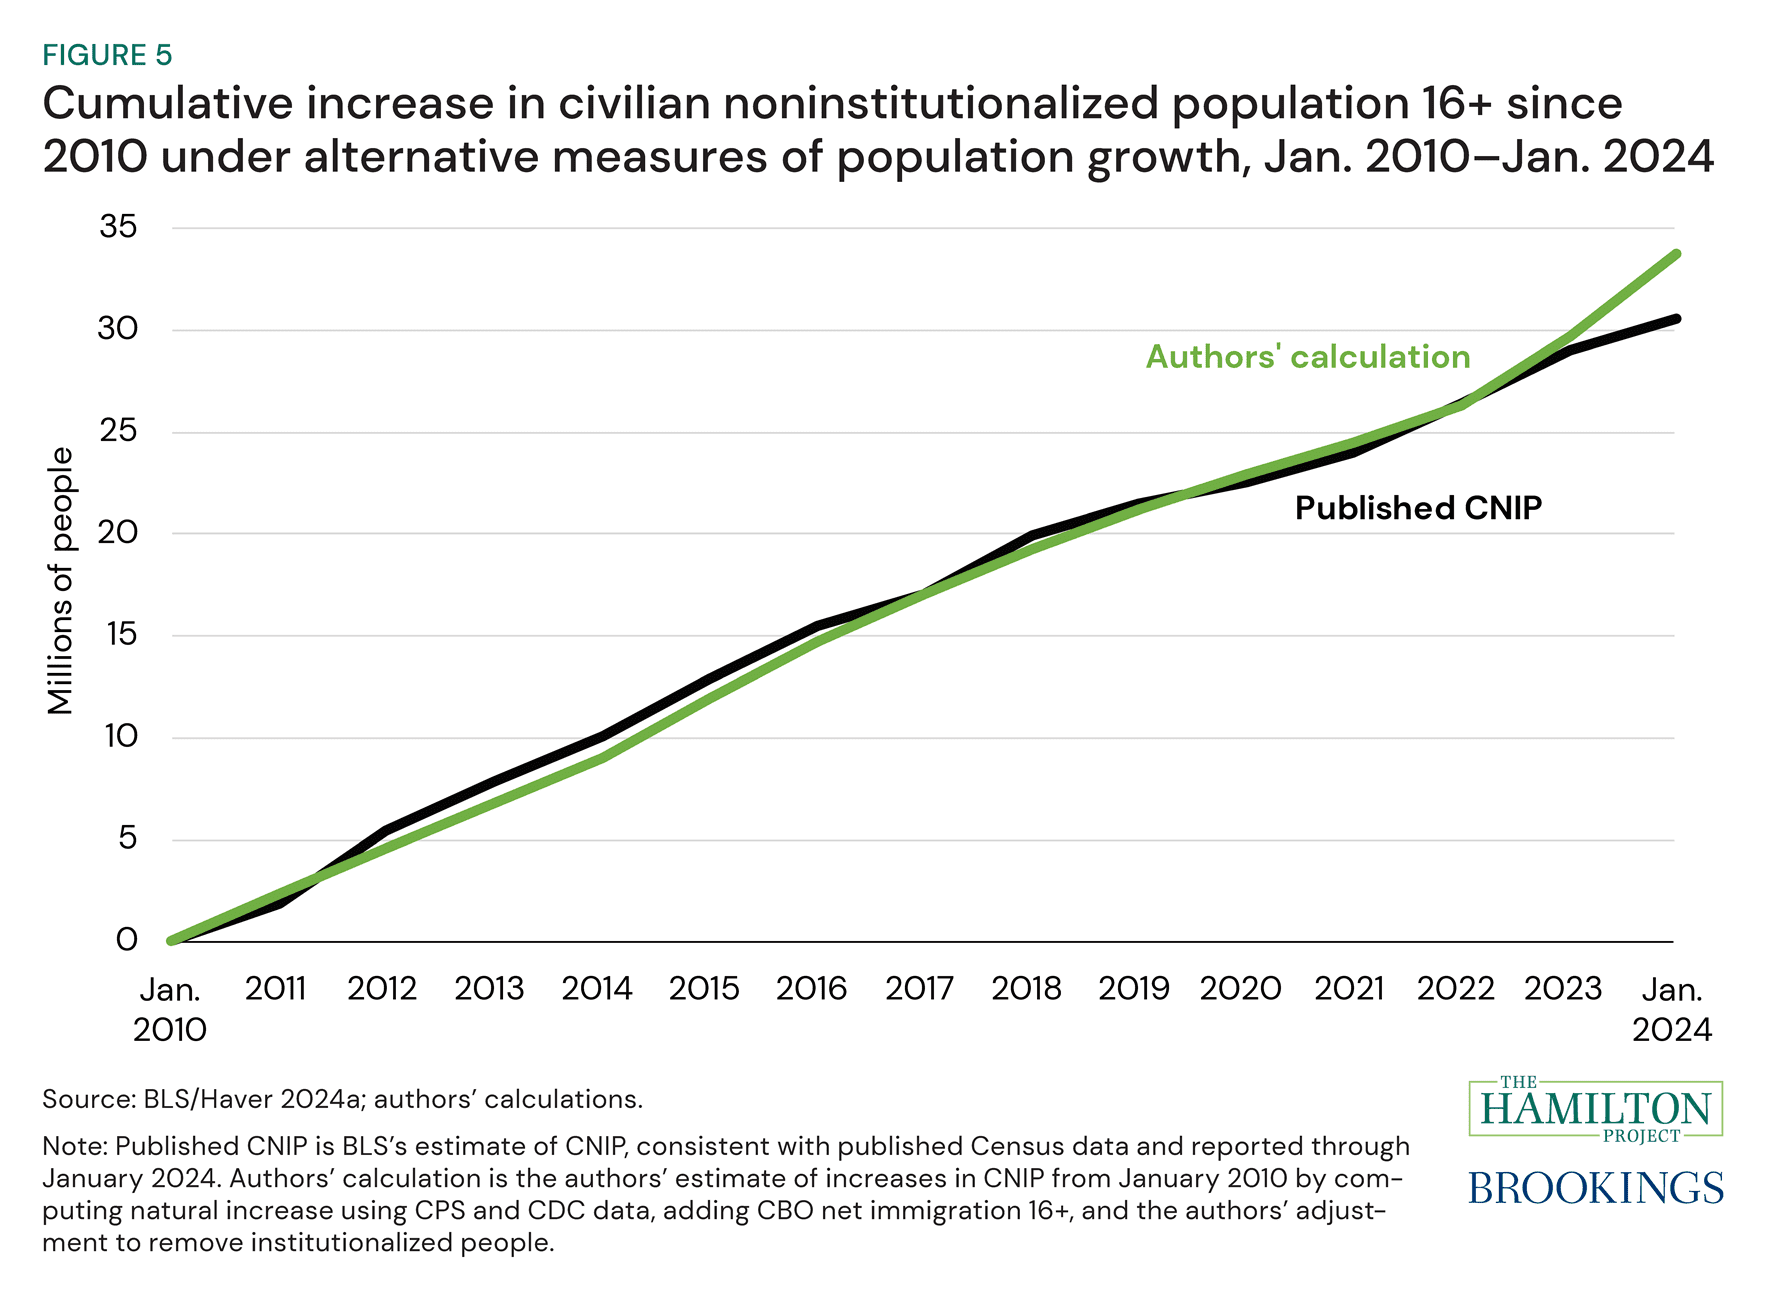
Explore data from our publications

