
Interactive
Has pay kept up with inflation?
An interactive shows changes in real pay using different inflation and pay measures.
Read More
Explore All Data
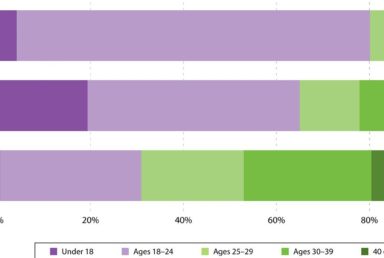
Age distribution of undergraduate students, by type of institution
This chart shows the age distribution of undergraduate students by the type of institution in which the students were enrolled in 2015.
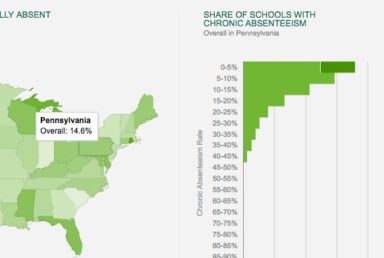
Chronic school absenteeism in the United States
Chronic absenteeism is defined as when a student misses more days of school than a particular threshold—in these data, measured as 15 total days in the 2013-14…
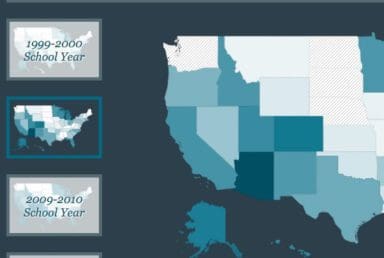
Share of students with access to charter schools, by state
Explore state-level variation in charter school access and enrollment between 2000 and 2015.In the past 25 years, 43 states and the District of Columbia have p…
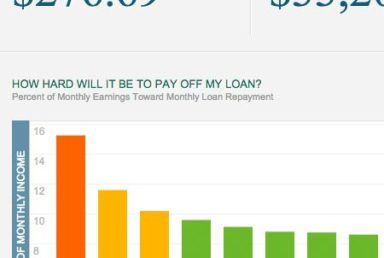
Undergraduate student loan calculator
See the accompanying economic analysis, Major Decisions: Graduates’ Earnings Growth and Debt Repayment.Today, roughly 70 percent of American bachelor’s graduat…