See the accompanying economic analysis, "Major Decisions: What Graduates Earn Over Their Lifetimes." Over the entire working life, the typical college gra…
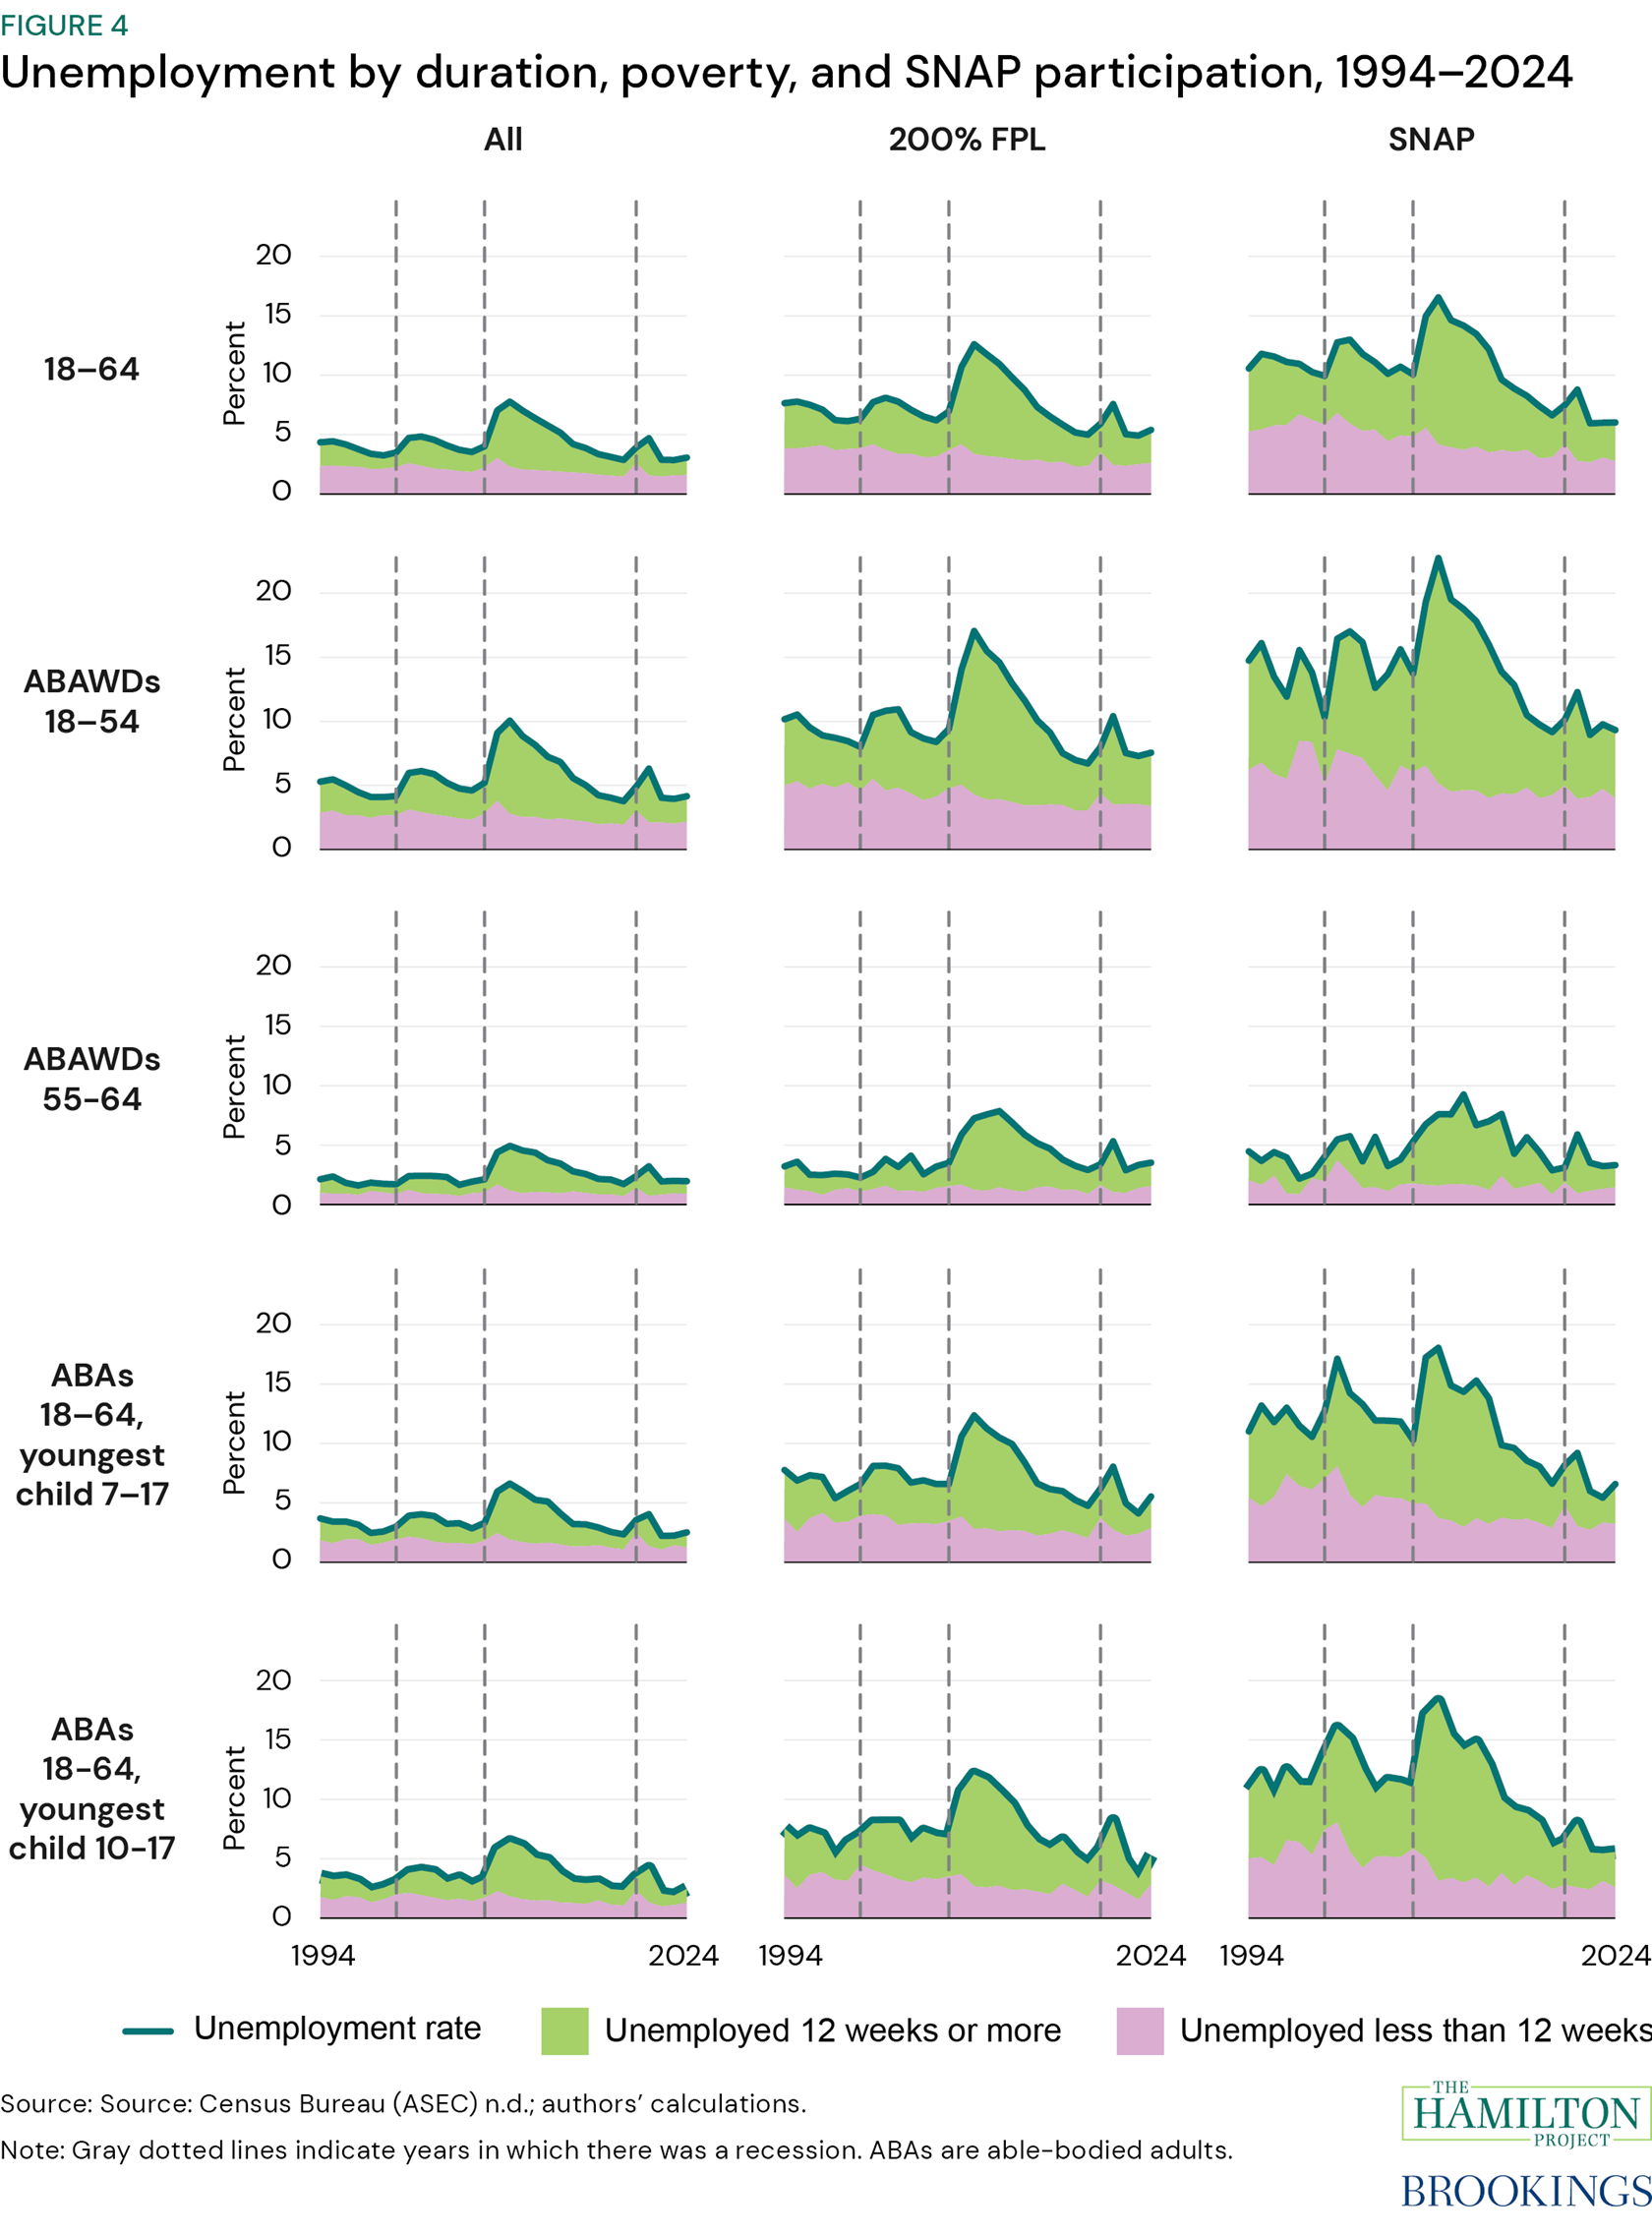
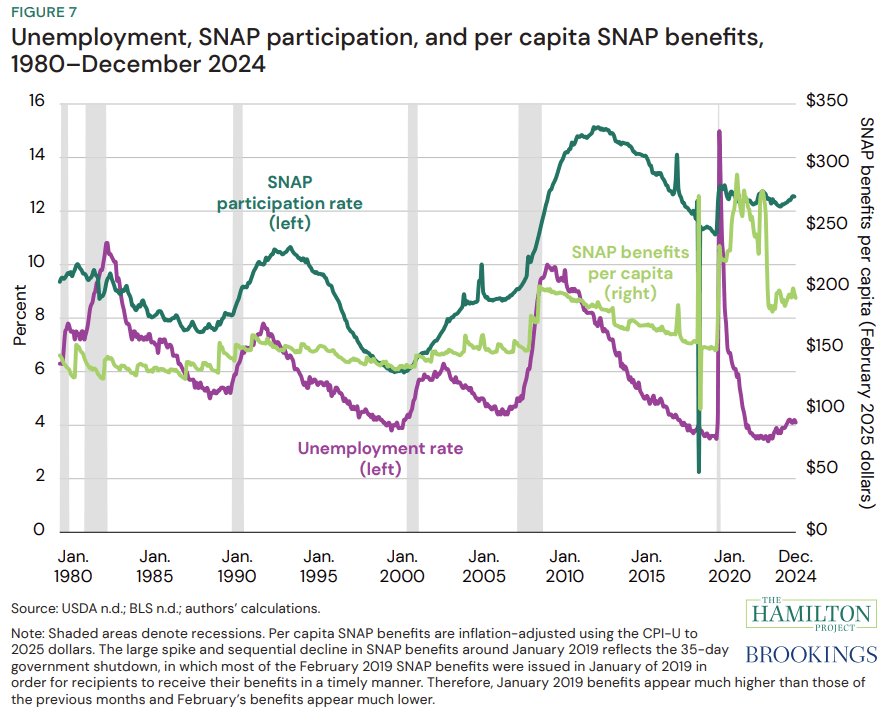
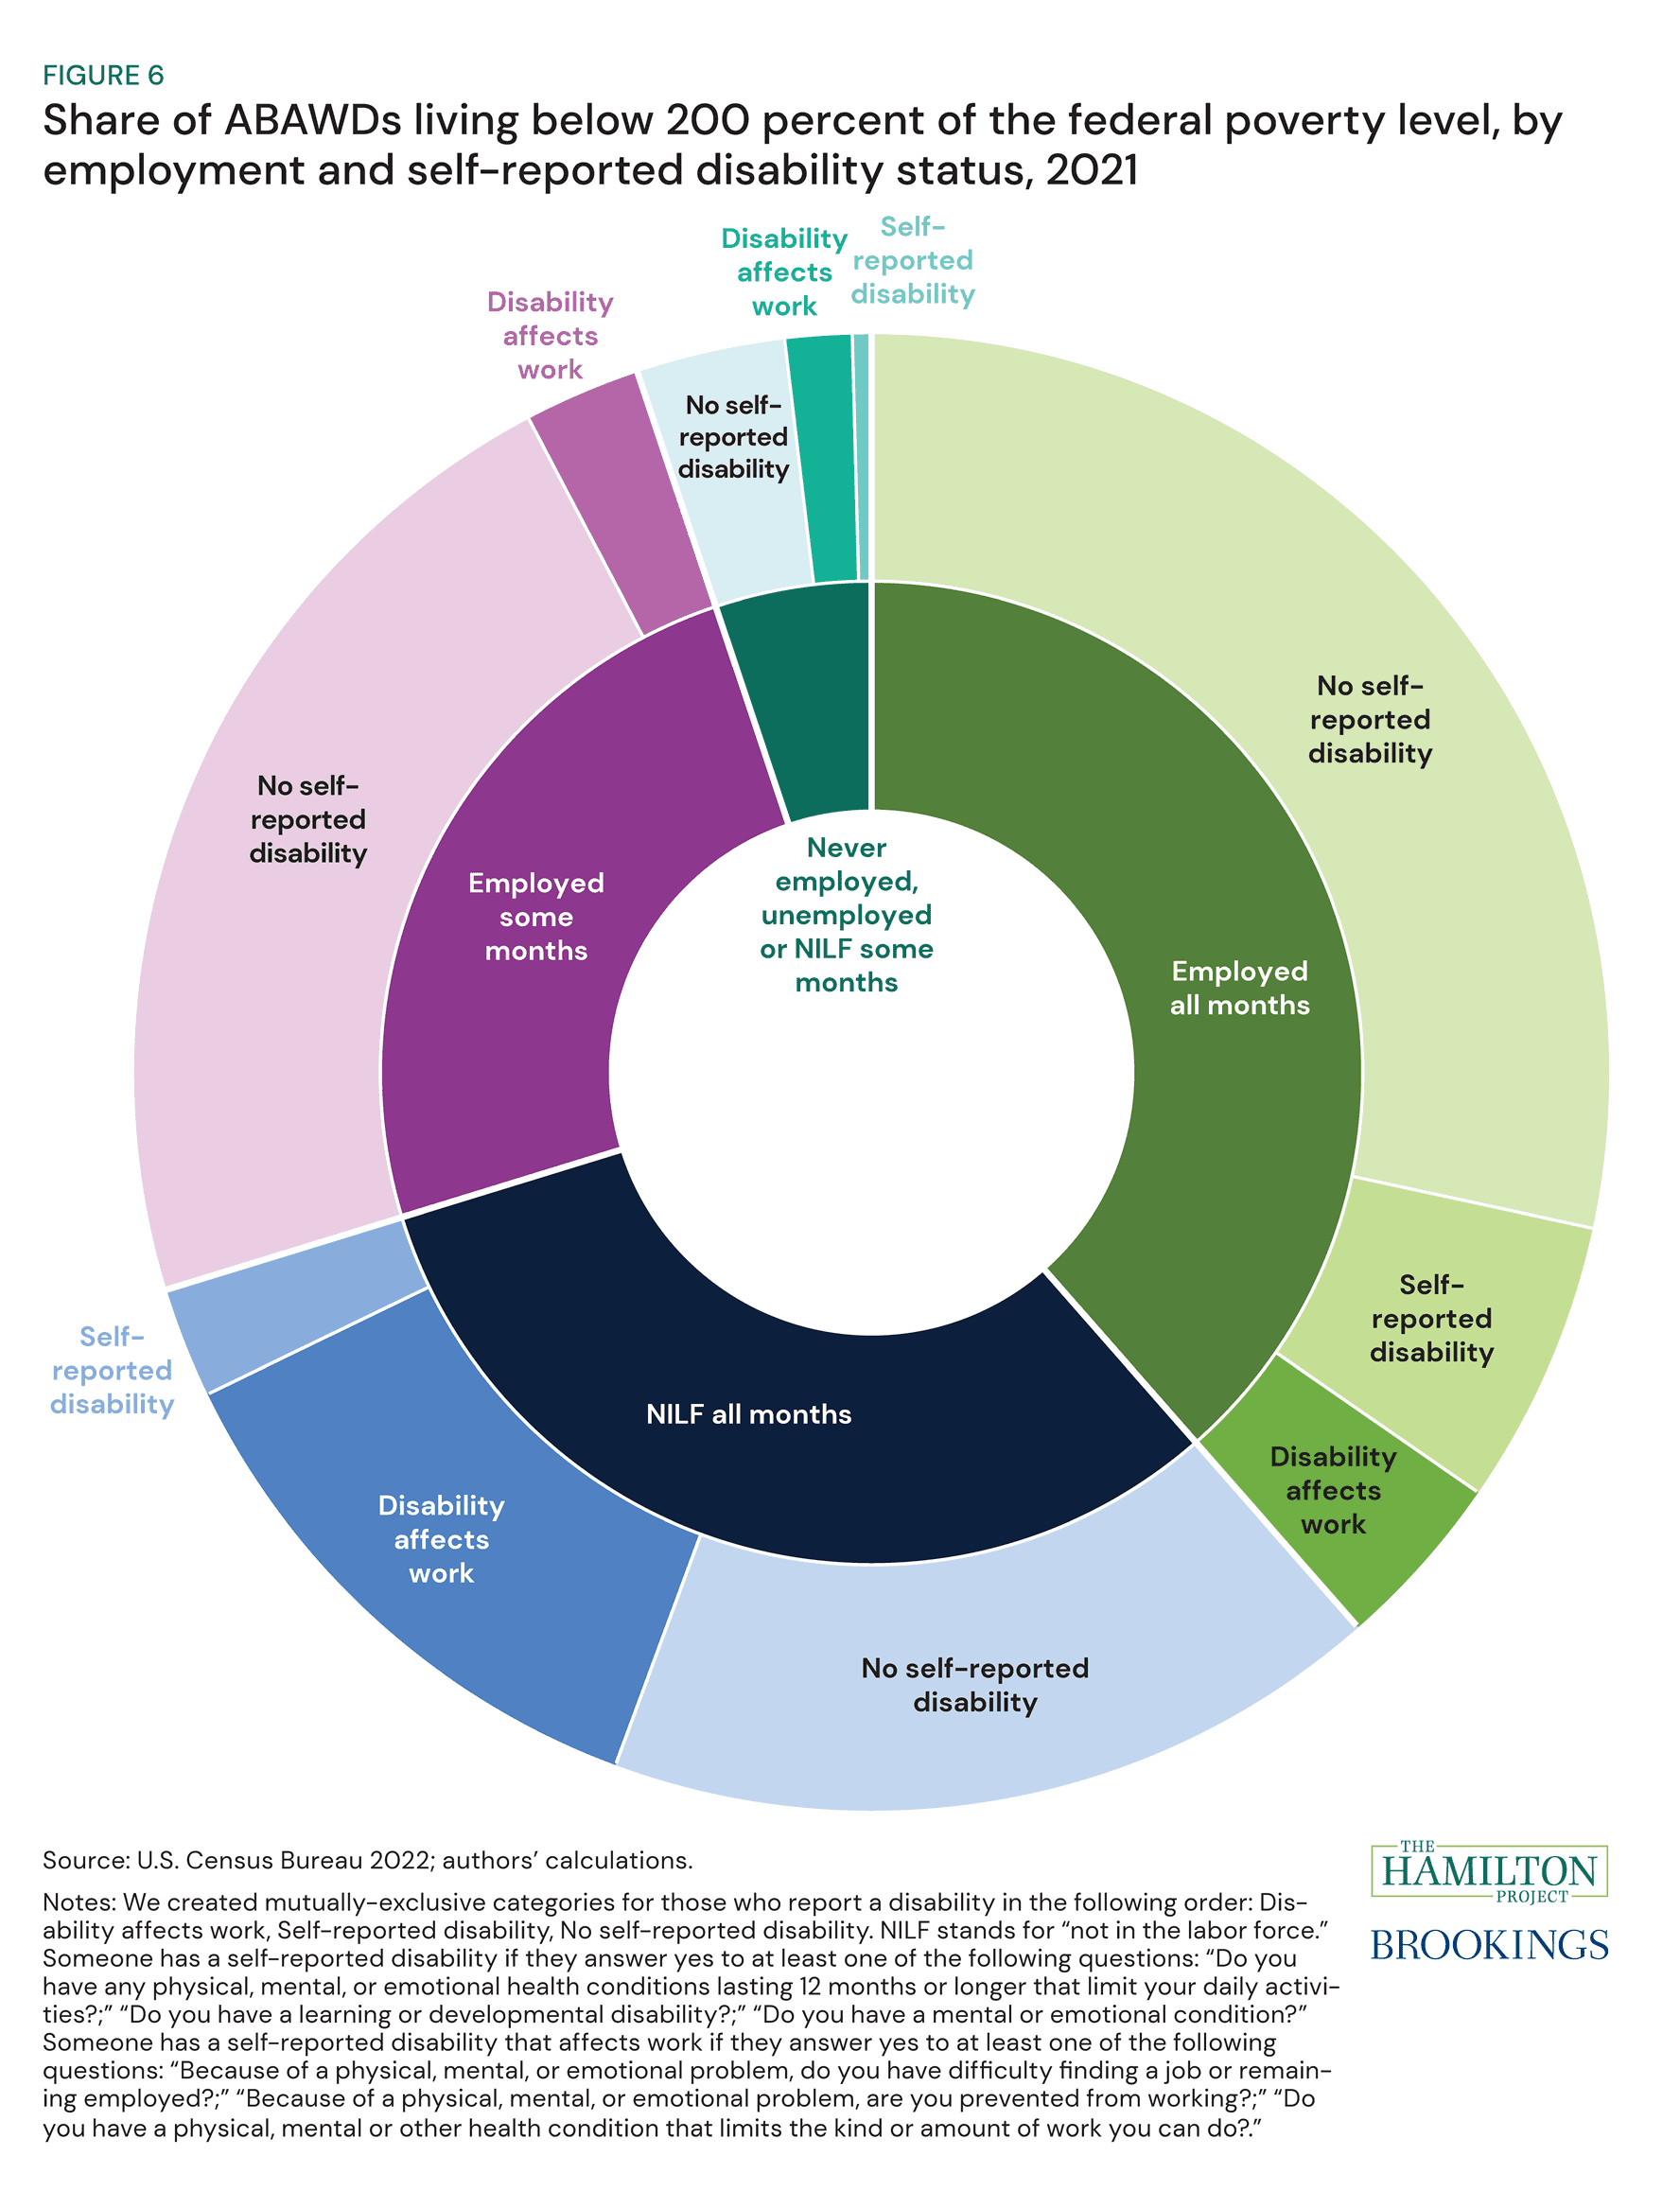
Click here to view the full interactive. The U.S. Department of Agriculture has released a final rule that would limit eligibility for SNAP work requireme…
Visit the interactive map, Chronic Absence: School and Community Factors. Reducing chronic absence and developing conditions for learning are instrumental…
We construct a composite measure of several different indicators to determine a county’s economic vitality. Employing a statistical technique called “confirmat…