
Child poverty is a persistent national issue with lifetime and intergenerational consequences, but the distribution of its incidence and its impacts vary. One dimension that deserves attention is the variation in child poverty by state and the effectiveness of and potential for federal policy to confront the problem. In this essay, the authors investigate how the CTC affected child poverty in states by two characteristics: state-level cost of living (high-cost versus low-cost states) and state-level poverty (high versus low pre-tax/transfer poverty rates). They find that while the CTC caused substantial reductions in poverty in each kind of state, poverty reductions were the highest in low-cost, high poverty states, i.e., those states with relatively lower cost of living and with a higher poverty baseline.
INTRODUCTION
The 2021 expansion of the Child Tax Credit (CTC) led to a historic reduction in poverty in the United States, particularly for children. Research showed that child poverty fell immediately and substantially. On an annual basis, according to the US Census Bureau, child poverty fell to its lowest level on record in 2021: 5.2 percent (Creamer et al. 2022). Moreover, the CTC benefit’s monthly delivery likely reduced volatility in income and poverty; research has shown that volatility compromises family and child well-being (Hamilton et al. 2022).
The dramatic reductions in poverty induced by the expanded CTC represent positive changes to economic well-being. There are potentially larger and longer-run benefits from an increase in economic security for families with low and moderate levels of income (Garfinkel et al. 2022). Income support enhances children’s lifetime social and economic outcomes by allowing families to meet basic needs and by increasing families’ income stability. Specifically, transfer programs that provide cash and near-cash supports have been shown to promote stronger educational, emotional, and health outcomes (Akee et al. 2018; Hardy 2022; Hardy, Hill, and Romich 2019; Hoynes, Schanzenbach, and Almond 2016; Rothstein and Wozny 2013).
The 2021 expanded CTC extended full refundability to families with little or no taxable income. Adults with young children between 0 and 5 years old received refundable credits of $3,600 per child, while those with children between 6 and 17 years old received credits of $3,000 per child. These benefit changes allowed for more of the lowest-income families—historically, those from non-Hispanic Black, Hispanic, and American Indian and Alaska Native communities (Hardy 2022)—to benefit from the program (Center on Poverty and Social Policy at Columbia University, 2021). The Census’s Supplemental Poverty Measure (SPM) showed that children from all racial and ethnic minority groups experienced relatively large reductions in poverty rates, but that SPM poverty rates fell most dramatically for Black and Hispanic children. Black child poverty rates fell by 17 percentage points between 2009 and 2021, while SPM child poverty rates fell from 30 percent to 8 percent among Hispanic children over the same period (Creamer et al. 2022).
But where in the country did the expanded CTC reduce child poverty the most? It is not obvious, for example, whether the expanded CTC would have reduced poverty more or less in higher-versus lower-poverty states, or whether the degree of poverty reduction differed by the cost of living in states. Income distributions vary across states, as does the depth of poverty (i.e., how close or far families lie from the poverty line) within any given state. One well-established feature of federally administered transfer programs is that they tend to reallocate resources from higher-income states to lower-income states. And, importantly, states vary on cost of living, which is an often-underexplored driver of poverty.
These differences across states are especially relevant today, given well-documented housing supply gaps and staggeringly high housing costs facing many families. On the one hand, some of the nation’s poorest states, disproportionately situated in the South, are among the least expensive. On the other hand, these same less-expensive states tend to provide weaker safety net protections and make lower investments in education; strong safety nets and higher investments in education are two core features of successful economic mobility strategies (Ziliak 2019).
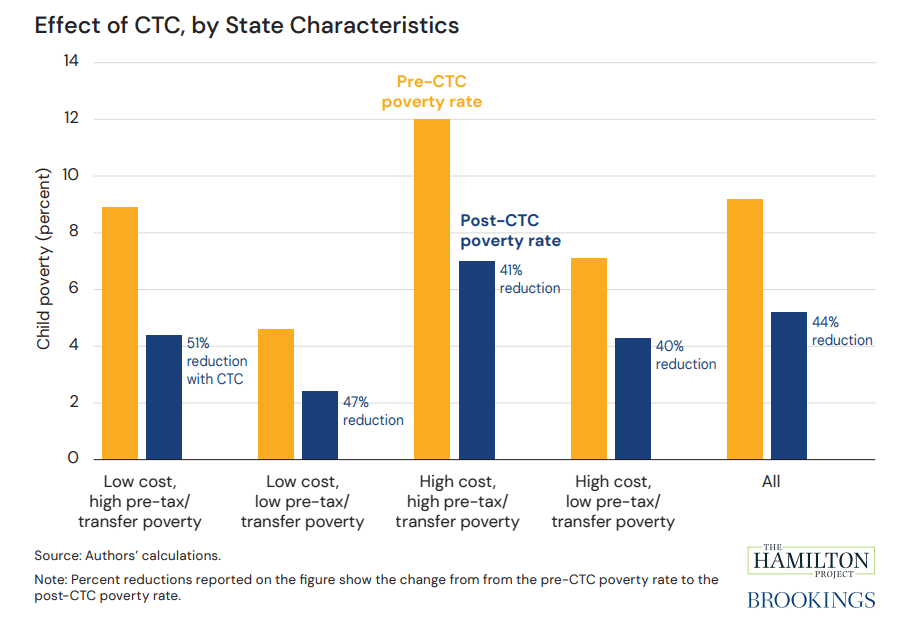
This essay investigates how the CTC affected child poverty across states. In our two primary analyses, we examine how the reduction in child poverty varies across two characteristics: state-level cost of living (high vs. low cost of living) and state-level poverty (high vs. low pretax/transfer poverty rates). We find that, although the CTC caused substantial reductions in poverty in each kind of state (i.e., high vs. low cost of living, high vs. low pretax/transfer poverty rates), poverty reductions were the highest in low-cost, high-poverty states, which are those states with a relatively lower cost of living and with a higher baseline poverty rate. It stands to reason that, when the expanded CTC sunset on December 31, 2021, those states were also where child poverty increased the most.