
An enduring narrative about the U.S. economy, along with rugged individualism and the opportunity to rise from rags to riches, is that it is a dynamic market where new ideas can thrive and new businesses can reshape the economic landscape.
Competition is the basis of a market economy. It forces businesses to innovate to stay ahead of other firms, to keep prices as low as they can to attract customers, and to pay sufficient wages to avoid losing workers to other firms. When businesses vie for customers, prices fall and economic output increases. When businesses hire workers away from each other, wages rise and workers’ standard of living improves. And as unproductive firms are replaced by innovative firms, the economy becomes more efficient.
Thus, competition allows the market economy to allocate resources efficiently. Without it, there can be distortions that reduce overall welfare, as concentrated interests benefit at the expense of the broader public. Entrenched incumbent firms with market power hire fewer workers, produce less output, and earn higher profits than would otherwise be the case in a competitive market. In attempting to secure and maintain their market power, firms can spend substantial resources that produce no value for the overall economy but simply allow the firm to maintain high profits.1
Over the past few decades there have been troubling indications that dynamism and competition in the U.S. economy have declined. This paper describes the state of competition in the economy, related patterns in entrepreneurship, and policies that promote or inhibit competition. Business dynamism and competition are inherently intertwined, though the linkages are complex. Dominant firms can crowd out new entrants and reduce entrepreneurship; at the same time, a lack of start-ups can reduce the entrants necessary to generate competition. Thus, we examine both growing market concentration and the reduced rate of entry by firms.
Read the full introduction
An enduring narrative about the U.S. economy, along with rugged individualism and the opportunity to rise from rags to riches, is that it is a dynamic market where new ideas can thrive and new businesses can reshape the economic landscape.
Competition is the basis of a market economy. It forces businesses to innovate to stay ahead of other firms, to keep prices as low as they can to attract customers, and to pay sufficient wages to avoid losing workers to other firms. When businesses vie for customers, prices fall and economic output increases. When businesses hire workers away from each other, wages rise and workers’ standard of living improves. And as unproductive firms are replaced by innovative firms, the economy becomes more efficient.
Thus, competition allows the market economy to allocate resources efficiently. Without it, there can be distortions that reduce overall welfare, as concentrated interests benefit at the expense of the broader public. Entrenched incumbent firms with market power hire fewer workers, produce less output, and earn higher profits than would otherwise be the case in a competitive market. In attempting to secure and maintain their market power, firms can spend substantial resources that produce no value for the overall economy but simply allow the firm to maintain high profits.1
Over the past few decades there have been troubling indications that dynamism and competition in the U.S. economy have declined. This paper describes the state of competition in the economy, related patterns in entrepreneurship, and policies that promote or inhibit competition. Business dynamism and competition are inherently intertwined, though the linkages are complex. Dominant firms can crowd out new entrants and reduce entrepreneurship; at the same time, a lack of start-ups can reduce the entrants necessary to generate competition. Thus, we examine both growing market concentration and the reduced rate of entry by firms.
By a number of measures, markets are more concentrated and possibly less competitive now than they were a few decades ago. From 1997 to 2012 the average revenues of the top four firms in a given industry rose from 24 percent to 33 percent of total industry revenues. As shown in figure A, the increase was broad-based.2 Profits have also increased as a share of the economy and become more unequal. Figure B shows that investment returns for the 90th percentile of nonfinancial, publicly traded firms grew 160 percent from 1997 to 2014; the 25th percentile grew only 2 percent over that same period.
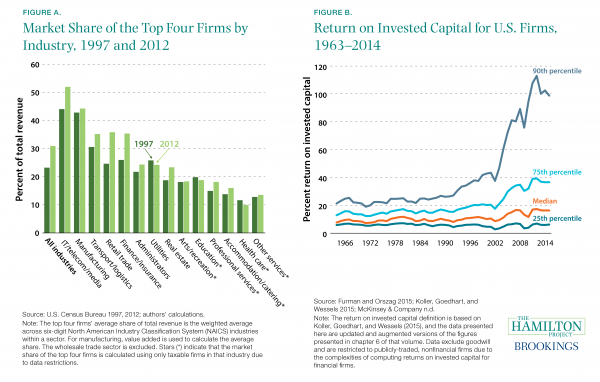
If innovations generate an increase in profits, one would expect competition to eventually bring down the profit margin. A set of firms that continuously earns very high profits year after year could imply that competition is not functioning as expected. Indeed, firms’ unequal investment returns have been persistent (Richardson et al. 2005; Waring 1996).3
Broadly speaking, declining market competition can be linked to public policy in two ways. The first is that policy—principally antitrust regulation—bears a responsibility for addressing economic trends that threaten competition, such as increasing concentration in product and labor markets.
The second linkage between competition and policy runs in the other direction: the actions of local, state, and federal governments can impede competition. Policies ranging from state subsidies to incumbent firms, to excessive licensure restrictions, to local land-use restrictions can all limit market entry of new firms, enabling incumbent firms to maintain their entrenched position.
Considered in this light, a number of U.S. economic trends are disconcerting. Measured productivity growth has slowed, investment by firms (relative to their profits) is lower than in the past, job mobility across firms has declined, and labor’s share of income has fallen.4 All of these trends have multiple causes, but all are consistent with reduced market entry by new firms—something that may be both a cause and a consequence of reduced competition.
Unless there has been a simultaneous upswing in the innovative capacity of large firms, this smaller role for new firms holds back productivity. Reduced entry means fewer innovations make their way into the marketplace from outside the incumbent firms. It means fewer workers are reallocated to firms that are more productive (Decker et al. 2014). It means workers receive fewer outside offers, likely reducing their bargaining position and suppressing wage growth, as described in a recent Hamilton Project framing paper (Shambaugh, Nunn, and Liu 2018).
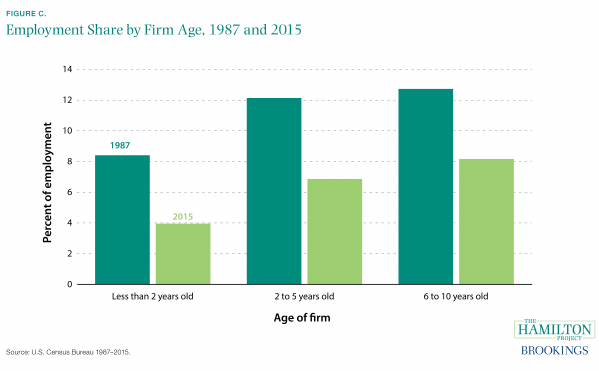
Over the past thirty years new firms have played a decreasing role in the economy, and now account for a much smaller share of employment. This reduction is the product of both a reduced start-up rate and lower employment levels of the remaining start-ups. Figure C shows the employment share of firms in 1987 and in 2015 by the age of the firm. In total, firms under the age of 10 made up just 19 percent of employment in 2015, down from 33 percent of employment in 1987.
The economics and policy of dynamism are at the core of The Hamilton Project’s mission. Supporting economic growth and promoting the competition that helps drive it are two chief objectives of public policy. This document aims to ground discussions of policies affecting competition in a clear assessment of the current economic situation. Chapter 1 therefore documents changes in the nature of competition in the U.S. economy, chapter 2 examines antitrust enforcement, chapter 3 explores reduced start-up rates and their impacts, and chapter 4 reviews government policies that may inhibit dynamism.
Chapter 1. Rising Market Concentration
Fact 1: Firm concentration is rising, particularly in retail and finance.
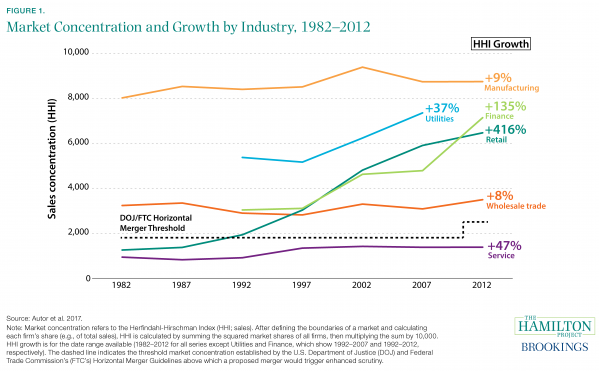
Economists and antitrust policymakers have long used a simple formula to assess the concentration in a market: the Herfindahl-Hirschman Index (HHI). After defining the boundaries of a market and calculating each firm’s share (e.g., of total sales), the HHI is calculated by summing the squared market shares of all firms, then multiplying the sum by 10,000.
In figure 1 we show the calculations of economists David Autor, David Dorn, Lawrence Katz, Christina Patterson, and John Van Reenen, who measure HHI for each narrowly defined industry, then take averages for much larger sectors like manufacturing and services (Autor et al. 2017). A number of sectors—most notably retail, finance, and utilities—show considerable increases in concentration. Manufacturing shows less growth, but industries within manufacturing tend to be highly concentrated. Even the service sector, which has a low average level of concentration, has seen considerable growth over the past three decades (47 percent). Other research tells a similar story, finding that over 75 percent of U.S. industries have registered an increase in concentration levels over the past two decades (Grullon, Larkin, and Michaely 2018).
However, it is possible that nationwide measures do not draw the most relevant boundaries for competition analysis; existing data allow for only imperfect estimates of concentration. Some researchers and policymakers contend that even the narrowest available industry data are too aggregated to be useful for examining concentration (Werden and Froeb forthcoming). If the relevant market is in fact much smaller or more regionally limited than the observed industry, concentration could be higher or lower than the data suggest. Nevertheless, industry-level HHI, like the measures of revenue concentration of the top 4 or top 50 firms in an industry, show a national economic landscape increasingly dominated by a set of larger firms. Other data—for example, rising profit shares or detailed market HHI—for assessing whether this concentration implies problematic market power can provide complementary evidence.
A few factors can drive increasing concentration: scale and network effects may tilt industries toward larger firms, mergers may generate fewer larger firms, or a declining start-up rate may leave fewer challengers to the incumbents. The next three facts describe why concentration might be rising.
Fact 2: Concentration is high in markets with large returns to scale and network effects.
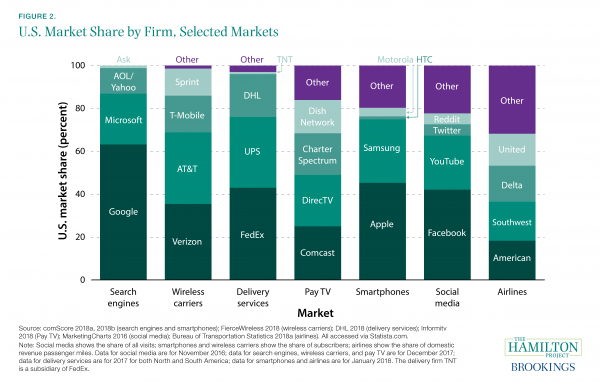
Market concentration has increased broadly throughout the economy. It is difficult to trace the underlying economic and policy factors that produced this increase, but it is instructive to examine selected markets where a few firms are dominant.
In several of the markets shown in figure 2 concentration appears to be related to returns to scale and network effects. For example, in “search engines,” “wireless carriers,” and “delivery services,” there are clear cost savings from large scale. High fixed costs—the infrastructure and technological expertise necessary to maintain a quality service—can be spread across many customers. Consequently, the respective top two firms of each market command 87 percent of the search engine market, 69 percent of the wireless carriers market, and 76 percent of the delivery services market.
In other markets customers derive direct benefits from the participation of other customers: a social media platform is effective only if it connects users. This connection generates powerful network effects, and the top two firms in this market account for two-thirds of total user visits.
However, the link between network effects and market concentration is not unchangeable: it depends on choices made by businesses and policymakers. For example, the 1996 Telecommunications Act required incumbent carriers to interconnect their services with competitors on nondiscriminatory terms, thereby muting network effects that might otherwise have prevented competition (Noam 2002).
Importantly, estimates of concentration can be sensitive to how markets are defined. In some cases, defining a narrower local market (e.g., subscriber TV in southwest Ohio) will lead to a different assessment of which firms are dominant, and by how much.
Fact 3: Mergers and acquisitions have become more common.
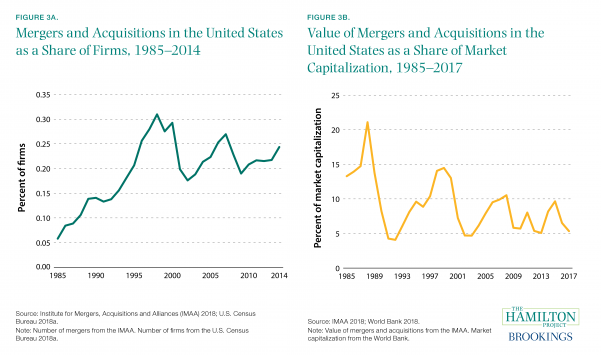
Not all market concentration is due to the normal expansion of businesses as they benefit from returns to scale. Firms frequently merge and acquire each other, combining their activities and pooling their market shares. The airline sector is a case in point: the top four firms served 43 percent of the market in 1985, but in 2017 that share had risen to 72 percent after decades of industry consolidation (Bureau of Transportation Statistics 2018b; authors’ calculations).5
Figure 3a shows the number of mergers and acquisitions (M&A) in the United States as a share of publicly listed companies. From 1985 to 2014 this share has increased from just 0.06 percent to 0.24 percent annually: relatively few firms merge in any given year, but the share has increased considerably. However, this increase was not matched by a similar rise in the value of M&As as a share of market capitalization, shown in figure 3b. One possibility is that M&A activity in earlier years may have removed some of the scope for high-value mergers in subsequent years.
Firms merge for a variety of reasons: to improve business efficiency, to enter new markets and access new technologies, and to acquire or maintain a monopolistic position in an industry, among others. Examining manufacturing M&A activity, one study finds that mergers raised markups (i.e., price relative to marginal cost of production), but did not enhance the productive efficiency of manufacturing plants (Blonigen and Pierce 2016).
Many mergers and acquisitions stem from the importance of technology in production processes. A 2018 survey of about 1,000 corporate executives reported that technology acquisition is a key driver of M&A deals, with 20 percent of respondents saying it is the most important. Executives also placed a high priority on “expanding customer base in existing markets” (19 percent) and “expand/diversify products or services” (16 percent; Deloitte 2018).
Fact 4: Common ownership may increase effective market concentration.
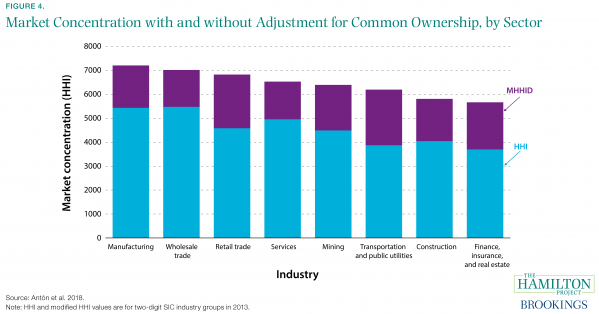
The baseline measurement of market concentration—the standard HHI—depends only on market definition and the market shares of all competitors. However, recent research has explored another variable that may be important for characterizing concentration: the extent to which ownership of competitors overlaps (Schmalz forthcoming). If two firms in a market are owned by the same people, those firms likely have less motivation to compete vigorously than would two firms owned by different people.
Figure 4 presents estimates from economists Miguel Antón, Florian Ederer, Mireia Giné, and Martin Schmalz of both the baseline HHI (blue bars) and the increment to HHI that is associated with the authors’ measurement of common ownership in that sector (purple bars) (Antón et al. 2018). The additional concentration that they calculate to be associated with common ownership added about 1,000 to HHI in 1994 and nearly 1,700 to HHI in 2013. In other words, common ownership boosted effective concentration to an increasing degree over time.
Much of this common ownership can be ascribed to two related forces: the rise of passive investing and the general investor desire to diversify equity holdings and thereby minimize risk (Posner, Morton, and Weyl forthcoming). Indeed, BlackRock and Vanguard were among the top 10 shareholders of more than two-thirds of public firms (Antón et al. 2018), and institutional investors have increased their share of U.S. equities from 7 percent in 1950 to 70–80 percent in 2010 (McCahery, Sautner, and Starks 2016). In the banking and airline sectors, large active investment firms such as Berkshire Hathaway sometimes own a large (top five) stake in many firms within the same industry (Azar, Raina, and Schmalz 2016; Azar, Schmalz, and Tecu forthcoming).
Some analysts contest whether index funds or other passive funds should be considered owners, given that the investors they represent are the ultimate holders of the asset. It is also controversial whether institutions’ ownership positions are large enough to provide them with influence over business decisions (Kennedy et al. 2017). More research is needed to understand how to measure common ownership and the impacts of ownership on competition. However, antitrust policymakers are beginning to address at least some forms of common ownership. For example, in response to a proposed merger between Red Ventures Holdco and Bankrate, the Federal Trade Commission (FTC) filed a complaint alleging that two of Red Ventures’ largest shareholders jointly owned a service that directly competed with a subsidiary of Bankrate. The parties were ordered to divest from the subsidiary (FTC 2018).
Fact 5: The investment rate has fallen by more than one-third since the early 1960s.
Market concentration has been linked to adverse consumer outcomes in many specific instances; firms with monopoly power can and do exploit their position through higher prices (DOJ 2008; Kwoka, Greenfield, and Gu 2015). Indeed, firms’ markups—one indicator of firms’ pricing power—have likely been rising (De Loecker and Eeckhout 2017). The broad-based increase in concentration, described in fact 1, has therefore prompted questions about broader economic impacts that increasing monopoly power might be causing.
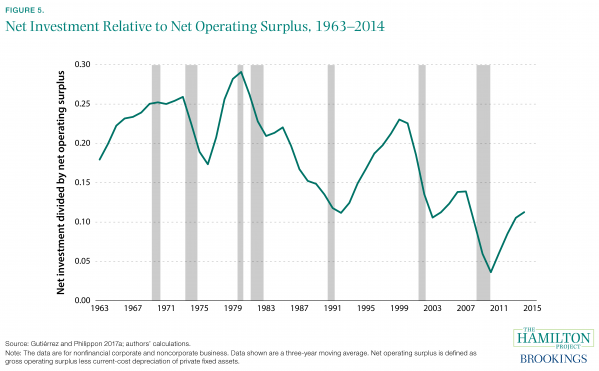
One focus of these questions is the long-run deterioration in U.S. business investment. Figure 5 shows a three-year moving average of net investment divided by net operating surplus from 1963 to 2014. After a strong surge in the 1990s, net investment has fallen to less than half of its 1970s level.
Work by Gutiérrez and Philippon (2017a) suggests that rising concentration is indeed related to the deterioration in investment: after adjusting for firms’ expected profitability and considering a number of alternative explanations, increased concentration emerges as a key driver of falling investment after 2000. Consistent with the research described in fact 4, Gutiérrez and Philippon also find that industries with a larger proportion of passive investment are characterized by diminished investment (though this could be for a variety of reasons).
An alternative explanation for the decline in measured investment—poorly measured intangible investment—also plays a role (Alexander and Eberly 2016). As the name suggests, intangible capital consists of valuable business assets like brand equity, business methods, and technical discoveries, rather than better-measured assets like plants, equipment, and land. Measured investment declines were larger in industries for which intangible capital is more important; Gutiérrez and Philippon (2017a) find that increasing intangible investment can explain as much as a third of the shortfall in measured investment.
Fact 6: Many firms have substantial power in labor markets.
Concentration in product markets can be mirrored by its labor market equivalent—monopsony—that exists when employers face limited competition for workers. In its extreme case, a monopsony is a firm that employs all the workers in a market: an example is a mining company in a remote town that has no other businesses. But many firms have at least some wage-setting power that derives from the willingness of their employees to accept lower wages than they could earn elsewhere.
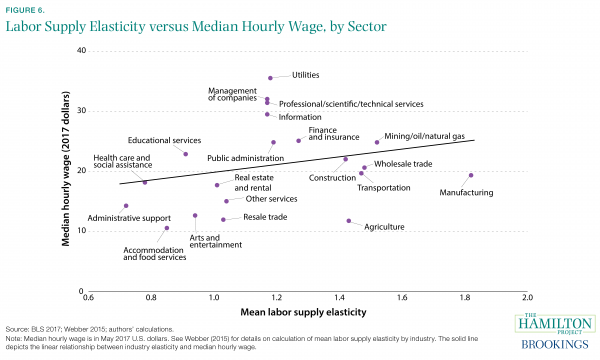
Economists attempt to quantify this employee willingness to accept lower wages in terms of the so-called labor supply elasticity. That is, what percent lower employment would a firm expect if it offered 1 percent lower wages? In a perfectly competitive labor market, this elasticity would be infinite: any reduction in wages below the competitive rate would result in the departure of all employees for other firms. In practice, this is unlikely to be the case even when there are many employers in a market, primarily because of the time and expense required for workers to find suitable new matches with other employers. This difficulty can be due both to the nature of job search as well as policy-related costs of hiring and employment separation (Diamond 1982; Mortensen and Pissarides 1994; Pissarides 2000).
Figure 6 depicts estimates of firm-level labor supply elasticities from Webber (2015), averaged across firms within industries. Firms generally face relatively inelastic labor supply (see also Staiger, Spetz, and Phibbs 2010). In other words, employers can reduce wages without losing all (or even a large fraction) of their workforces. Moreover, typical wages are higher for firms in industries with higher labor supply elasticities—and less monopsony power—both before and after adjusting for worker and firm characteristics (Webber 2015).
However, it is likely that labor supply elasticities are higher over longer periods, which allows workers to eventually find preferred employment. Moreover, Webber (2015) finds evidence that employers do not fully exploit their monopsony power. In addition, better work environments or schedules sometimes offset lower wages, which explains why workers are less apt to leave due to low wages.
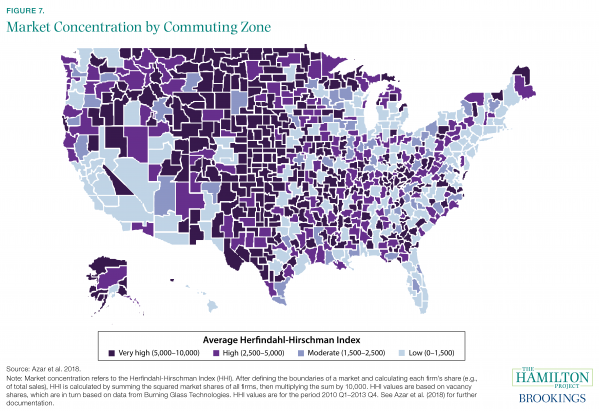
Fact 7: Employer concentration appears to be high in many local labor markets.
Rather than estimating monopsony power by looking at the elasticity of labor supply, other researchers have examined the degree of concentration in labor markets.
Figure 7 shows estimates of employer concentration from Azar et al. (2018). The authors examined online job posting data compiled by Burning Glass Technologies and defined hiring markets at the local level for specific occupations. They found striking variation in employer concentration across the country: for example, parts of the Northeast and Southern California have HHI—a measure of business concentration—below 1,500, while numerous rural areas in the Great Plains have HHI above 5,000, indicating extreme concentration. This concentration may matter for the wages that employers advertise: Azar, Marinescu, and Steinbaum (2017) find that an increase from the 25th to the 75th percentile in HHI is associated with a 17 percent decline in posted wages.
Rather than focus on vacancies, Benmelech, Bergman, and Kim (2018) study employment shares within industries and across counties, and find that concentration has been growing over time. Benmelech, Bergman, and Kim also find a substantial impact of concentration on manufacturing wages even when controlling for local economic conditions and when studying wages at different plants within the same firm. They find this effect has been getting stronger more recently and that less concentration is associated with a more direct transmission of productivity growth to wages. Interestingly, unionization appears to mitigate the negative impact of concentration on wages.
The potential link between employer concentration and wages is still the subject of an active research discussion. As with diagnosing monopoly power, understanding the boundaries of the market is both crucial and difficult. Posted vacancies might not accurately capture the true range of job options for workers; in addition, many workers can move across industries. Still, the observed associations between local concentration and wages—combined with the fact that concentration appears to be growing—suggest that the relationship between concentration and wages deserves more research and policy attention.
Chapter 2. Policy Responses to Firm Market Power
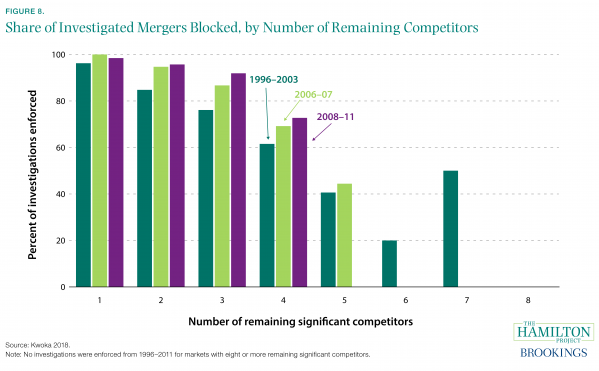
Fact 8. Fewer mergers are being blocked when at least five competitors would remain.
Antitrust regulators must take account of the many specific, idiosyncratic features of a merger proposal and the market it would impact. However, there are regularities in antitrust enforcement. Mergers tend to be approved when a sizable number of significant competitors remain in a market, or, alternatively, when HHI is low and a merger would not increase it by much (DOJ and FTC 2010).
The stringency of antitrust enforcement can also change over time. But it is difficult to infer changes in stringency from changes in regulatory outcomes. Outcomes are the product of multiple factors including DOJ and FTC actions, firms’ behavior (i.e., their level of aggressiveness in pursuing mergers), and changes in market structure that occur for reasons unrelated to merger activity; for example, rising returns to scale will tend to raise HHI even absent any mergers. Ultimately, what matters for markets is how many and what kinds of mergers regulators allow to occur.
Figure 8 shows FTC statistics on merger enforcement provided by John Kwoka (2018). Mergers that would leave only one or two remaining competitors are nearly always blocked, while mergers leaving three or four competitors are only sometimes challenged. In recent years antitrust regulators have not brought enforcement actions against proposed mergers that would leave five or more significant competitors. Interestingly, this has not always been the case. Antitrust regulators have become much less likely to act against mergers that would leave five, six, or seven competitors, while becoming slightly more likely to block mergers that would leave only one to four competitors. A similar pattern is observed by post-merger HHI.
Merger policy extends beyond merely blocking or permitting mergers. Of investigated mergers for which agency decisions and actions were disclosed, half were subject to divestiture or conduct requirements (Kwoka, Greenfield, and Gu 2015). In other words, firms were permitted to merge on condition of abiding by restrictions that regulators deemed necessary to ensure robust competition.
Chapter 3. Declining Business Dynamism
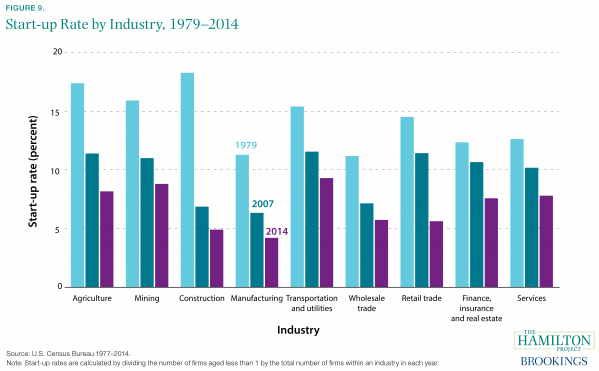
Fact 9: Start-up rates are declining across all sectors.
Across sectors of the economy, business start-ups are less common than they were decades ago. Figure 9 shows start-up rates in 1979, 2007, and 2014; the continuous decline across those three years demonstrates that the disappearance of start-ups is an ongoing trend and not primarily a cyclical phenomenon. Additionally, the consistent fall in start-up rates across industries is suggestive of a broad-based rather than sector-specific trend.
The fall in start-up rates has had negative effects on productivity growth. Replacement of low-productivity firms with high-productivity young firms, and reallocation of workers to the highest-productivity firms, are both crucial mechanisms for raising economic output and living standards (Alon et al. 2018; Haltiwanger et al. 2017). The fall in start-ups after 2000 was particularly pronounced for high-tech firms within the industries shown in figure 9; the high-tech sector has historically been a strong source of job creation and productivity growth (Decker et al. 2016).
Though declining business dynamism is not entirely understood, several factors have been identified as likely contributors. One important possibility is that increased market concentration is making the environment for start-ups inhospitable. Controlling for region-specific factors, Hathaway and Litan (2014) find that changes in the business consolidation rate (the ratio of mean firm size to mean establishment size) are negatively associated with changes in start-up rates at the metropolitan area level from 1978–80 to 2004–06.
Another possibility is that the declining start-up rate is partially a result of declining population growth, which reduces the supply of labor and consequently the capacity for new businesses to start and scale up (Karahan, Pugsley, and Şahin 2018). In addition to demographic trends, public policies ranging from non-compete contracts to land-use policies could have important roles (Shambaugh, Nunn, and Liu 2018). As discussed in chapter 4 of this document, there are also concerns that increasing regulations may make it more difficult for new firms to start.
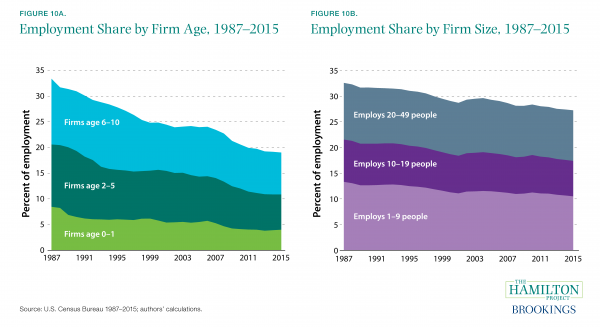
Fact 10: The employment share of young firms has decreased by more than one-third since 1987.
While the fall in the start-up rate is striking, it does not address some important questions about business dynamism. Is the decline part of a more general disappearance of small businesses? How is the decline in start-ups affecting the labor market? And what is happening to firms after they age out of the start-up category?
Figures 10a and 10b use Census Bureau Business Dynamics Statistics (1987–2015) to show how the employment shares of firms have changed over time, dividing firms by age and by size. In 1987 both relatively young firms (age 0 to 10) and small firms (with 49 or fewer employees) accounted for roughly a third of total employment, but by 2014 this share had dropped to 19.0 percent for relatively young firms and 27.2 percent for small firms. While young and small firms have both dwindled in labor market importance, the position of young firms has deteriorated more rapidly.
Given their significance for productivity and wage growth, it is particularly important to examine the changing employment shares of young firms. Within firms age 0 to 10, the decline was evenly distributed across all three age groups shown in figure 10a. Young firms employ a smaller share of the population both because there are fewer of them and because each employs fewer people on average than in the past. Decomposing the reduction in the employment share of firms age 0 to 5, we find that falling number of workers per firm accounted for about 40 percent of the decline, while the decreasing number of firms accounted for 60 percent. For firms age 6 to 10, 75 percent of the declining employment share was due to falling firm size over time (authors’ calculations).
Recent start-ups are producing strikingly fewer jobs than their predecessors, and this is particularly the case during their earliest years. Net job creation as a fraction of employment for one-year-old firms (not shown) hovered in the 1 to 2 percent range from the late 1980s through 2000—as the surviving start-ups added more employment than failing start-ups subtracted—but the rate fell gradually to less than –10 percent in 2009, has not fully recovered since then, and still remains negative. At the same time, the net job creation rate for two- to five-year-old firms was more consistently negative.9
Fact 11: Businesses are taking longer to form, while business applications have declined.
Understanding business formation and the policy factors that support or undermine it is crucial to maintaining a dynamic, competitive economy. Drawing links between the two is usually not straightforward, but data are increasingly becoming available that support this research.
A new dataset from the Census Bureau—the Business Formation Statistics—reveals that the typical time between application and business formation has steadily increased in recent years. Figure 11a shows that the average number of months increased from 4.5 to 5.7 between 2004 and 2013.
This increasing duration could reflect increasing entry costs, including regulations related to business formation, as well as changing mix of business types or other changes in entrepreneurs’ behavior. Interestingly, federal regulation does not appear to be limiting business dynamism (Goldschlag and Tabarrok 2018), although available data with which to explore this question are very limited.
Figure 11b shows a related trend: the number of high-propensity business applications, defined as those applications that have characteristics associated with becoming an employing business, has declined from about 350,000 in 2004 to 290,000 in 2013. Though most of the decline occurred during the Great Recession, applications have not rebounded in subsequent years. Reflecting a different focus on start-ups likely to have superior growth outcomes, Guzman and Stern find that the rate of high-impact start-ups was very high in the late 1990s, followed by a lower but stable period in the 2000s (Guzman and Stern 2016).
One relevant type of entry cost is financing, the availability of which varies in response to both economic and policy developments. Interestingly, places with larger collapses in housing prices experienced larger reductions in high-propensity business applications, suggesting that home equity is an important source of capital that varies with the business cycle (Bayard et al. 2018). These regions also typically had worse outcomes during the Great Recession, which likely depressed entrepreneurship directly, and not only indirectly through the balance sheets of potential entrepreneurs.

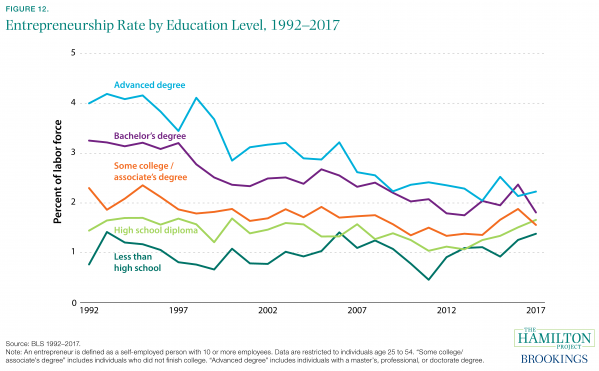
Fact 12: The entrepreneurship rate has fallen by almost half for workers with a bachelor’s degree.
The factors that impede or promote business dynamism do not affect all businesses or entrepreneurs equally, and an exclusive focus on business-level data can obscure some of the ways that individual entrepreneurs are changing. Accordingly, figure 12 examines trends in entrepreneurship—defined here as self-employment with at least 10 employees—by the educational attainment of entrepreneurs.
For people with more than a high school diploma, entrepreneurship is a less common vocation than it was 25 years ago. The decline is especially pronounced among those with advanced degrees: in 1992 4.0 percent of 25- to 54-year-olds with an advanced degree (beyond a bachelor’s) were entrepreneurs. By 2017 this rate had fallen to 2.2 percent.
This falling rate of entrepreneurship is likely related to rising wages for highly educated workers, which make entrepreneurship a less attractive option than formal employment (Lucas 1978). Kozeniauskas (2018) argues that rising fixed costs for setting up a business (perhaps due to regulation, the presence of large competitors, or other factors) explain a large part of the decline in overall entrepreneurship, and that skill-biased technological change helps explain the steeper decline in entrepreneurship for those with college degrees. Wages for those with college degrees have risen relative to wages earned by less-educated workers, which might contribute to highly educated workers staying in the paid labor force rather than starting their own firms (Salgado 2018).
The decline in entrepreneurship of highly educated individuals may be of concern given that these individuals are far more likely to engage in patenting, and having some form of intellectual property makes it more likely that a firm will become a high-growth start-up (Guzman and Stern 2016).
Chapter 4. Policy Impediments to Competition
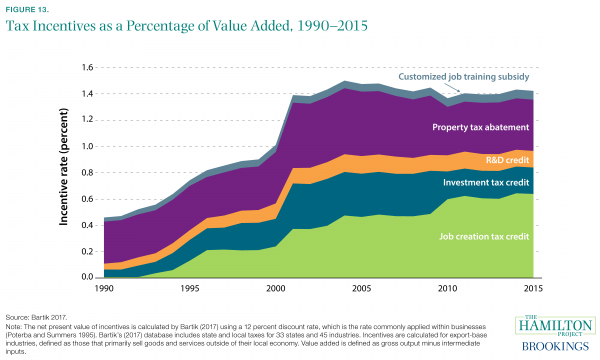
Fact 13: State subsidies to businesses have tripled since 1990.
When a major firm enters a new state or community it can have a substantial impact on the local economy (Greenstone, Hornbeck, and Moretti 2010). As large firms select new communities for additional or relocated facilities, state and local subsidies can be powerful inducements to select one location over another. State and local policymakers have a clear incentive to attract such businesses, and in fact try to do so using a variety of policy instruments, including various tax credits and other subsidies.
Unfortunately, such tailored subsidies place young and small firms at a disadvantage. Typically too small to merit the special attention of state policymakers, these businesses must face relatively high effective tax rates when they compete with larger, more-established businesses who have received incentives.
Figure 13 presents data from Bartik (2017) that document the sharp rise in state and local use of targeted business incentives for export-base industries (businesses that sell outside the local area or compete with goods and services from outside the local area). These incentives—job creation, investment, and R&D tax credits, as well as property tax abatements and job training subsidies—collectively rose from 0.5 percent of business value added in 1990 to 1.4 percent in 2015. Increased use of job creation tax credits alone accounted for 66 percent of the increase. At the same time, the gross tax rate facing businesses declined from 4.7 percent of value added to 3.3 percent, further reducing firms’ effective tax burden (Bartik 2017). Importantly, the data shown in figure 13 understate the extent of business incentives because they do not include the largest subsidies that are provided to firms making investments larger than $100 million.
State and local business incentives are generally considered to be part of a zero-sum contest between jurisdictions, most or all of which would be better off if the use of incentives were categorically eliminated (Chirinko and Wilson 2008). But it is not clear that all incentives even confer a sizable benefit on jurisdictions that use them; carefully evaluated incentives have generally not appeared to be cost-effective (Bartik and Erickcek 2014).
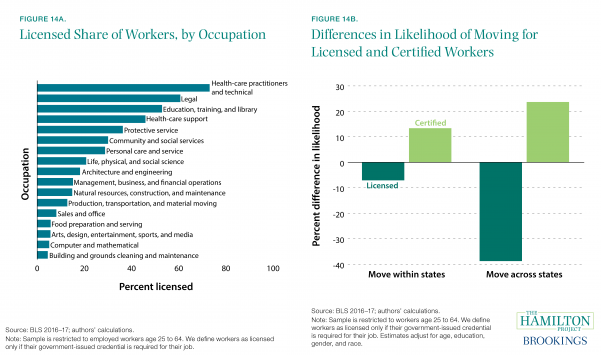
Fact 14: Occupational licensing is common and associated with diminished worker mobility.
State policies, from land-use rules to business permitting to licensing restrictions, are economically consequential. However, such regulations are often subjected to less scrutiny and less-rigorous cost-benefit analysis than are federal regulations (Glaeser and Sunstein 2014). Because they are defined at the state level, inconsistencies across states can also have economic impacts, including diminished geographic mobility.
Occupational licensing is a prominent example of such policies. Intended to protect public health and safety, licensing nonetheless imposes substantial costs on some consumers and workers. By definition, licensing is a restriction on entry into certain occupations, which reduces competition in those occupations. In addition, licensing often constrains the ways in which work is structured, limiting innovation and economic growth (White House 2015).
Figure 14a gives a sense of how widespread licensure is, displaying the fraction of working-age employees who are licensed in various large occupational groups. More than a fifth of all employees hold licenses, but the fraction varies considerably across professions. Health-care practitioners and legal workers are the most likely to be licensed, with 73 and 61 percent of workers licensed, respectively, while only about 5 percent of workers in computer and mathematical occupations are licensed.
Figure 14b focuses on just one economic impact of state licensure: lower geographic mobility. Licensed workers—who generally must pay to be relicensed after an interstate move—are much less likely to move across state lines than are comparable workers without licenses, but only slightly less likely to move within their state. The discrepancy in interstate mobility rates is particularly pronounced when relicensure is more onerous for workers (Johnson and Kleiner 2017). Voluntary certification, which is often suggested as an alternative to mandatory licensure, is associated with somewhat higher interstate mobility (see figure 14b).
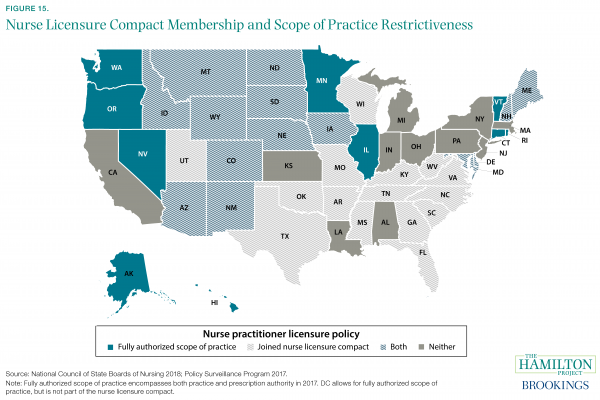
Fact 15: Health-care licensure rules vary in ways that matter for competition and mobility.
As described in fact 14, occupational licensing is a core labor market institution that aims to protect public health and safety by limiting entry into a profession—in other words, by limiting market competition (Kleiner and Krueger 2013; Kleiner et al. 2016). Figure 15 focuses on one large licensed occupation, showing how nurse practitioners are licensed across the states. Though public discussion of the institution often focuses on occupations that have been more recently licensed (e.g., interior designers or tour guides), the economic impacts of licensure are likely to be especially important in the economically large health-care sector, which accounts for more than one-quarter of all licensed workers (authors’ calculations).
Two important dimensions of licensure policy variation in the health-care sector are scope of practice restrictiveness and interstate reciprocity. Research on scope of practice generally finds that allowing non-physician providers (e.g., nurse practitioners, physician assistants, and certified nurse midwives) to perform additional tasks and to perform them in a more autonomous setting can help improve access to health care without reducing quality (Adams and Markowitz 2018).
Lack of reciprocity in licensing is another way that state policy limits competition. Health-care workers in particular are often prevented from remotely serving patients who reside in other states, a promising and increasingly feasible practice referred to as telemedicine. The Nurse Licensure Compact is one means of addressing this problem, working toward interstate reciprocity and harmonization of standards. Twenty-nine states have joined or are in the process of joining the compact (see figure 15). Interstate compacts for physical therapists, physicians, psychologists, pharmacists, dentists, social workers, and other professions are either in place or under construction.
Conclusion
The American economy rests crucially on the ideas and new businesses that form across the country, adding new products and innovations as well as competing with existing firms. A range of data show both increases in concentration in various industries and a decline in the number and activity of start-ups. These facts coincide with declining productivity, investment, and labor market dynamism.
The relationship among competition, dynamism, and broader economic outcomes is complicated. In some cases, growing concentration may be a natural consequence of the changing landscape of industries; moreover, it can be harmless if the threat of market entry causes incumbent businesses to act as if they face rigorous competition at all times. In other cases, though, it seems that growing concentration has come with declining investment, fewer new firms, and more market power for firms in labor markets.
Many of these new developments warrant policy action to ensure robust competition and economic prosperity. Other developments merit further study to better understand how the changing economic context affects living standards over time. Public policy can help, especially by ensuring robust competition, by avoiding regulations that either deliberately or accidentally stifle competition, and by supporting new firm growth rather than subsidizing incumbents.
1. For example, see Gilbert and Newbery (1982) for a discussion of this dynamic as it pertains to patent activity.
2. See also Galston and Hendrickson (2018) and The Economist (2016). A similar increase is observed when examining the top 50 firms (CEA 2016).
3. Richardson et al. (2005) document persistence in firms’ returns on assets over time (see table 5, panel A).
4. It is possible that productivity growth and investment are higher than in reported statistics due to measurement challenges in new industries. However, for that to explain a slowdown in growth, the problem would have had to have gotten notably worse in the last 15 years.
5. For this calculation, airline market share is defined in terms of the total miles traveled by paying passengers.
6. The HHI is the sum of the squared market shares of all the firms in a market.
7. As an example, in 1998 the DOJ brought suit against Microsoft due to its bundling of the Internet Explorer web browser with its Windows operating system.
8. Some researchers have argued that the Dodd-Frank Act of 2010 discouraged small business lending in particular (Bordo and Duca 2018).
9. The net job creation rate is measured as a 5-year moving average. Employment is measured as the average employment of the current and previous year.